Figures & data
Table 1 Primers Used for Real-Time PCR Analysis
Figure 1 The expressions of IL-17A, IL-17F and IL-22 in neutrophils after stimulation with different cytokines combined with IL-23. (A) Freshly isolated bone marrow neutrophils treated with various cytokines plus 50ng/mL IL-23. The mRNA expression levels of Th17-type cytokines IL-17A, IL-17F and IL-22 were determined by real-time PCR. (B) Real-time PCR analysis of IL-17A, IL-17F and IL-22 mRNA expression in neutrophils treated with IL-18 (25 ng/mL) plus different concentrations of IL-23 (0–50 ng/mL) for 24 hr. (C) Real-time PCR analysis of IL-17A, IL-17F and IL-22 mRNA expression in neutrophils treated with IL-23 (10 ng/mL) plus different concentrations of IL-18 (0–200 ng/mL) for 24 h. All data were obtained from the average of repeated samples and shown as Mean±SD (n=3), *P<0.05, **P<0.01 compared with the control group or IL-23 or IL-18 alone treated cells.
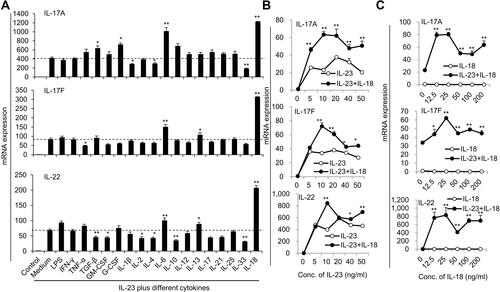
Figure 2 Time kinetics of cytokine expression in N(IL-23+IL-18). (A) Neutrophils treated with LPS (100 ng/mL), IL-23 (10 ng/mL), IL-18 (25 ng/mL) and IL-23 (10 ng/mL) plus IL-18 (25 ng/mL) for different time points (0–24h). Real-time PCR analysis of IL-17A, IL-17F and IL-22 mRNA expression in neutrophils were performed. (B) ELISA analysis of IL-17A, IL-17F and IL-22 protein levels in the supernatant of the treated neutrophils for different time (0–24h). (C) Real-time PCR analysis of IL-1β, IL-6 and TGF-β mRNA expression in neutrophils treated with IL-23 (10 ng/mL) and/or IL-18 (25 ng/mL) for different time (0–24h). All data were shown as Mean±SD (n=3), *P<0.05, **P<0.01 compared with IL-18 alone treatment group.
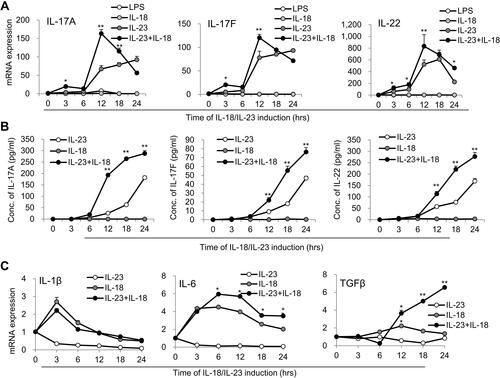
Figure 3 IL-23 plus IL-18 stimulate the highly purified mouse neutrophils to express IL-17A, IL-17F and IL-22. (A) The sorted mouse bone marrow neutrophils by a flow cytometry were treated with IL-23 (10 ng/mL) and/or IL-18 (25 ng/mL) for 24h. Real-time PCR analysis of IL-17A, IL-17F and IL-22 mRNA expressions in neutrophils. (B) Flow cytometry sorted mouse bone marrow neutrophils were treated with IL-23 (10 ng/mL) and/or IL-18 (25 ng/mL) for 24h. ELISA analysis of IL-17A, IL-17F and IL-22 protein levels in the supernatant of the treated neutrophils. (C) The kinetics of IL-17A-GFP expression in neutrophils treated with IL-23 (10 ng/mL) and IL-18 (25 ng/mL). All data were shown as Mean±SD (n=3), **P<0.01 compared with control group.
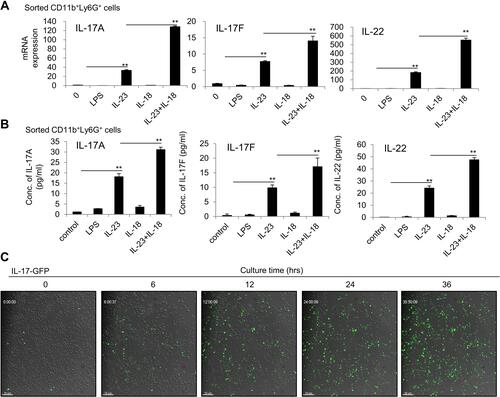
Figure 4 IL-23 plus IL-18 stimulate human peripheral neutrophils to express IL-17A, IL-17F and IL-22. (A) The sorted human peripheral blood neutrophils were treated with IL-23 (10 ng/mL) and/or IL-18 (25 ng/mL) for 12h. Real-time PCR analysis of IL-17A, IL-17F and IL-22 mRNA expressions in neutrophils was performed. (B) Flow cytometry analysis CD15+CD16+IL-17A+ neutrophils after the sorted human peripheral blood neutrophils were treated with IL-23 (10 ng/mL) and IL-18 (25 ng/mL) for 12h. All data were shown as Mean±SD (n=3). Experiments were repeated twice with identical results. *P<0.05, **P<0.01 compared with control group.
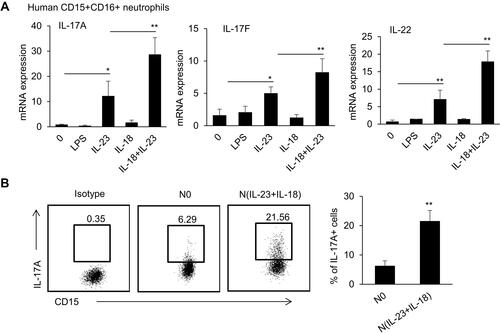
Figure 5 Gene transcriptional expression characteristics in IL-23 and IL-18-treated mouse neutrophils. (A) Principal component analysis of the four groups including neutrophils treated with none, IL-23 (10 ng/mL) and/or IL-18 (25 ng/mL). All expressed genes were used for the analysis. Each group contains three parallel samples labeled in the same color. (B) Heatmap of the whole gene expression profile in four group. Color and number represented that the genes obtained from the comparison of differential expressed genes between IL-23 group and IL-18 group. (C) bubble plot of KEGG pathway enrichment analysis. (D) Heatmap of the significantly changed cytokines in N(IL-23+IL-18). (E) Heatmap of the significantly changed chemokines in N(IL-23+IL-18). (F) Heatmap of the significantly changed transcriptional factors in N(IL-23+IL-18).
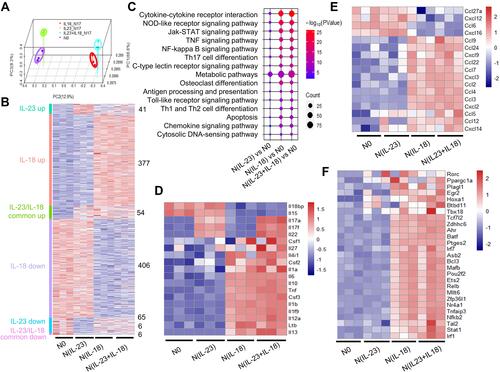
Figure 6 Transcription characteristics of IL-23 and IL-18 stimulated mouse neutrophils. (A) Network of cytokines and KEGG signaling regulating pathways of mouse N(IL-23+IL-18) vs N0. The color represented the Log Fold Change of differential expressing genes. (B) Network of up-regulated transcription factors in N(IL-23+IL-18). The color and size represented the TPM value and Log Fold Change respectively. (C) Transcription factors and genes regulatory network in mouse N(IL-23+IL-18).
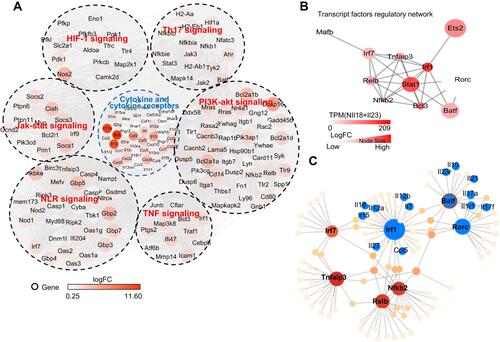
Figure 7 IL-17A, IL-17F and IL-22 expression in mouse N(IL-23+IL-18) cells are mediated by JNK/P38-STAT3-BATF signaling pathways. (A) The mRNA expression levels of BATF, STAT3, Sox5, IRF4, and C-Maf in mouse neutrophils treated with IL-23 (10 ng/mL) and IL-18 (25 ng/mL) for different time course were determined by real-time PCR. (B) N(IL-23+IL-18) treated with two concentrations of JNK inhibitor (SP600125) for 12h, real-time PCR was used to analysis IL-17A, IL-17F, IL-22, STAT3 and BATF mRNA expression levels. (C) N(IL-23+IL-18) treated with two concentrations of P38 inhibitor (SB203580) for 12h, real-time PCR was used to analysis IL-17A, IL-17F, IL-22, STAT3 and BATF mRNA expression. (D) Mouse N(IL-23+IL-18) neutrophils treated with two concentrations of JNK activator (Anisomycin) for 12h, real-time PCR was used to analyze IL-17A, IL-17F, IL-22, STAT3 and BATF mRNA expression. (E) Mouse N(IL-23+IL-18) neutrophils treated with two concentrations of p38 activator (Dehydrocorydaline) for 12h, real-time PCR was used to analysis IL-17A, IL-17F, IL-22, STAT3 and BATF mRNA expression. (F) Western blot assays were used to detect p-STAT3, STAT3, and BATF expression in mouse N(IL-23+IL-18) neutrophils treated with JNK/p38 inhibitors. (G) Western blot assays were used to detect p-STAT3, STAT3, and BATF expression in mouse N(IL-23+IL-18) neutrophils treated with JNK or p38 activator. All data were shown as Mean±SD (n=3), *P<0.05, **P<0.01 compared with control group.
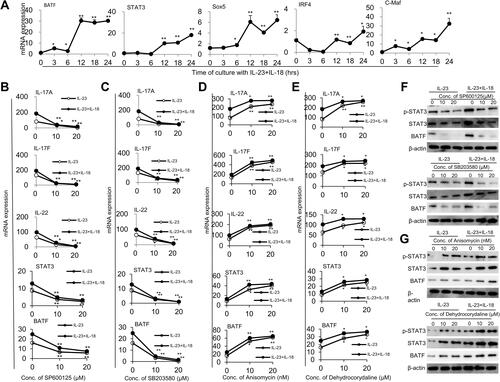
Figure 8 Adoptive transfer of N(IL-23+IL-18) promotes EL4 tumor growth in mice. (A) Adoptive transfer of medium, N0, N1, N2, and N(IL-23+IL-18) neutrophils (sorted CD11b+Ly6G+ neutrophils) to EL4 tumor-bearing mice on day 2, 6 and 10, respectively. Representative pictures of tumor on day 18. (B) Tumor size. (C) Tumor incidence. (D) Tumor weight. (E) Cell number in tumor. (F) HE staining of tumor tissue. (G) Real-time PCR analysis of IL-17A, IL-17F and IL-22 mRNA expressions in tumor tissue on day 17. (H) GFP+N(IL-23+IL-18) neutrophils were i.v. injected into syngeneic mice which were seeded EL4 tumor cells 10 days earlier. Flow cytometric analysis of the percentage of GFP+ neutrophils in PBMC, BMC, spleen, LNs and tumor at different times. All data were shown as Mean±SD, n=5, **P<0.01 compared with control group.
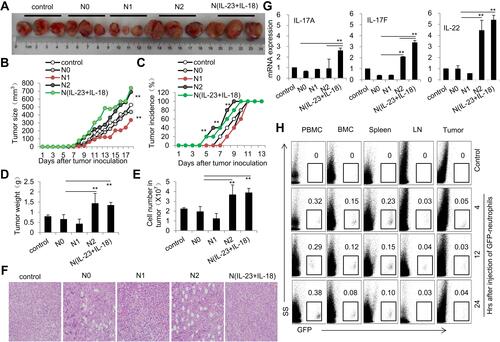
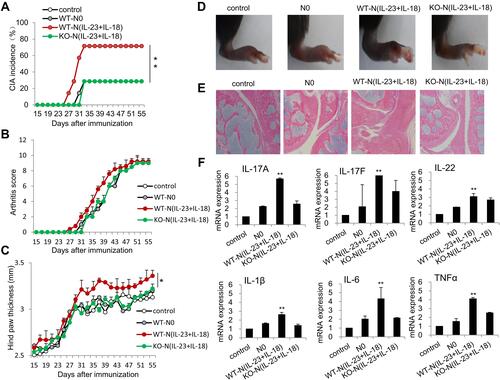
Figure 9 Adoptive transfer of N(IL-23+IL-18) promotes pathogenesis in the CIA mice. (A) Adoptive transfer of medium, WT-N0, WT-N (IL-23+IL-18), IL-17A-KO-N (IL-23+IL-18) (sorted CD11b+Ly6G+ neutrophils) to CIA mice, respectively, on day 21, 25, 29 and 33. CIA incidence were shown. All mice were sacrificed on day 56 and the following experiments were performed. (B) Arthritis score. (C) Hind paw thickness. (D) Representative pictures. (E) HE staining of the joint tissues. (F) The mRNA expression of IL-17A, IL-17F, IL-22, IL-1β, IL-6 and TNF-α in synovial fluid cells of mice. All data were shown as Mean±SD, n=7, *P<0.05, **P<0.01 compared with control group.