Figures & data
Figure 1 The biological effect of aberrant FSS on primary chondrocytes. (A) FSS affects the morphology of primary chondrocytes. (B) FSS significantly decreases primary chondrocytes viability. (C) mRNA level of cartilage-related markers, hypertrophy-related markers and proinflammatory mediators was regulated by FSS. (D) Western blot assay demonstrated the protein expression of COLII, SOX9, COX-2, and MMP13 was mediated by FSS. (E) Immunofluorescence assay indicated the protein expression of COLII, SOX9, COX-2, and MMP13 was mediated by FSS. Scar bar, 50 μm. *p < 0.05, **p < 0.01, ***p < 0.001.
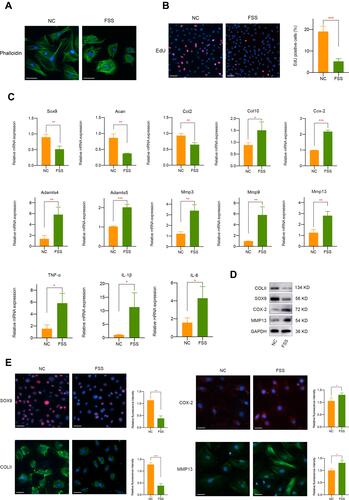
Figure 2 FSS results in H3K4me3 activation and KMT2B upregulation. (A) Western blot results of H3K4me3, H3K9me3, H3K27me3, H3K36me3,and H3K79me3 expression in chondrocytes exposed to FSS. (B) Immunofluorescent staining of H3K4me3 in chondrocytes after FSS treatment. (C) The mRNA level of H3K4 methyltransferases in chondrocytes under static or FSS conditions. (D) The protein expression of KMT2B was significantly upregulated after FSS treatment. Scar bar, 50 μm. **p < 0.01, ns, not significant.
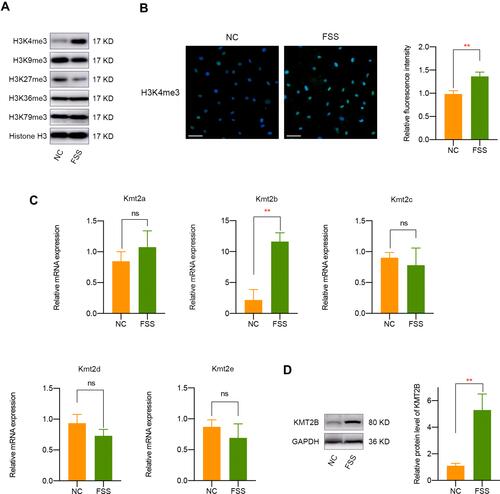
Figure 3 Pharmacological inhibition of H3K4me3 activation by MM-102 partially rescues the negative effect of FSS on chondrocytes. (A) Pretreatment of MM-102 in primary chondrocytes could alleviate SNP-induced apoptosis activities. (B) qPCR results indicated the inhibition of H3K4me3 activation by MM-102 partially rescues the negative effect of FSS on chondrocytes. (C) Western blot results of COLII, SOX9, COX-2, and MMP13 in chondrocytes exposed to FSS with or without MM-102 pretreatment. *p < 0.05, **p < 0.01, ***p < 0.001.
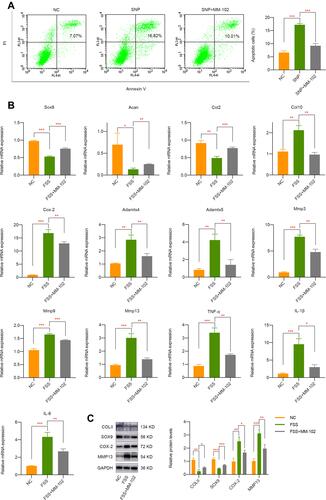
Figure 4 Identification of ZBTB20 as H3K4me3-target gene in chondrocytes exposed to FSS. (A) Overlapping differentially expressed genes was identified by the intersection of RNA-seq of chondrocytes exposed to FSS and CUT&Tag sequence of H3K4me3 in cells with or without shear stress treatment. (B) qPCR validation of candidate H3K4me3-target genes caused by FSS. (C) Representative IGV overview of CUT&Tag signals of H3K4me3 in the promoter regions of ZBTB20. (D) CUT & Tag validation showed increased occupancy of ZBTB20 promoter in chondrocytes exposed to FSS. Data are shown as fold enrichments to the IgG control. (E) The protein level of ZBTB20 is significantly induced by FSS. (F) Inhibition of H3K4me3 by MM-102 could suppress the elevated mRNA level of Zbtb20 caused by FSS. (G) Pretreatment with MM-102 inhibited the upregulated protein level of ZBTB20 by FSS. *p < 0.05, **p < 0.01, ***p < 0.001.
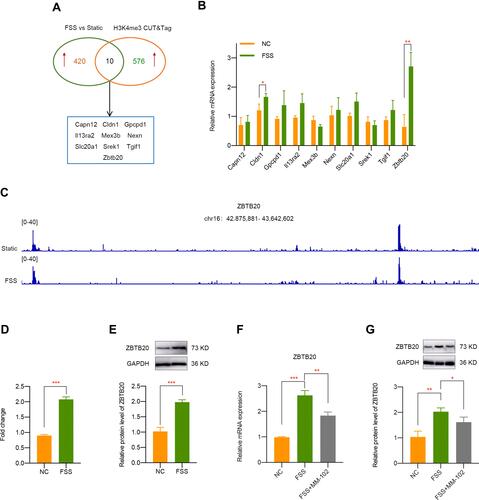
Figure 5 ZBTB20 remarkably affects the biological phenotypes, cartilage degeneration, and inflammatory responses in primary chondrocytes. (A) ZBTB20 was significantly elevated in primary chondrocytes with Ad-ZBTB20 infection at both mRNA and protein level. (B) Overexpression of ZBTB20 in chondrocytes greatly induces apoptosis activities. (C) qPCR results of markers representing cartilage degeneration, catabolic and inflammatory responses in chondrocytes with ZBTB20 overexpression. (D) The protein expression of COLII, SOX9, COX-2, and MMP13 in chondrocytes was mediated by ZBTB20. *p < 0.05, **p < 0.01, ***p < 0.001.
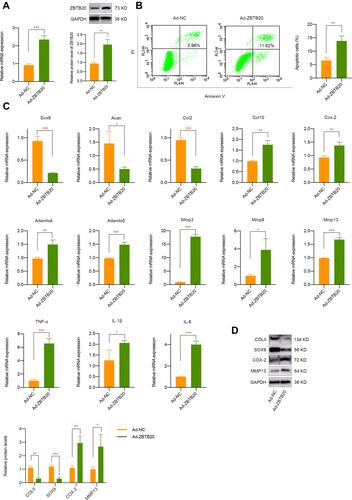
Figure 6 Wnt signaling pathway is closely involved in ZBTB20 or FSS-mediated cartilage pathogenesis. (A) Overexpression of ZBTB20 in primary chondrocytes results in Wnt signaling activation. (B) Treatment with LF3 decreased cell apoptosis induced by ZBTB20. (C) qPCR results indicated the inhibition of Wnt signaling by LF3 partially rescues the negative effect of ZBTB20 on chondrocytes. (D) Western blot results of COLII, SOX9, COX-2, and MMP13 in Ad-NC or Ad-ZBTB20 infected chondrocytes with or without LF3 treatment. (E) FSS results in Wnt signaling activation. (F) Pretreatment of LF3 in chondrocytes could alleviate SNP-induced apoptosis activities. (G) qPCR results indicated the inhibition of Wnt signaling by LF3 partially rescues the negative effect of FSS on chondrocytes. (H) Western blot results of COLII, SOX9, COX-2, and MMP13 in chondrocytes exposed to FSS with or without LF3 treatment. *p < 0.05, **p < 0.01, ***p < 0.001.
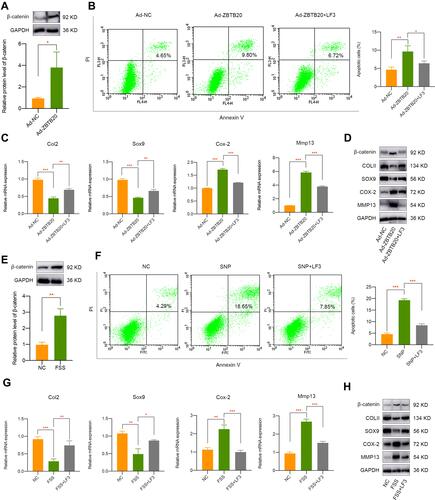
Figure 7 In vivo UAC mice model validation. (A) Micro-CT analysis of TMJ tissues from UAC group or sham controls. (B) mRNA level of Col2, Sox9, Cox-2, and Mmp13 in TMJ samples in different groups was determined by qPCR. (C) H&E and Safranin O fast green staining of TMJ tissues from healthy control and UAC mice. (D) Immunohistochemistry assay of TMJ tissues from healthy control and UAC mice. Scar bar, 50 μm. *p < 0.05, **p < 0.01, ***p < 0.001.
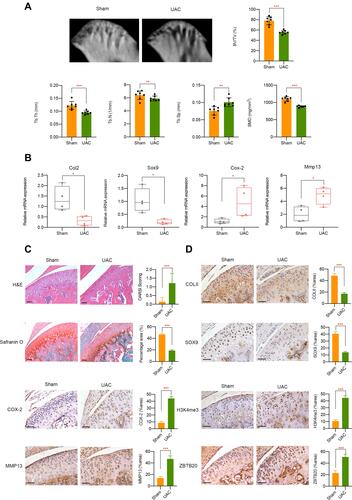
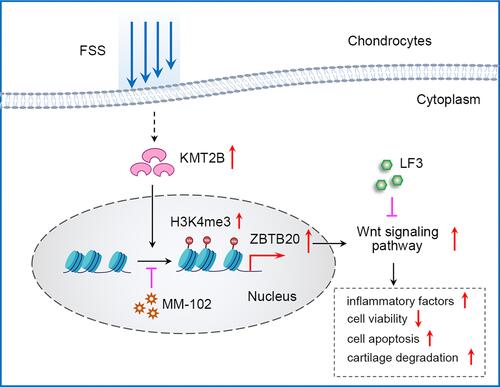
Figure 8 The overall working model of epigenetics-based mechanism underlying aberrant FSS-induced OA.