Figures & data
Figure 1 Gram staining microscopic examination. (A) Lactobacillus fermentum ZS09; (B) Lactobacillus bulgaricus.
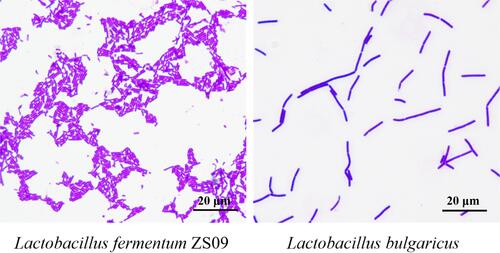
Figure 2 (A) Colon tissue morphology. The arrow shows the location of the colon mass. (B) Mouse survival curve.
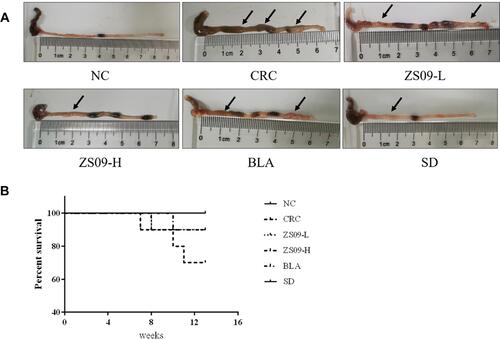
Figure 3 Mouse serum indicators.
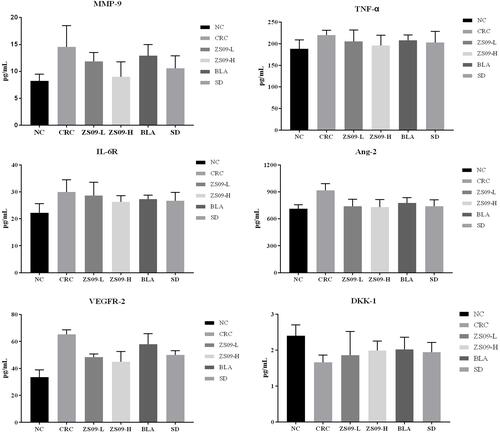
Figure 4 (A) Pathological section of mouse colon (H&E). Magnification 100×. (B) Colon severity pathological scores. 0 marks: intact villi and epithelium; 1 marks: slight submucosal or lamina propria swelling and separation; 2 marks: moderate submucosa or lamina propria swelling and separation and plasma cell infiltration; 3 marks: severe submucosal or lamina propria swelling and plasma cell infiltration, local villi atrophy and shedding; 4 marks: intestinal villi disappeared with intestinal wall necrosis. Pathology score ≥ 2, regarded as intestinal injury.
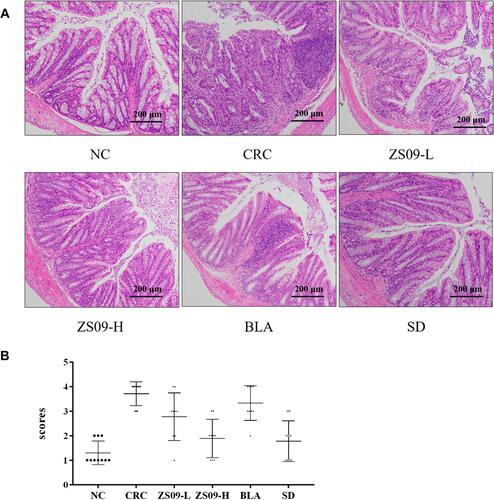
Figure 5 (A) Pathological section of mouse colon (CD34 immunohistochemical staining). Magnification 200×. (B) Quantitative immunohistochemical density. AOD (Average Optical Density) = IOD/ Area.
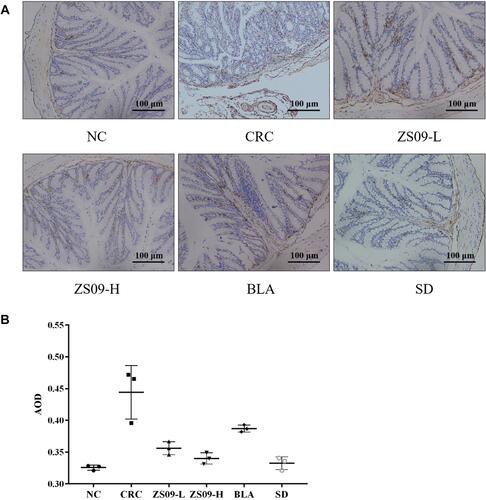
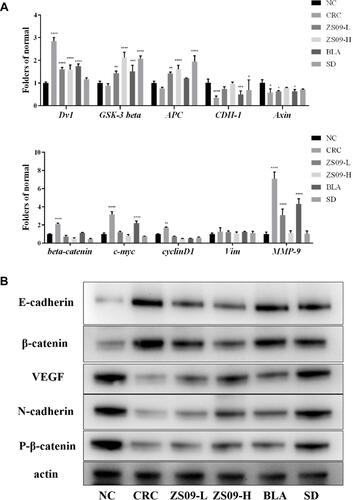
Figure 6 (A) mRNA expression levels of inflammatory factors in colon tissue. *Represents a significant difference from the NC group. *p <0.05, **<0.01, ***<0.001, ****<0.0001 (B) Expression of key proteins in signaling pathway in colon tissue.