
Figures & data
Table 1 ANOVA for the Acceptance Rate of Allocation of Money in Experiment 1 (N = 60)
Figure 1 The mean acceptance rate from ANOVAs used to test the differences in fairness of allocation of money for the moral behavior of virtual proposer in Experiment 1. The acceptance rate of proposals from positive moral proposer was higher than those from negative moral proposer in fair moderately unfair and extremely unfair allocation of money. Error bars represent 95% confidence intervals.
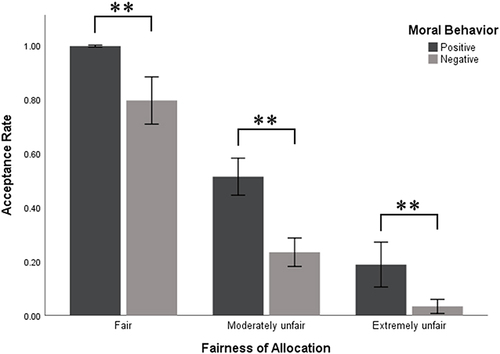
Figure 2 Example of single negative moral priming in Experiment 2. The negative behavior presented the screen, participants were asked to read and immerse themselves in the scenarios and then press the “F” key to commit negative moral behavior.

Figure 3 The experimental procedure of Experiment 2 is displayed on the left. Examples of moral information regarding proposer are displayed on the right. In this example, the proposer put the fair allocation of money.
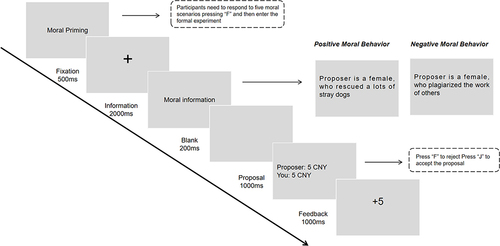
Figure 4 The mean acceptance rate from ANOVAs used to test the differences in fairness of allocation of money for the moral behavior of virtual proposer in Experiment 2. The acceptance rate of proposals from positive moral proposer was higher than those from negative moral proposer in fair moderately unfair and extremely unfair allocation of money. Error bars represent 95% confidence intervals.
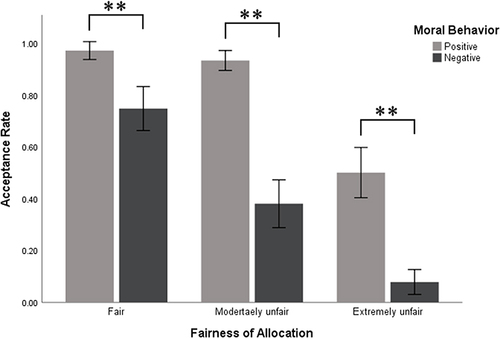
Figure 5 The three-way interaction between the moral priming, the fairness of the allocation of money and the moral behavior. (A) The condition of the moral behavior in this diagram was negative. (B) The condition of the moral behavior in this diagram was positive.
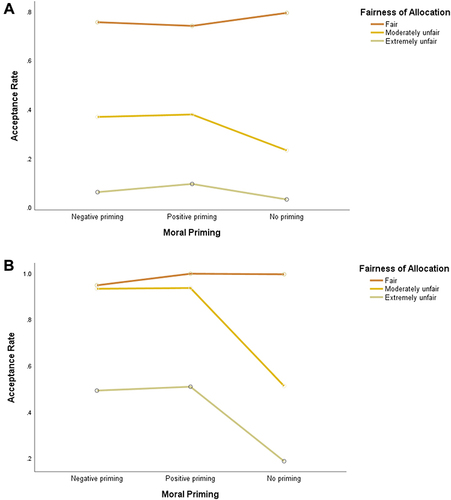
Table 2 The Mean Acceptance Rate in Experiment 1 and Experiment 2 Joint Analysis (N = 120)