Figures & data
Figure 1 The conceptual mediated moderation model.
Notes: The solid line (a1, b1) represents the direct influence of the independent variable on the dependent variable, while c1 represents the mediating effect of Awe. The dashed lines (z1, z2, z3) represent the moderating effects of Empathy on the first half path, mediation path, and second half path of the mediation model, respectively.
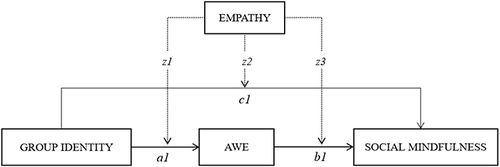
Table 1 Demographic Characteristics of Participants
Table 2 Normality Test and Pearson Correlation Analyses
Table 3 Linear Regression Models
Figure 2 Results of the model.
Notes: The solid line (a1, b1) represents the direct influence of the independent variable on the dependent variable, while c1 represents the mediating effect of Awe. The dashed lines (z1, z2, z3) represent the moderating effects of Empathy on the first half path, mediation path, and second half path of the mediation model, respectively; Numeric values represent the coefficients of each path; *p < 0.05, **p < 0.01, ***p < 0.001.
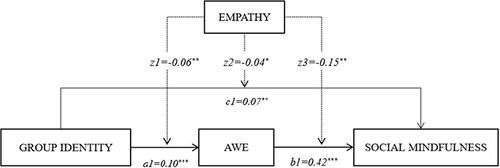
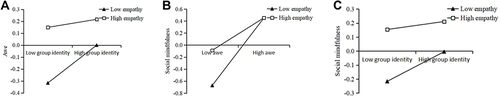
Figure 3 Interaction graphs.
Notes: (A) Interaction plot between group identity and empathy on awe. (B) Interaction plot between awe and empathy on social mindfulness. (C) Interaction plot between group identity and empathy on social mindfulness.