Figures & data
Figure 1. Melting thermal shift of bovine CA produced by acetazolamide (AZ), a known CA inhibitor (shown in fluorescence/T, °C (left) or derivative fluorescence/T, °C (right) coordinates).
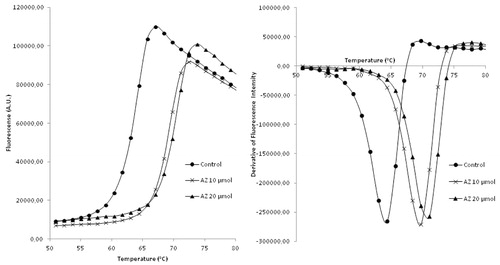
Figure 2. Structures of three Strecker-type α-aminonitriles (1–3) identified as CA Tm shifters in this study.
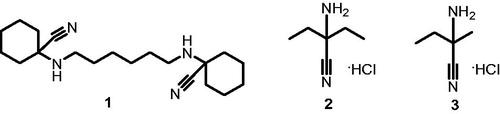
Figure 3. Melting thermal shift of bovine CA produced by compounds 1 (a), 2 (b), 3 (c) in comparison with that of acetazolamide.
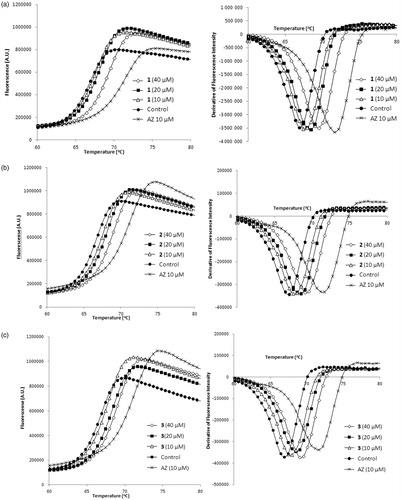
Table 1. Inhibition profile of compounds 1–3 against hCA I, II, IX and XII (h = human).
Figure 4. Melting thermal shifts of bovine CA produced by various concentrations of KCN in comparison with that produced by AZ.
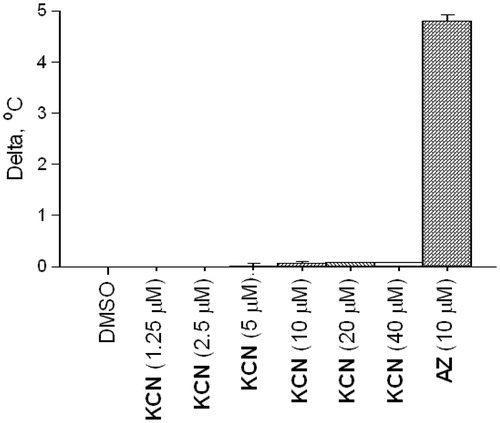
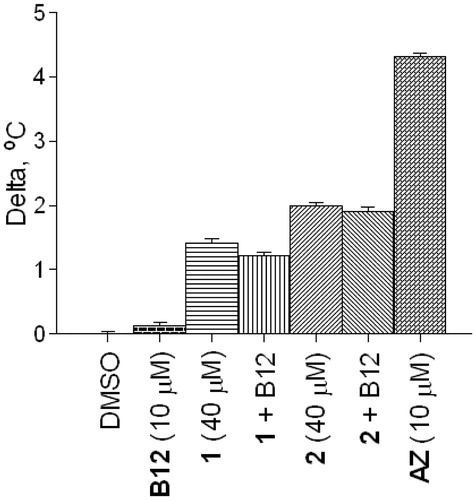
Figure 5. Melting thermal shifts of bovine CA produced by compounds 1 and 2 (40 μM) with or without addition of vitamin B12.
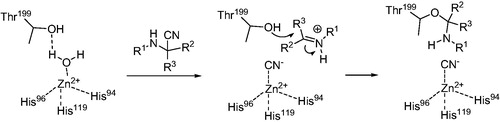
Scheme 1. Hypothetical mechanism of inhibitory action of Strecker-type α-aminonitriles toward CA.