
Figures & data
Figure 1. Antibody engineering strategy (A) and selection and screening cascade (B) used for the optimization of Hy38-1. Amino acid residues of Hy38-1 are shown in uppercase with the 4 residues C-terminal to the VH CDR1 region shown in italics. X denotes replacement of a codon with the degenerate codon NNS. The individual libraries within each CDR were pooled for selection as shown by the boxes. CDR residues are numbered according to Kabat et al.Citation22
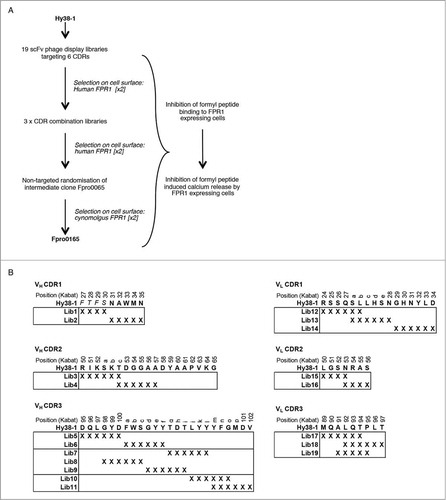
Table 1. Amino acid sequence and potency of affinity matured FPR1-specific antibodies. Antibodies shown correspond to those from the second round of selection that were improved compared to Hy38-1 in the fMLFK binding assay, those from the fourth round of selection that showed inhibition in the cynomolgus calcium release assay, and Fpro0165, the cross-reactivity optimized variant identified after 6 rounds of selection
Figure 2. Inhibition of fMLFK binding to human FPR1-expressing cells by crude scFv following 2 rounds of selection on human FPR1-expressing cells (A). The VH CDR3 randomized populations are absent since they were not progressed beyond the first round of selection due to a high abundance of stop codons. Each data point represents the single-point testing of an individual scFv for the ability to inhibit the binding of AlexaFluor-647-labeled fMLFK to FPR1-expressing cells. scFv are not purified or normalized for concentration. Data is expressed as a percentage of fMLFK binding in the absence of antibody and the mean percentage inhibition for each population is illustrated as a solid horizontal line. Complete inhibition of 400 pM fMLFF-induced calcium signaling in both human (B) and cynomolgus (C) FPR1-transfected HEK Ca2+ reporter cell assay by Fpro0165 purified scFv. Fpro165 was derived by random mutagenesis of Fpro0065 followed by phage display selection on cynomolgus FPR1 expressing cells, and was the only scFv identified with full activity in the cynomolgus FPR1 Ca2+ reporter cell assay. Fpro0025 scFv, which is inactive in the cynomolgus FPR1 calcium release assay but is of equivalent potency in the human FPR1 assay is shown for comparison.
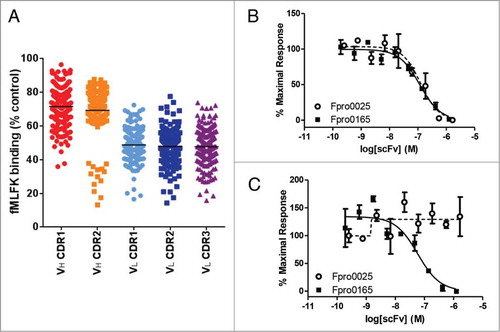
Figure 3. Determination of the apparent affinity of Fpro0165 for human FPR1 and cynomolgus FPR1 using Schild analysis of activity in a CD11b upregulation assay using in primary human and cynomolgus neutrophils. Concentration-response curves of fMLFF induced CD11b expression in primary human (A) and cynomolgus (B) neutrophils in the absence (0) or presence of different concentrations Fpro0165 IgG (indicated in the key as logM). Schild plot analysis of the data derived from human (C) and cynomolgus (D) assays to generate the apparent Kd of the antibody. Dose ratios were generated using 50% response levels of fMLFF in the presence of antibody and log (dose ratio-1) was plotted against log [antibody] (M). The x-intercept of the fitted regression line is an estimate of pA2, the apparent equilibrium dissociation constant for the antibody.
![Figure 3. Determination of the apparent affinity of Fpro0165 for human FPR1 and cynomolgus FPR1 using Schild analysis of activity in a CD11b upregulation assay using in primary human and cynomolgus neutrophils. Concentration-response curves of fMLFF induced CD11b expression in primary human (A) and cynomolgus (B) neutrophils in the absence (0) or presence of different concentrations Fpro0165 IgG (indicated in the key as logM). Schild plot analysis of the data derived from human (C) and cynomolgus (D) assays to generate the apparent Kd of the antibody. Dose ratios were generated using 50% response levels of fMLFF in the presence of antibody and log (dose ratio-1) was plotted against log [antibody] (M). The x-intercept of the fitted regression line is an estimate of pA2, the apparent equilibrium dissociation constant for the antibody.](/cms/asset/cc621d59-82df-4171-99fa-ebf94251cc23/kmab_a_985158_f0003_c.jpg)
Figure 4. Specificity of Fpro0165 for FPR1. FACS staining was carried out using Fpro0165 IgG1 and control IgG1 with parental, human FPR2-overexpressing and human CXCR3-overexpressing HEK cells to determine the binding specificity of Fpor0165 to FPR1 (A). See Results text for details. Lack of inhibition of WKYMVM-induced calcium release in FPR2-overexpressing cells by Fpro0165 (B, right panel). Different agonist activity of the FPR1-specific formyl peptides fMLFF (EC50 not quoted, incomplete curve) and fMIFL (EC50, 0.12 nM on FPR1 cells) and FPR2-specific peptide WKYMVM (EC50, 0.49 nM on FPR2 cells) are shown in the left and center panels confirming the overexpression of FPR1 and FPR2 respectively.
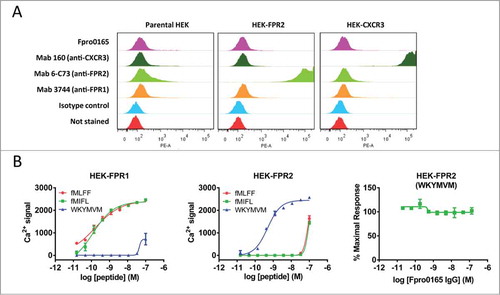
Table 2. Crystallography data collection and refinement statistics
Figure 5. Ribbon representation of the Fpro0165 Fv structure. Blue is heavy chain; pink is light chain.
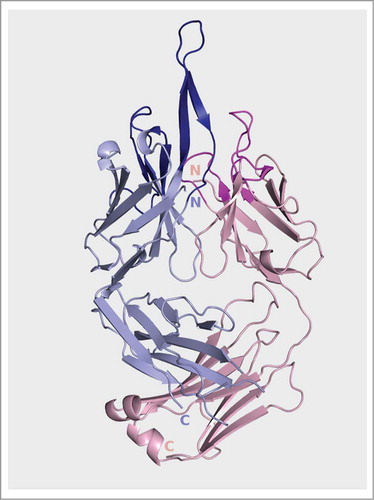
Figure 6. Structural model of the Fpro0165 Fv – FPR1 docked complex (A) and close up views of the optimized VL CDR amino acid residues (B) and the VH CDR3 Asn100c and Gly100d and surrounding region (C). For clarity in panels B and C, only the relevant residues are shown as sticks and labeled. Pale blue shows the heavy chain with CDR regions shown in darker blue; pink shows the light chain with CDR regions shown in magenta; green is FPR1; orange is the extracellular loop 2 region of FPR1; gray shaded area represents the cell membrane.
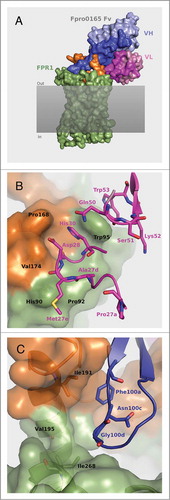
Table 3. Influence of Fpro0165 Asn100c and Gly100d mutations on potency