Figures & data
Figure 1. Metaanalysis of changes in CSI levels in adult humans with neoplastic diseases and the prognostic value of CSI values. The number of articles is indicated.
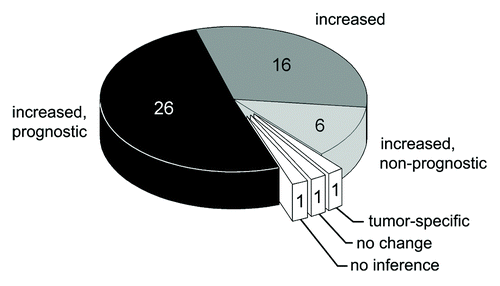
Figure 2. Growing tumors induce increased copper status indexes in mice. HCT(7d), HCT(24d), nude mice on the 7th and 24th day after the transplantation of HCT116 cells; B16, C57Bl/6J mice on the 21st day after the implantation of B16 melanoma cells; Min, 70-d-old Min mice. Sera from animals of the respective lineages without tumors were used as the controls. (A) Oxidase Cp content, % of respective control. (B) Relative Cp protein content as measured by immunoblotting, % of respective control. Cp protein content was not measured in Min mice. (C) Atomic copper concentration in sera, μg/g tissue. (D) Quartile plots (n = 5–7) of HCT116 tumor growth curve in nude mice, g.
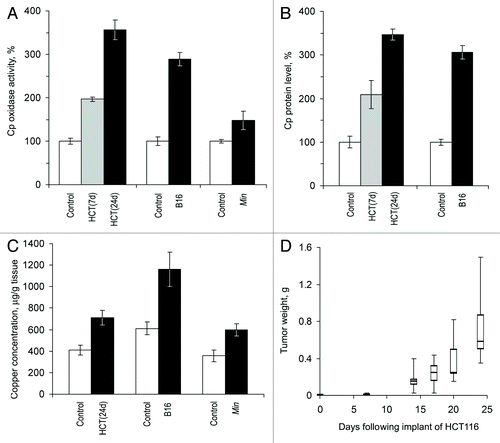
Figure 3. HCT116 cells produce human Cp in vitro and in tumor xenografts. (A) WB with antibodies to human Cp. Lane M, molecular weight marker (prestained proteins, Fermentas, code SM0671). Lane 1, culture medium in which HCT116 cells were grown; lane 2, human serum (positive control); lane 3, bovine serum (negative control). The two WB panes are sections of a single blot. (B) Oxidase activity in human (H), rat (R), and murine (M) sera, o-dianisidine stain of a non-denaturing 8% PAGE, 1 μl of serum per lane; WB of the same samples with antibodies to human (C) and rat (D) Cp, 0.5 μl of serum per lane. Immune complexes were detected using a goat anti-rabbit IgG-conjugated peroxidase/α-naphthol assay. (E) Human Cp content as measured by dot-spot hybridization with [125I]-mAB-hCp. One, human serum; 2, serum of HCT116-bearing nude mice (n = 6).
![Figure 3. HCT116 cells produce human Cp in vitro and in tumor xenografts. (A) WB with antibodies to human Cp. Lane M, molecular weight marker (prestained proteins, Fermentas, code SM0671). Lane 1, culture medium in which HCT116 cells were grown; lane 2, human serum (positive control); lane 3, bovine serum (negative control). The two WB panes are sections of a single blot. (B) Oxidase activity in human (H), rat (R), and murine (M) sera, o-dianisidine stain of a non-denaturing 8% PAGE, 1 μl of serum per lane; WB of the same samples with antibodies to human (C) and rat (D) Cp, 0.5 μl of serum per lane. Immune complexes were detected using a goat anti-rabbit IgG-conjugated peroxidase/α-naphthol assay. (E) Human Cp content as measured by dot-spot hybridization with [125I]-mAB-hCp. One, human serum; 2, serum of HCT116-bearing nude mice (n = 6).](/cms/asset/77a6f5a4-ca49-439b-b661-47b2b1cb1aed/kcbt_a_10924594_f0003.gif)
Figure 4. Altered copper transporter gene expression profile in the liver of 70-day-old Min mice. (A) RT-PCR results: negative image of 1% agarose gels stained with EtBr. Lanes 1–4, Min mice; lanes 5–7, C57Bl/6J mice. (B) Semi-quantitative analysis of the gels. White bars, C57Bl/6J mice; black bars, Min mice. Changes are significant at P < 0.0005.
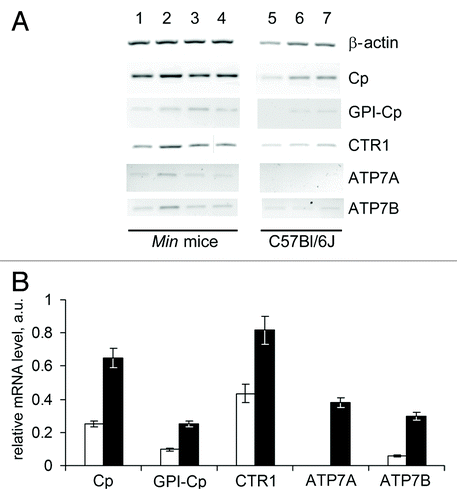
Figure 5. Relative CTR1 mRNA level in the small intestines of Min mice. I and white bar, control; II and gray bar, tissues surrounding the adenoma; III and black bar, adenomas of Min mice. *P < 0.05. **P < 0.0001.
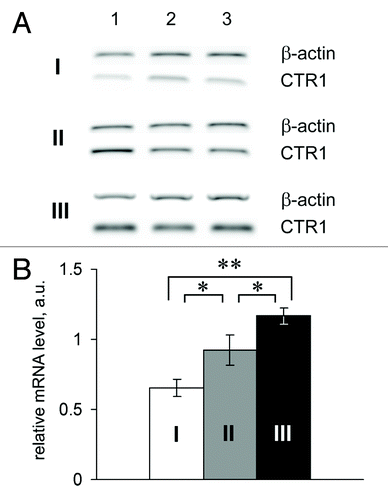
Figure 6. Effects of Ag diet on the development of tumor xenografts. (А) Left, dynamics of human colon tumor growth in control (◊), Ag(+) (■), and Ag(P) (●) mice. Ordinate, weight of tumors, g; abscissa, days. Average weights for five mice in the control group, 6 Ag(+) mice and 6 Ag(P) mice are shown; right, weights of the 24-d-old tumors in the individual mice. (B) Serum oxidase activity (upper) and Cp protein (lower) detected in the same mice. (C) Serum oxidase activity (upper) and Cp protein (lower) detected in B16 melanoma-bearing mice. For oxidase activity measurements, serum aliquots (1.0 µl) were resolved by 8% native PAGE, and the gel was stained with o-dianisidine; the bands are dark orange. For Cp protein measurements, serum aliquots (0.5 µl) were fractioned by 8% native PAGE followed by immunoblotting with antibodies to human Cp. (D) Copper and silver content in the livers and tumors of the mice bearing implanted tumors. *P < 0.05, **P < 0.005, ***P < 0.0001.
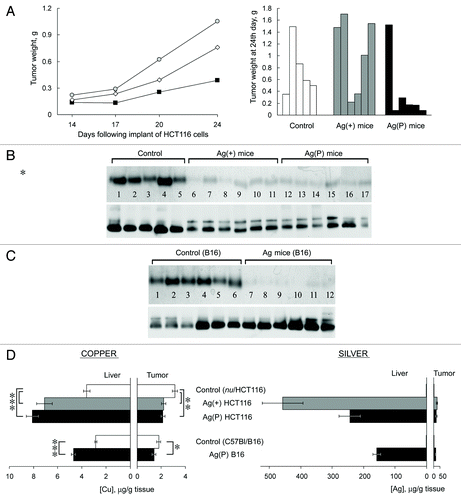
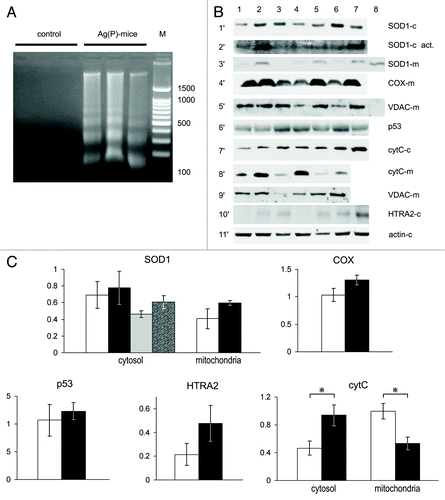
Figure 7. Apoptotic markers and cuproenzyme expression in tumors from Ag(P) mice. (A) DNA in the cytosol fraction of 24-d-old tumors, 2% agarose gel stained with EtBr. Lanes 1–3, control mice; lanes 4–6, Ag(P) mice; lane 7, 100–1500 bp DNA ladder. (B) Expression and intracellular distribution of cuproenzymes and selected apoptotic markers in HCT116 tumors. Vertical lanes: control (lanes 1–3) and Ag(P) mice (lanes 4–7). Horizontal sections: 1′, WB of cytosolic proteins blotted with antibodies to SOD1; 2′, SOD1 activity in the same samples; 3′, WB of mitochondrial proteins with antibodies to SOD1 (Lane 8, cytosolic protein from lane 2 diluted 10-fold); 4′, WB of mitochondrial proteins with antibodies to COX ; 5′, WB of the same samples with antibodies to VDAC (Lane 8, cytosol protein from lane 2); 6′, WB of cytosolic proteins with antibodies to p53; 7′, WB of cytosolic proteins with antibodies to cytochrome c; 8′, WB of mitochondrial proteins with antibodies to cytochrome c; 9′, WB of the same samples with antibodies to VDAC; 10′, WB of cytosolic proteins with antibodies to HTRA2; 11′, WB of cytosolic proteins with antibodies to β-actin. Gels were loaded with 20 μg of total cytosolic or mitochondrial protein per lane. For western blots, 12% denaturing PAGE was used, and 8% non-denaturing PAGE was used to assess SOD activity (2′). (C) Quantification of data, relative units: protein content as measured by WB, white, control mice; black, Ag(P) mice; gray and spotted bars, cytosolic SOD1 enzymatic activity in control and Ag(P) mice, respectively. Cytosolic protein levels are expressed relative to β-actin levels, and mitochondrial protein levels are expressed relative to VDAC levels. The relative cytochrome c content was determined from two independent experiments (the protocol is given for a single experiment). *P < 0.01.
