Figures & data
Figure 1. Both CD40 and IL-10 signals of DCreg were required for Tregs development in vitro. (A) For in vivo generated DCreg, DCreg were isolated from spleen of DNA plus antigen co-administrated mice and co-cultured with CFSE labeled syngeneic naive CD4+ T cells in the presence of mAb (50 μg/ml) to CD40 (a stimulator), CD80 (a blocker) and IL-10 (a blocker) or an isotype control. T cells isolated from DC-T co-cultures were analyzed for their abilities to inhibit MLR. After 48 h, T cell proliferation was analyzed by FACS and cells were gated on the CFSE positive population. Results are representative of three experiments. (B) For in vitro generated DCreg, co-treated DC were co-cultured with CFSE-CD4+ T cells purified from spleens of mice immunized with OVA in IFA and in the presence or absence of anti-CD40L (blocker) for 5 d. T cell proliferation and the productions of Foxp3 and IL-10 were detected by FACS. P values (Mann-Whitney test) are indicated.
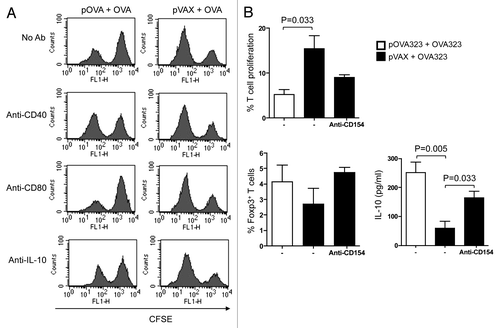
Figure 2. The distribution of DNA and protein in co-administrated DCs. (A) The co-localization of Cav-1 with DNA and protein. WT JAWS II cells (WT) or Cav-1 silenced JAWS II cells (Cav-1 siRNA) were co-treated with Cy5-pOVA323 + FITC-OVA323 or Cy5-pVAX + FITC-OVA323 for 24 h, then fixed and permeabilized with 0.1% Triton X-100 in PBS buffer. Cells were incubated with rabbit anti-Cav-1 for 1 h and subsequently reacted with the Alexa Fluor 546-labeled goat anti-rabbit IgG before the cells were observed using an inverted Nikon ECLIPSE IE2000-E confocal microscope. (B) The co-localization of DC-SIGN with DNA and protein. JAWS II cells were co-treated with Cy5-pOVA323 + FITC-OVA323 or Cy5-pVAX + FITC-OVA323 for 24 h, then fixed and permeabilized with 0.1% Triton X-100 in PBS buffer. Cells were stained with PE-DC-SIGN and observed using an inverted Nikon ECLIPSE IE2000-E confocal microscope. (C) The co-localization of DC-SIGN and Cav-1. JAWS II cells were fixed and permeabilized. Cells were inoculated with rabbit anti-Cav-1 for 1 h and subsequently reacted with the Alexa Fluor 546-labeld goat anti-rabbit IgG and APC-DC-SIGN before cells were observed using an inverted Nikon ECLIPSE IE2000-E confocal microscope.
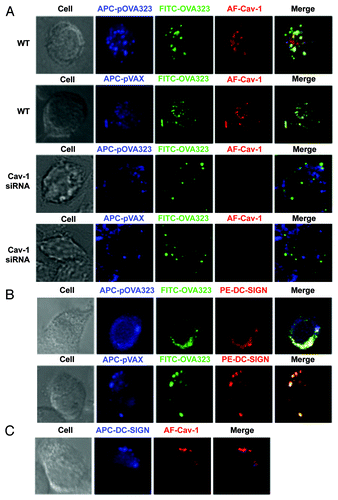
Figure 3. The co-localization of DNA and protein with EEA1 or LAMP2. JAWS II cells were co-treated with Cy5-pOVA323 + FITC-OVA323 or Cy5-pVAX + FITC-OVA323 for 5 h, then fixed and permeabilized with 0.1% Triton X-100 in PBS buffer. Cells were incubated with rabbit anti-EEA1 or rat anti-LAMP2 for 1 h and subsequently reacted with the Alexa Fluor 546-labeled goat anti-rabbit IgG or PE-labeled goat anti-rat IgG. Cells were observed using an inverted Nikon ECLIPSE IE2000-E confocal microscope.
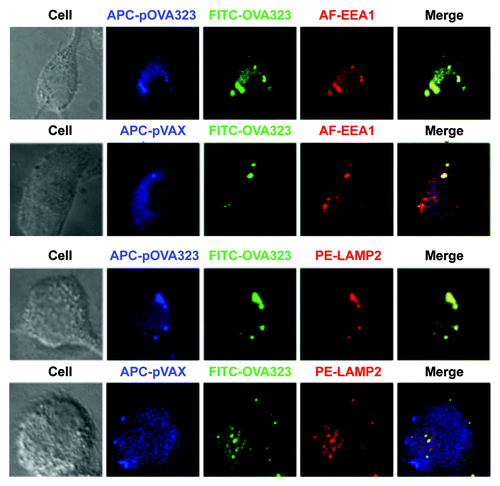
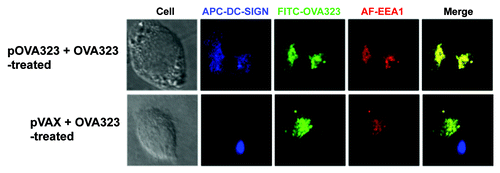
Figure 4. The co-localization of DC-SIGN and EEA1. JAWS II cells were co-treated with pOVA323 + FITC-OVA323 or pVAX + FITC-OVA323 for 5 h, then fixed and permeabilized with 0.1% Triton X-100 in PBS buffer. Cells were incubated with rabbit anti-EEA1 for 1 h and subsequently reacted with the Alexa Fluor 546-labeled goat anti-rabbit IgG and APC-DC-SIGN. Cells were observed using an inverted Nikon ECLIPSE IE2000-E confocal microscope.