Figures & data
Figure 1. Inhibition of tumor growth induced by pcDNA3-p42.3 vaccination in the B16F10 melanoma subcutaneous model. (A) C57BL/6 mice were immunized intramuscularly (i.m) with pcDNA3-p42.3 with or without electroporation (EP) four times at biweekly intervals, or with pcDNA3 or PBS as controls. Antibody levels in serum collected 7 d after final immunization were detected by ELISA. (B) Immunization schedule. C57BL/6 mice were immunized with 30 μl of pcDNA-p42.3 (1 mg/ml), pcDNA3 (1 mg/ml) or PBS four times every two weeks and were subcutaneously challenged with 1 × 10⁵ B16F10 cells on day 7 after the final immunization. Tumor size (C, D, and E) was measured every 2 d. At day 22 after challenge, solid tumors were isolated from mice and weighed using an analytical balance (F). Another group of mice was monitored for survival (G). In (C), (D), and (F), each value represents the mean ± SEM from seven or eight mice in each group. Every experiment was done at least three times, and one representative experiment is shown. *p ≤ 0.05, **p ≤ 0.01 compared with other groups by the Student t-test. In (G), results are expressed as the percentages of surviving mice in groups of seven or eight mice. *p ≤ 0.05 compared with other groups by the log-rank test.
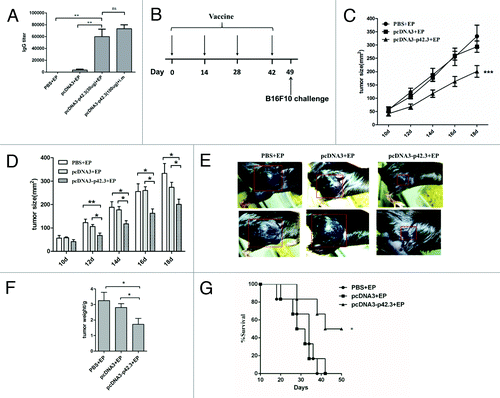
Figure 2. Inhibition of metastasis of B16F10 melanoma induced by pcDNA3-p42.3 vaccination. C57BL/6 mice immunized with pcDNA3-p42.3 vaccine, vector control pcDNA3 or PBS were challenged with B16F10 melanoma cells i.v.; 17 d after the challenge, mice were sacrificed and metastases in lung were photographed (A) and analyzed (B). Each value is the mean ± SEM from eight mice. Every experiment was done at least three times, and one representative experiment is shown. *p ≤ 0.05, **p ≤ 0.01 compared with other groups by the Student t-test.
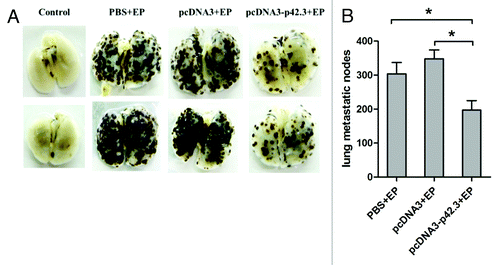
Figure 3. Therapeutic effects of pcDN3-p42.3 vaccination on B16F10 the subcutaneous melanoma model. (A) C57BL/6 mice were first subcutaneously injected with 1 × 10⁵ B16F10 cells, then after 2 d of incubation the mice were immunized three times at weekly intervals with 30 μl of pcDNA-p42.3 (1 mg/ml), or pcDNA3 (1 mg/ml) or PBS. Tumor size (B), (C) was measured every 2 d. At day 22, solid tumors were isolated from the mice and weighed (D). Another group of mice was monitored for survival (E). In (B), (C), and (D), each value represents the mean ± SEM from seven or eight mice in each group. Every experiment was done at least three times, and one representative experiment is shown. *p ≤ 0.05, **p ≤ 0.01 compared with other groups by the Student t-test. In (E), results are expressed as the percentages of surviving mice in groups of seven or eight mice. *p ≤ 0.05 compared with other groups by the log-rank test.
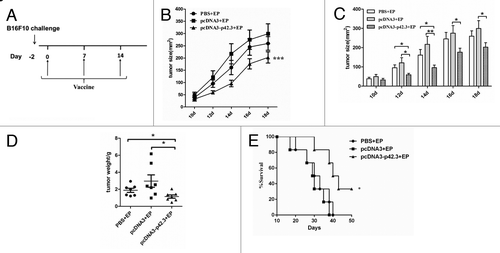
Figure 4. A critical role of antigen specific CD8+ T cells in the antitumor responses. (A) C57BL/6 WT mice and CD8-KO mice were first subcutaneously incubated with 1 × 10⁵ B16F10 cells, then after 2 d of incubation mice were immunized three times at weekly intervals with 30 μl of pcDNA-p42.3 (1 mg/ml) or PBS. Tumor size was measured every 3 d. Each value represents the mean ± SEM *** p ≤ 0.0001 compared with control group by two-way ANOVA test. (B) Analysis of in vivo cytotoxic lysis on day 7 after the final immunization. In vivo CTL assays were as described in Materials and Methods. (C) The percentage of specific lysis summarized as the mean ± SEM of three independent experiments. Data shown are representative from three independent experiments. *p ≤ 0.05, **p ≤ 0.01, ***p ≤ 0.0001 compared with other groups by the Student t-test.
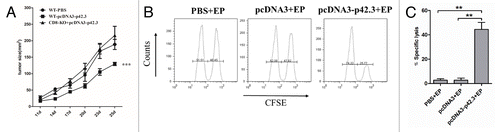
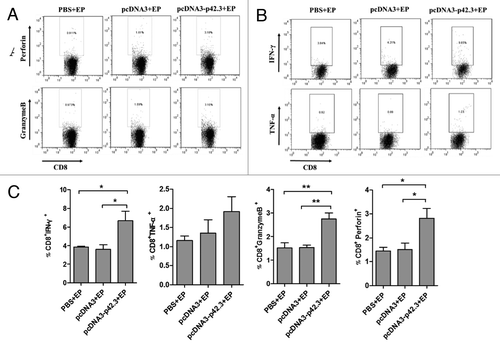
Figure 5. Functional analyses of p42.3-specific CD8+ T cells induced by vaccination with pcDNA3-p42.3. Spleen cells were isolated 7 d after the last vaccination and analyzed for function of CD8+ T cells. Percentages of CD8 T cells positive for perforin or granzyme B (A) and for IFN-γ or TNF-α (B) were analyzed by FACS. (C) The percentages of positive-stained cells are summarized as the means ± SEM from three independent experiments. Every experiment was done at least three times, and one representative experiment is shown. *p ≤ 0.05, **p ≤ 0.01 compared with other groups by the Student t-test.