1,235
Views
24
CrossRef citations to date
0
Altmetric
Original Research

CD137L-stimulated dendritic cells are more potent than conventional dendritic cells at eliciting cytotoxic T-cell responses

, , , &
Article: e26859 | Received 27 Jul 2013, Accepted 17 Oct 2013, Published online: 11 Nov 2013

Figures & data

Figure 1. Dendritic cells derived in the presence of CD137L signaling enhance the cytolytic activity of CD8+ T cells. (A and B) Monocytes that had been pretreated with the differentiation (or control) stimulus indicated were co-cultured with CD8+ T cells. After 5 d T cells were harvested and co-cultured with carboxyfluorescein succinimidyl ester (CFSE)-labeled K562 target cells at effector to target (E:T) cell ratios of 1:1, 10:1, and 20:1. After overnight co-culture, cells were harvested and the percentage of apoptosis was determined by staining with AnnexinV and 7-aminoactinomycin D (7-AAD). Panel A reports a representative dot plot of apoptotic CFSE-cells at 10:1 E:T ratio. In panel B, the percentages of apoptotic cells at different E:T ratios are indicated. GM-CSF, granulocyte macrophage colony-stimulating factor; IFNγ, interferon γ; IL-4, interleukin-4; LPS, lipopolysaccharide.
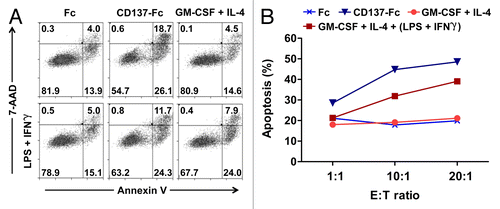
Figure 1. Dendritic cells derived in the presence of CD137L signaling enhance the cytolytic activity of CD8+ T cells. (A and B) Monocytes that had been pretreated with the differentiation (or control) stimulus indicated were co-cultured with CD8+ T cells. After 5 d T cells were harvested and co-cultured with carboxyfluorescein succinimidyl ester (CFSE)-labeled K562 target cells at effector to target (E:T) cell ratios of 1:1, 10:1, and 20:1. After overnight co-culture, cells were harvested and the percentage of apoptosis was determined by staining with AnnexinV and 7-aminoactinomycin D (7-AAD). Panel A reports a representative dot plot of apoptotic CFSE-cells at 10:1 E:T ratio. In panel B, the percentages of apoptotic cells at different E:T ratios are indicated. GM-CSF, granulocyte macrophage colony-stimulating factor; IFNγ, interferon γ; IL-4, interleukin-4; LPS, lipopolysaccharide.

Table 1. Cytokine combinations employed for the maturation of CD137L-stimulated DCs

Figure 2. Maturation of CD137L-derived dendritic cells. (A–C) Monocytes were treated with immobilized CD137-Fc for 6 d and then exposed to the indicated maturation cocktails (see also ) for 18 h, followed by a phenotypic and functional characterization. (A) Cells were immunostained for the CD83, CD86, and HLA-DR cell-surface expression and analyzed by fluorescence cytometry. Unshaded and gray histograms represent the unstained (control) and stained samples, respectively. Values associated with each histogram indicate the percentages of positive cells and mean fluorescence intensity (MFI). Bar charts on the right report the mean percentage of positive cells and mean MFI ± SD of data acquired from 2 different donors. (B) Upon 18 h of treatment with cocktails C0, C1, C3, or C4, CD137L-derived dendritic cells (CD137L-DCs) were co-cultured for additional 5 d with carboxyfluorescein succinimidyl ester (CFSE)-stained allogeneic T cells at a ratio of 1:10. T-cell proliferation was then quantified by fluorescence cytometry based on CFSE dilution. Numbers in the histograms and bar charts represent percentages of proliferating cells and CFSE MFI. (C) Supernatants from the co-cultures of mature CD137L-DCs and allogeneic T cells were harvested and the levels of interferon γ (IFNγ) were quantified by ELISA. Means ± SD of triplicate measurements are depicted. **P < 0.01 (two-tailed, unpaired Student t test). This experiment has been performed independently twice, yielding with comparable results. PHA, phytohemagglutinin; Rst, resting.
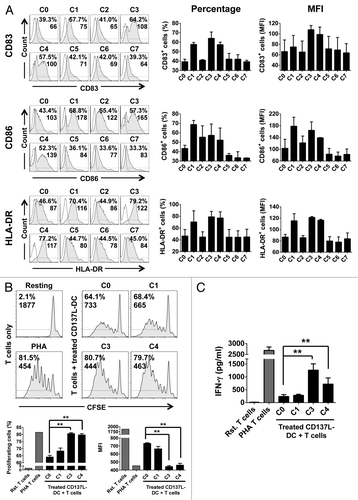
Figure 2. Maturation of CD137L-derived dendritic cells. (A–C) Monocytes were treated with immobilized CD137-Fc for 6 d and then exposed to the indicated maturation cocktails (see also Table 1) for 18 h, followed by a phenotypic and functional characterization. (A) Cells were immunostained for the CD83, CD86, and HLA-DR cell-surface expression and analyzed by fluorescence cytometry. Unshaded and gray histograms represent the unstained (control) and stained samples, respectively. Values associated with each histogram indicate the percentages of positive cells and mean fluorescence intensity (MFI). Bar charts on the right report the mean percentage of positive cells and mean MFI ± SD of data acquired from 2 different donors. (B) Upon 18 h of treatment with cocktails C0, C1, C3, or C4, CD137L-derived dendritic cells (CD137L-DCs) were co-cultured for additional 5 d with carboxyfluorescein succinimidyl ester (CFSE)-stained allogeneic T cells at a ratio of 1:10. T-cell proliferation was then quantified by fluorescence cytometry based on CFSE dilution. Numbers in the histograms and bar charts represent percentages of proliferating cells and CFSE MFI. (C) Supernatants from the co-cultures of mature CD137L-DCs and allogeneic T cells were harvested and the levels of interferon γ (IFNγ) were quantified by ELISA. Means ± SD of triplicate measurements are depicted. **P < 0.01 (two-tailed, unpaired Student t test). This experiment has been performed independently twice, yielding with comparable results. PHA, phytohemagglutinin; Rst, resting.
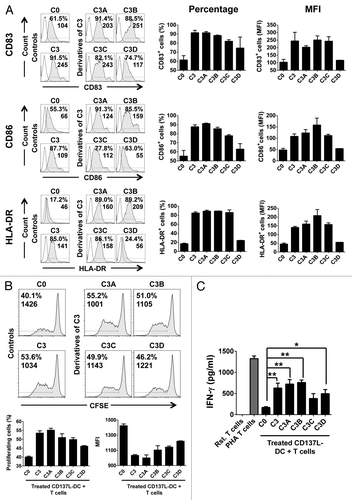
Table 2. Definition of essential factors for the maturation of CD137L-stimulated DCs

Figure 3. Interferon γ and R848 are sufficient to induce the functional maturation of CD137L-derived dendritic cells. (A–C) Monocytes were treated with immobilized CD137-Fc for 6 d followed by exposure to the indicated maturation cocktails (see also ) for 18 h to obtain mature CD137L-derived dendritic cells (CD137L-DCs), which were then subjected to phenotypic and functional characterization (A) Cells were immunostained for CD83, CD86, and HLA-DR expression and analyzed by fluorescence cytometry. Unshaded and gray histograms represent the unstained (control) and stained samples, respectively. Values associated with each histogram indicate the percentages of positive cells and mean fluorescence intensity (MFI). Bar charts on the right report the mean percentage of positive cells and mean MFI ± SD of data acquired from 2 different donors. (B) Upon 18 h of treatment with cocktails C3, C3A, C3B, C3C, and C3D the CD137L-DCs were co-cultured for additional 5 d with carboxyfluorescein succinimidyl ester (CFSE)-stained allogeneic T cells at a ratio of 1:10. T-cell proliferation was then quantified by fluorescence cytometry based on CFSE dilution. Numbers in the histograms and bar charts represent percentages of proliferating cells and CFSE MFI. (C) Supernatants from the co-cultures of mature CD137L-DCs and allogeneic T cells were harvested and the levels of interferon γ (IFNγ) were quantified by ELISA. Means ± SD of triplicate measurements are depicted. *P < 0.05, **P < 0.01 (two-tailed, unpaired Student t test). This experiment has been performed independently twice, yielding with comparable results. PHA, phytohemagglutinin; Rst, resting.

Figure 3. Interferon γ and R848 are sufficient to induce the functional maturation of CD137L-derived dendritic cells. (A–C) Monocytes were treated with immobilized CD137-Fc for 6 d followed by exposure to the indicated maturation cocktails (see also Table 2) for 18 h to obtain mature CD137L-derived dendritic cells (CD137L-DCs), which were then subjected to phenotypic and functional characterization (A) Cells were immunostained for CD83, CD86, and HLA-DR expression and analyzed by fluorescence cytometry. Unshaded and gray histograms represent the unstained (control) and stained samples, respectively. Values associated with each histogram indicate the percentages of positive cells and mean fluorescence intensity (MFI). Bar charts on the right report the mean percentage of positive cells and mean MFI ± SD of data acquired from 2 different donors. (B) Upon 18 h of treatment with cocktails C3, C3A, C3B, C3C, and C3D the CD137L-DCs were co-cultured for additional 5 d with carboxyfluorescein succinimidyl ester (CFSE)-stained allogeneic T cells at a ratio of 1:10. T-cell proliferation was then quantified by fluorescence cytometry based on CFSE dilution. Numbers in the histograms and bar charts represent percentages of proliferating cells and CFSE MFI. (C) Supernatants from the co-cultures of mature CD137L-DCs and allogeneic T cells were harvested and the levels of interferon γ (IFNγ) were quantified by ELISA. Means ± SD of triplicate measurements are depicted. *P < 0.05, **P < 0.01 (two-tailed, unpaired Student t test). This experiment has been performed independently twice, yielding with comparable results. PHA, phytohemagglutinin; Rst, resting.

Figure 4. Generation and maturation of classical and CD137L-derived dendritic cells. (A–C) Monocytes were treated with immobilized CD137-Fc for 7 d to generate CD137L-derived dendritic cells (CD137L-DCs), or with 80 ng/mL granulocyte macrophage colony-stimulating factor (GM-CSF) plus 100 ng/mL interleukin (IL)-4 to generate classical dendritic cells (cDCs). For the last 18 h of culture, tumor necrosis factor α (TNFα) plus IL-1β plus IL-6 plus prostaglandin E2 (PGE2) were used to promote the maturations of cDCs, while 50 ng/mL interferon γ (IFNγ) plus 1 µg/mL R848 were used for the maturation of CD137L-DCs. (A) Brightfield microscopy images were taken on day 7 at a magnification of 63 × . Scale bar = 20 µm. (B) DC subsets were harvested and the expression of CD14, CD83, CD86, and HLA-DR was determined by flow cytometry upon staining with specific antibodies. These data are representative of at least 3 independent experiments yielding comparable results. (C) Viable DC numbers in each group were quantified by trypan blue exclusion assays. Bar charts represent cell count per million cells. Means ± SD of triplicate counts are depicted. These data are representative of 2–3 independent experiments yielding comparable results.
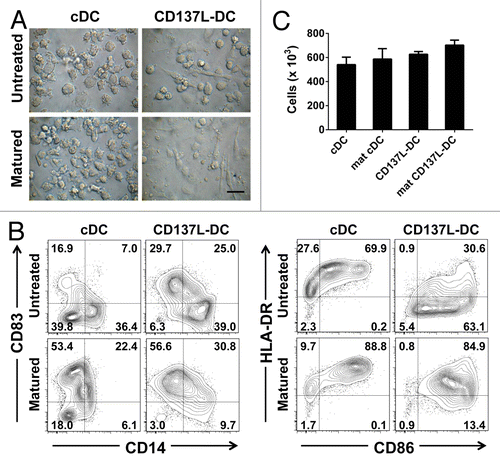
Figure 4. Generation and maturation of classical and CD137L-derived dendritic cells. (A–C) Monocytes were treated with immobilized CD137-Fc for 7 d to generate CD137L-derived dendritic cells (CD137L-DCs), or with 80 ng/mL granulocyte macrophage colony-stimulating factor (GM-CSF) plus 100 ng/mL interleukin (IL)-4 to generate classical dendritic cells (cDCs). For the last 18 h of culture, tumor necrosis factor α (TNFα) plus IL-1β plus IL-6 plus prostaglandin E2 (PGE2) were used to promote the maturations of cDCs, while 50 ng/mL interferon γ (IFNγ) plus 1 µg/mL R848 were used for the maturation of CD137L-DCs. (A) Brightfield microscopy images were taken on day 7 at a magnification of 63 × . Scale bar = 20 µm. (B) DC subsets were harvested and the expression of CD14, CD83, CD86, and HLA-DR was determined by flow cytometry upon staining with specific antibodies. These data are representative of at least 3 independent experiments yielding comparable results. (C) Viable DC numbers in each group were quantified by trypan blue exclusion assays. Bar charts represent cell count per million cells. Means ± SD of triplicate counts are depicted. These data are representative of 2–3 independent experiments yielding comparable results.

Figure 5. Mature CD137L-derived DCs potently stimulate autologous CD8+ and CD4+ T cells. (A and B) Dendritic cells (DCs) were pulsed with a pool of pp65-derived peptides or left unpulsed (control conditions). On day 9/10, pp65-specific T cells were co-cultured with peptide-pulsed or unpulsed DCs at a ratio of 10:1 in the presence of 2 µg/mL brefeldin A for 18 h. T cells were then immunostained for cell surface expression of CD8 or CD4 as well as for the intracellular expression of interferon γ (IFNγ) prior to cytofluorometric analysis. (A) Representative histograms from a single experiment. Unshaded and gray histograms represent the unstained (control) and stained samples, respectively. The number associated with each histogram reports the percentage of IFNγ+ cells. (B) Scatter plot depicting collated data of pp65-specific, IFNγ-secreting CD8+ or CD4+ T cells from 4 independent experiments. Means ± SD are depicted. *P < 0.05, **P < 0.01 (ANOVA).
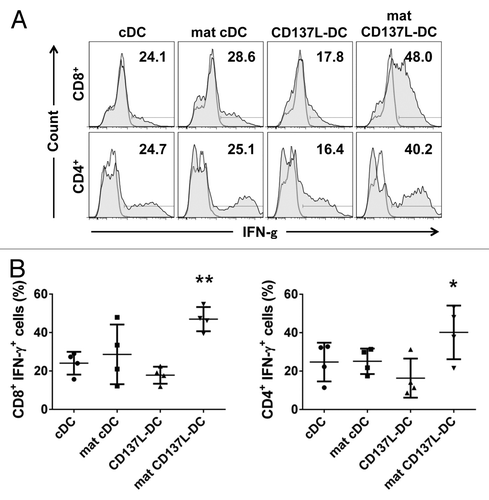
Figure 5. Mature CD137L-derived DCs potently stimulate autologous CD8+ and CD4+ T cells. (A and B) Dendritic cells (DCs) were pulsed with a pool of pp65-derived peptides or left unpulsed (control conditions). On day 9/10, pp65-specific T cells were co-cultured with peptide-pulsed or unpulsed DCs at a ratio of 10:1 in the presence of 2 µg/mL brefeldin A for 18 h. T cells were then immunostained for cell surface expression of CD8 or CD4 as well as for the intracellular expression of interferon γ (IFNγ) prior to cytofluorometric analysis. (A) Representative histograms from a single experiment. Unshaded and gray histograms represent the unstained (control) and stained samples, respectively. The number associated with each histogram reports the percentage of IFNγ+ cells. (B) Scatter plot depicting collated data of pp65-specific, IFNγ-secreting CD8+ or CD4+ T cells from 4 independent experiments. Means ± SD are depicted. *P < 0.05, **P < 0.01 (ANOVA).

Figure 6. T cells stimulated by CD137L-derived dendritic cells stimulate the release of high levels of TH1 and TH2 cytokines. (A and B) Dendritic cells (DCs) were pulsed with a pool of pp65-derived peptides or left unpulsed (control conditions). pp65-specific T cells were subsequently co-cultured with peptide-pulsed or unpulsed DCs at a ratio of 10:1. Interleukin (IL)-2, IL-7, and IL-15 were added on day 3 of re-stimulation. The levels of interferon (IFNγ) (A) and IL-13 (B) in culture supernatants were determined by ELISA 5 d later. Means ± SD of triplicate measurements are depicted. **P < 0.01 (two-tailed, unpaired Student t test). These data are representative of at least 2 independent experiments yielding comparable results.
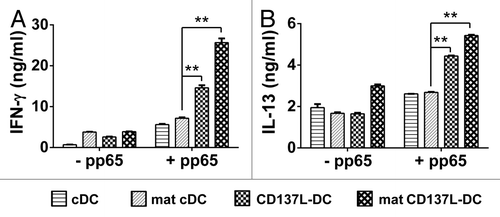
Figure 6. T cells stimulated by CD137L-derived dendritic cells stimulate the release of high levels of TH1 and TH2 cytokines. (A and B) Dendritic cells (DCs) were pulsed with a pool of pp65-derived peptides or left unpulsed (control conditions). pp65-specific T cells were subsequently co-cultured with peptide-pulsed or unpulsed DCs at a ratio of 10:1. Interleukin (IL)-2, IL-7, and IL-15 were added on day 3 of re-stimulation. The levels of interferon (IFNγ) (A) and IL-13 (B) in culture supernatants were determined by ELISA 5 d later. Means ± SD of triplicate measurements are depicted. **P < 0.01 (two-tailed, unpaired Student t test). These data are representative of at least 2 independent experiments yielding comparable results.
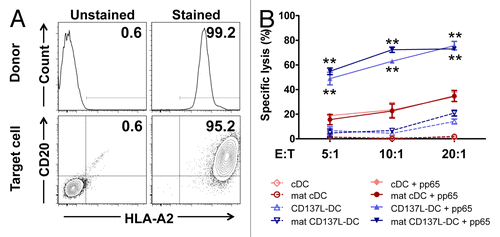
Figure 7. pp65-specific T cells re-stimulated by CD137L-derived dendritic cells are more cytotoxic than T cells re-stimulated by classical dendritic cells. (A) The lymphoblastic cell line CM371 and monocytes isolated from a HLA-A2+ donor were immunostained for HLA-A2 and CD20 expression or HLA-A2 expression, respectively, and analyzed by fluorescence cytometry. (B) CM371 cells were loaded with the DELFIA® BATDA reagent, pulsed or not with pp65-derived peptides and used as target cells. T cells re-stimulated by exposure to the indicated type of dendritic cells (DC) for 5 d were added at the depicted effector to target (E:T) cell ratios, and were incubated for 3 h. The percentages of target cell lysis are reported as means ± SD from triplicate measurements. **P < 0.01 (two-tailed, unpaired Student t test). These data are representative of at least 2 independent experiments yielding comparable results.

Figure 7. pp65-specific T cells re-stimulated by CD137L-derived dendritic cells are more cytotoxic than T cells re-stimulated by classical dendritic cells. (A) The lymphoblastic cell line CM371 and monocytes isolated from a HLA-A2+ donor were immunostained for HLA-A2 and CD20 expression or HLA-A2 expression, respectively, and analyzed by fluorescence cytometry. (B) CM371 cells were loaded with the DELFIA® BATDA reagent, pulsed or not with pp65-derived peptides and used as target cells. T cells re-stimulated by exposure to the indicated type of dendritic cells (DC) for 5 d were added at the depicted effector to target (E:T) cell ratios, and were incubated for 3 h. The percentages of target cell lysis are reported as means ± SD from triplicate measurements. **P < 0.01 (two-tailed, unpaired Student t test). These data are representative of at least 2 independent experiments yielding comparable results.
Supplemental material

Additional material

Download Zip (117.2 KB)