Abstract
The Nafferton Factorial Systems Comparison experiments were begun in 2003 to provide data on the production and quality effects of a whole spectrum of different crop production systems ranging from fully conventional to fully organic. In this paper, the crop production data for the first 4 years of the experiments have been used to conduct a life cycle analysis of the greenhouse gas (GHG) emissions from organic and conventional production systems. Actual yield and field activity data from two of the treatments in the experiments (a stocked organic system and a stockless conventional system) were used to determine the GHG emissions per hectare and per MJ of human food energy produced, using both the farm gate and wider society as system boundaries. Emissions from these two baseline scenarios were compared with six other modelled scenarios: conventional stocked system, a stockless system where all crop residues were incorporated into the soil, two stocked systems where manure was used for biogas production, and two stockless systems where all crop residues were removed from the field and used for bio-energy production. Changing the system boundary from the farm gate to wider society did not substantially alter the GHG emissions per hectare of land when organic production methods were used; however, in conventional systems, which rely on more off-farm inputs, emissions were much greater per hectare when societal boundaries were used. Incorporating on-farm bioenergy production into the system allowed GHG emissions to be offset by energy generation. In the case of the organic system that included pyrolysis of crop residues, net GHG emissions were negative, indicating that energy offsets and sequestration of C in biochar can completely offset emissions of GHG from food production. The analysis demonstrates the importance of considering system boundaries and the end use of all agricultural products when conducting life cycle analyses of food production systems.
1 Introduction
Agricultural production has been identified as a major contributor to atmospheric greenhouse gases (GHG) on a global scale with about 14% of global net CO2 emissions coming from agriculture [Citation1]. In northern developed countries, agriculture contributes a smaller proportion of total emissions; in the USA, relative emissions from agriculture are estimated to be about 6% [Citation2], while in the UK they are about 7% [Citation3]. Nevertheless, there is considerable interest in determining the most carbon neutral ways to produce food in the temperate regions of the world. Several authors have reported that emissions from organic farming are lower than from conventional production on both an area basis [Citation4] and per unit income generated [Citation5]. However, there remain issues related to the comparative productivity of organic and conventional farming, the appropriate factors to use for calculating emissions, and the appropriate boundaries to use in assessing systems.
System boundaries need to be defined for correct accounting of emissions associated with inputs, within field/farm activities, and after the product leaves the farm [Citation6]. Traditionally, the emissions from inputs, often termed ‘indirect’ emissions, are fairly well accounted for. Figures are available in the literature that can be applied to most manufactured inputs used in agricultural production [Citation7]. Emissions for on-farm activities can be calculated using default figures for energy use for field activities, converted to CO2 equivalents (CO2e) [Citation8]. Additional emissions from soils due to field activities, as well as from crop and livestock production, can all be estimated using existing IPCC default values [Citation9]. However, problems with system boundaries in environmental accounting of agricultural systems could arise post harvest when products leave the field and it is very important to define a meaningful boundary. If we use the farm gate as the system boundary, we ignore the differences in emissions due to transport and processing of products. We also ignore how differences in the end use of the product and its by-products can affect net environmental impacts.
The units of measurement selected to assess environmental impacts can also have a significant influence on the outcome. In crop production the calculated emissions may be expressed on an area basis [Citation4,Citation10], per ton of crop, or per unit livestock feed energy produced [Citation8,Citation11]. A more appropriate metric may be the human food energy produced by a system as reported in Cederberg and Mattsson [Citation12], who defined a functional unit as 1000 kg energy corrected milk leaving the farm gate, or Korsaeth [Citation13] who converted all farm produce in their study into metabolizable energy for human consumption.
Including the on-farm production of bio-energy (e.g., biogas digestion, biomass burning) in GHG emission balances may offset some of the emissions from food production. Frederikson et al. [Citation14] were able to reduce the global warming potential of an organic farming scenario by 58–72% by including bio-energy options including rape methyl ester, ethanol and biogas (from digestion of silage) in their balance calculations. Digestion of liquid livestock slurries for biogas production has been studied extensively [Citation14–Citation17] and energy production has been estimated as 0.619 MJ per litre slurry [Citation18]. Alternatively, pyrolysis systems that produce energy and a highly stabilized carbon by-product (biochar) have also been advocated [Citation19–Citation22]. Energy produced from pyrolysis can be used to offset emissions from fossil fuel burning, and the carbon stored in the biochar can be used as an offset in the balance calculations, since it has a long residence time (500–7000 years for the biochar-C in the Terra Preta soils of the Amazon [Citation23]).
In this study we have compared GHG emissions from organic and conventional production systems, and also investigated how the conclusions about the emissions from different systems can be affected by the end uses of by-products of production (i.e., animal wastes and crop residues). These analyses have been conducted using the farm gate as a boundary (on-site emissions), and also including emissions beyond the farm gate to give a measure of the total impact of each production system [Citation5], in order to demonstrate the significance of boundary selection in GHG emission assessments. Two baseline systems from the Nafferton Factorial Systems Comparison trial were compared with alternatives with varying end uses of agricultural by-products, which could dramatically alter the GHG balance for each of these systems. The on-site and total impacts were compared for baseline and alternative scenarios.
2 Materials and methods
The Nafferton Factorial Systems Comparison (NFSC) trial was established in 2003 and consists of a set of four experiments that compare organic and conventional systems of (a) crop rotation, (b) crop protection, and (c) fertility management, in a factorial design. Each experiment is identical in design, but was begun in a different year in order to allow for a diversity of crops to be studied in any given year. In each experiment crop rotation is the main plot (12 m × 96 m) with two levels: organic (diverse, rich in leguminous crops) and conventional (arable-crop dominated rotation typical of conventional systems). These rotations reflect typical organic and conventional crop rotations used by dairy farmers in eastern England (). Each main plot is divided into two crop protection subplots (12 m × 48 m) in which crop protection is carried out according to conventional farming practice (British Farm Assured standards) or to organic crop protection standards (Soil Association organic farming standards). Each of these subplots is divided into two fertility management sub-subplots (12 m × 24 m) in which fertilization is either carried out according to conventional farming practice (recommended N, P and K applied as inorganic fertilizers) or organic farming standards (composted dairy manure applied at the recommended total N rate for each crop). The arrangement of crop protection subplots and fertilization sub-subplots within main plots is randomized. Records of inputs to and outputs from selected plots in the NFSC experiments were used to represent a full 8-year cycle of each crop rotation. Greenhouse gas balances were calculated using a combination of ‘real’ recorded data from organic and conventional production systems in the NFSC experiments and estimated emissions using published default emission factors. A summary of the sources of default values and variables used in this study is shown in . Preliminary analysis of the NFSC experiments indicated that fertility management was the main factor driving differences in GHG emissions between the systems [Citation24]. To simplify the study only 2 of the 16 potential combinations of the 3 factors are included in this exercise: an organic crop rotation under organic crop protection and fertility management (ORG in ), which represents a stocked, organic system, and a conventional crop rotation under conventional crop protection and fertility management (CON in ), which represents a stockless system. These two existing baseline systems are compared with a number of alternative, simulated scenarios also listed in . They include: a conventional stocked system (C-ST), an organic stockless system where all crop residues are incorporated into the soil (O-SL), two stocked systems where manure is used for biogas production (O-BG and C-BG), and two stockless systems where all crop residues are removed from the field and used for bio-energy production (O-BC and C-BC).
Table 1 Details of the crop rotations used in the Nafferton Factorial Systems Comparison experiments.
Table 2 Overview of sources of default values and variables used in greenhouse gas estimates from organic and conventional production systems.
Table 3 Details of the agricultural systems used for baseline scenarios and alternative scenarios.
Table 4 Default figures used for calculating greenhouse gas emissions from field activities (direct emissions) for the Nafferton Factorial Systems Comparison experiments.
Crop yields for the baseline scenarios were the actual, average values for each crop under each treatment, measured in the NFSC experiments during the period 2004–2007. Crop yields for the alternative scenarios were assumed to be unaffected by the change in management except for stockless systems where it was assumed that the incorporation of straw into the soil following crop harvest would lead to a 10% reduction in yield of the subsequent crop, due to N immobilization. This was the case for the potatoes grown in the O-SL and O-BG systems, and for the second winter wheat, winter barley and potatoes in the C-BG system.
In order for the scenarios to accurately reflect real emissions from the various systems, a realistic estimate of stocking density (for the stocked systems) was required. Stocking density calculations were based on feed energy production in each scenario relative to the feed energy requirements for dairy production. It was assumed that the replacement rate for the milking cows was 25% in both systems and this was accounted for by adjusting the total metabolizable energy (ME) required to maintain one cow (60 MJ day−1) to include 25% of total ME (including maintenance, growth and pregnancy) for a 6-month-old (50 MJ day−1) and an 18-month-old (80 MJ day−1) replacement heifer. This maintenance energy was added to the energy required to produce a typical yield of milk for an organic cow (6758 l y−1) or a conventional cow (8250 l y−1) [Citation25] assuming that it takes 5.4 MJ of ME to produce one litre of milk [Citation8,Citation13]. Based on these calculations, 78,313 MJ of ME from feed is necessary to support one cow plus followers in a conventional system compared with 70,256 MJ of ME from feed in an organic system. Typically, the stocking density on a dairy farm, especially on organic units, is determined by the amount of forages available for feeding. Under conventional production it was assumed that 50,903 MJ of this energy comes from forages (65%) whereas in the organic system the assumption was 80% or 56,205 MJ of ME from feed comes from forages [Citation26]. These figures are based on the results of farm surveys in England and Wales carried out as part of the QualityLowInputFood project [Citation27]. The dietary energy provided by forages in each of the stocked systems was calculated assuming that one eighth of the farm's land was in each of the eight crops in the rotation in any given year. This meant that for the conventional rotation, forages were present on 25% of the land each year, and for the organic rotation, 37.5% of the land was in forages each year. All crop yields (except for potato and cabbages) were converted to ruminant metabolizable energy using the figures in . Total energy supplied by forages in each of the scenarios was converted to the number of livestock units supported on an 8-ha parcel of land, and expressed as LU ha−1. The remaining energy requirements were supplied by the barley first, followed by the wheat. Shortfalls in cereal and protein supply were balanced by purchased feed, whereas excess cereals and beans were assumed sold off the farm. It should be noted that since forage yields were not affected by changes from the baseline to the alternative scenarios, stocking densities also did not vary among the various stocked scenarios. The resulting average stocking rates were 0.69 LU ha−1 throughout the rotation on both the conventional and organic stocked examples.
Upstream emissions included all inputs up to the harvest of the crop, while downstream emissions included all emissions occurring after the harvest of the crop. Offsets (or avoided emissions) were also included in the balance and included avoided fossil energy use in the scenarios where energy production was included.
2.1 Calculation of on-site upstream emissions
For on-site estimates, all emissions from field activities associated with the production of the crop under different management systems were included. Default values used for the field activities are shown in , and were derived from figures reported in the literature [Citation7,Citation8]. These represent both direct and indirect emissions arising from the burning of fossil fuel, the emissions of N2O and CH4 during fuel extraction and transport, and the energy costs of producing farm machinery. Data from the NFSC experiments between 2004 and 2008 that corresponded to years 1–8 in the organic or conventional crop rotations provided actual records of field activities (since half of the plots within the NFSC started in rotation year 4 of the experiment, the entire 8-year rotation can be assessed in 4 years). In cases where data for any particular rotation year were duplicated, the emissions for each of the years were summed and averaged to come up with one typical value for emissions during that rotation stage.
Soil emissions of nitrous oxide from organic N incorporated into the soil as crop residues were included in the calculations. These were based on the 2006 IPCC Guidelines for National Greenhouse Gas Inventories [Citation28]. This is calculated from the amount of organic N added to the soil multiplied by an emission factor for organic N in residues of 0.01 kg N2O-N/kg N input. Nitrous oxide emissions were converted to CO2 equivalents (CO2e) using a global warming potential on a 100-year time horizon of 310 times CO2 [Citation3]. Soil emissions from residue incorporation were estimated after the ploughing in of the grass/clover crop (in year 1 of the rotation). Amounts of residues were estimated as the yield of the third harvest of grass clover in year 8 and actual N contents in the harvested forages were used to calculate the quantities of organic N incorporated into the soil. For those scenarios where straw was returned to the field, organic N added to the soil was calculated from actual straw yields in the NFSC experiments (2004–2008) and an assumed average straw-N content of 0.87% for conventionally managed cereals and 0.62% for organically managed cereals (based on analysis of straw from the NFSC experiments).
Amounts of N fertilizer used in the inorganic fertilizer treatments were multiplied by a factor of 0.01 kg N2O-N/kg N input to determine soil emissions of nitrous oxide due to fertilization with N fertilizer [Citation9]. Similarly, emissions of nitrous oxide from applications of organic fertilizers (in this case composted dairy manure) were calculated based on the total N content of the added compost with an emission factor of 0.01 kg N2O-N/kg N input used to convert 1 kg organic N to emissions of nitrous oxide [Citation9]. It is important to note that the calculations did not take account of losses of nitrous oxide from the manure that may have occurred during the composting process. Similarly, methane and carbon dioxide emissions during composting were also not accounted for in this calculation.
Although direct carbon dioxide, methane and nitrous oxide released during the composting process were not estimated, emissions associated with energy use during its production were included in the on-site emissions. These emissions per ton of compost were estimated based on the number of times that the compost was turned while it was being produced (approximately 12 times for compost produced at Nafferton Farm). Energy use for each turning was taken from the value for handling in , i.e., 0.5 l diesel fuel per ton of waste; therefore 6 l diesel per ton in total was used for turning the compost and 1.92 kg CO2e per ton compost was emitted. Throughout this document we have assumed that 3.2 kg CO2 are emitted for every litre of diesel burned (based on UK Department of Transport figures). The total figure per ton fresh compost was then multiplied by the number of tons of fresh compost applied per hectare to get the indirect energy emissions from compost use.
2.2 Calculation of on-site downstream emissions
Downstream on-site emissions included direct emissions from field activities for the harvest and on-farm processing of crops. Default values for field activities were used as described above (). On-farm processing included the drying of grain produced on the farm to a uniform moisture content of 14%. The average moisture contents of grain harvested from the NFSC experiments under organic and conventional management were used along with actual yields to get an estimate of the energy emissions in each of the baseline scenarios. A figure of 4 l diesel fuel for every ton of wet grain that needed drying was used, based on figures from ADAS [Citation29]. Silage was assumed to be made in round bales and the energy used in baling was included as an on-farm emission ().
The average stocking densities for the 8-year rotations were used to calculate methane emissions using a figure of 155 kg CH4 per conventional dairy cow and 173.6 kg CH4 per organic dairy cow [Citation12]. The higher methane emission per organic cow is based on Swedish data that indicate that organically fed cattle emit 12% higher amounts of methane due to the higher proportion of forage in their diet.
2.3 Calculation of beyond the farm gate upstream emissions
The emissions resulting from the manufacture of off-farm inputs used in the crop management (sometimes called indirect emissions) were included. These were: 2.86 kg CO2e/kg N, 2.57 kg CO2e/kg P, 0.73 kg CO2e/kg K and 23.1 kg CO2e/kg pesticide [Citation4].
2.4 Calculation of beyond the farm gate downstream emissions
For systems that included the sale of livestock feed off the farm, cereals were assumed to be fed to pigs. Pork was assumed to contain 9.25 MJ energy per kg ground raw pork [Citation30] and emissions associated with pork production were included in the balance using a figure of 1.65 kg CO2e/kg pork [Citation31]. This represents the emissions from additional feed production (soya bean), manure and enteric fermentation, and energy use on the farm and at the slaughterhouse. For the scenario where forages were sold off the farm (CON), methane emissions from the number of dairy cattle that the forages would feed (using the same assumptions described previously for conventional dairy cows), were included in the balance.
2.5 Greenhouse gas offsets
The potential to offset GHG emissions in some of the scenarios was included in the calculations. Beyond the farm gate boundary, for those scenarios that included an energy producing alternative (e.g., the pyrolysis systems in O-biochar and C-biochar, and the biogas systems in O-biogas and C-biogas) the GHG emissions avoided due to fossil fuel substitution were included. The energy content of the crop residues was assumed to be 16 GJ/ton, which is in the mid-range reported by the US Department of Energy [Citation32]. In the pyrolysis scenario it was assumed that the system was a slow pyrolysis system appropriate for crop wastes, optimizing biochar production and with an energy yield of 38% of the energy contained in the feedstock [Citation22], i.e., 6 GJ per ton crop residues. Also, for the pyrolysis scenarios, the C that was not oxidized during energy production was assumed to be to sequestered (highly stable biochar). Straw was assumed to be 46% C on a dry basis [Citation33] and the forages were assumed to be 45% C [Citation34].
Biogas energy production was based on the calculated stocking densities in each scenario (see above), assuming cows were housed for 200 days of the year and produced 55 l of slurry per cow per day during this time. Dairy manure slurry was converted to energy from biogas using a conversion factor of 0.619 MJ/l slurry [Citation18]. Offsets were then calculated assuming that electricity generated from coal was being replaced, using values from the IPCC default emission factors for stationary combustion in the energy industry for sub-bituminous coal (0.0965 kg CO2 MJ−1) [Citation9].
2.6 Human food energy calculations
To reflect local practice in the region, it was assumed that all livestock feed sold off the farm was directed to pig feeding. This was converted to human food energy using the digestible energy values for pigs included in and then converted to MJ pig meat, assuming a feed conversion ratio of 3:1 for pigs, and a dressing percentage of 80% (conversion live pig weight to edible products). In all scenarios where milk was produced, the yield of milk (based on the typical production of cattle at Nafferton farm, and using the stocking densities calculated as described above) was converted to human energy using a conversion factor of 2.65 MJ/l energy-corrected milk. Milk yields were converted to energy-corrected milk (ECM) using the formula in Bernard [Citation35]. The human food value of potatoes was assumed to be 15,541 MJ per ton dry potatoes (for white, boiled potatoes with no fat added during cooking) and 13,318 MJ per ton dry cabbage (for raw cabbage). All food energy values were based on USDA survey values [Citation36].
Table 5 Ruminant metabolizable energy (ME) and digestible energy (DE) (pigs) conversion factors.Table Footnotea
3 Results and discussion
3.1 Gross emissions per hectare for the different scenarios
The results of the calculations for gross emissions from each of the different scenarios with and without a farm gate boundary are shown in . For organic systems where cattle were kept on the farm (ORG and O-BG), there was virtually no difference in gross emissions when the boundary was drawn at the farm gate, as opposed to a broader societal boundary. Most of the emissions from these systems (73–75%) arose from methane produced by enteric fermentation in the rumen of the dairy cattle. For the stockless organic systems (O-SL and O-BC) total emissions were lower overall, with more than half of the emissions exported outside of the farm gate. In the stockless organic systems, 49–53% of the emissions arose from the feeding of cereals to pigs off the farm.
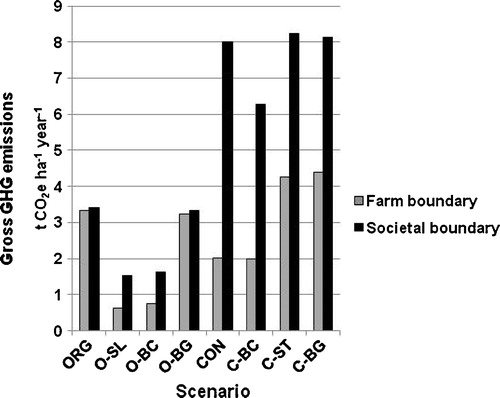
In all four conventional systems there was a substantial difference between emissions up to the farm gate and emissions at the societal scale. The stockless conventional system (CON) derived 40% of its total GHG emissions from the feeding of the cereals that were sold off the farm, to pigs. Off-farm emissions for the C-BC system were slightly lower since forage crop residues were used for on-farm energy production by pyrolysis, rather than being fed to ruminants off-farm. The higher on-farm emissions for the C-ST and C-BG systems were due to methane emissions from dairy cattle. Although manufacture of inorganic nitrogen fertilizer is an energy intensive process also resulting in significant emissions of nitrous oxide, it does not contribute a large proportion of the emissions in the conventional systems. Emissions largely arise from livestock consuming the crops both on-farm and beyond the farm gate. For example, in the stockless conventional scenario (CON), emissions from the manufacture of off-farm inputs including N fertilizer, only accounted for 14% of the total emissions. Hillier et al. [Citation37] found that N application rates, whether from inorganic or farmyard manure (FYM) sources, explained 95% of the variation in the carbon footprints of different farm types in Scotland. However, they only determined carbon footprints for crop production systems up to the farm gate, and did not include emissions from livestock in their analysis. If we exclude methane emissions from our calculations, the average annual on-site emissions for our ORG baseline scenario are 841 kg CO2e ha−1, which is similar to the carbon footprints of the farms in the Hillier et al. study (728 kg CO2e ha−1). Estimates of on-farm emissions for a comparable stockless conventional system in our analysis were 2019 kg CO2e ha−1 (for CON) compared with 1541 kg CO2e ha−1 for the conventional farm types in the Scottish study.
3.2 Gross emissions per MJ human energy for the different scenarios
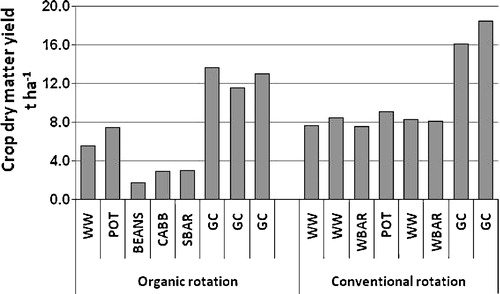
Average crop yields for the first 4 years of the Nafferton Factorial Systems Comparison experiments (which includes all stages of the rotation in at least 1 year) are shown in . The conventional rotation yields were used as the baseline for calculations in the CON treatment whereas the organic rotation yields were used in the ORG treatment. On average all yields were lower under organic production; however, these yields are representative of an organic system at the transition phase of the conversion to fully organic production. At this stage in the conversion it is common to experience reductions in crop yield as the land adjusts to a fully biological system of production [Citation38]. Entz et al. [Citation39] reported grain yields 23–27% lower on a survey of organic farms compared with conventional in the Great Plains of North America; however, they also reported maximum yields on organic farms that were greater than the long-term averages for conventional farms, indicating that there is potential in organic systems to improve yields. In the Nafferton experiments, N is supplied either from the legumes in the rotation (grass/clover ley or beans) or from compost applied based on its total N content. Since 95–100% of the N in the compost is in the organic form (for composts used between 2004 and 2007), it may not be readily available to the growing crop during the year of application and crop growth may be N-limited. As reserves of organic N are built up in the soil, N mineralized from these reserves will contribute an increasing amount of N towards crop growth. In addition, the long-term inputs of organic matter in organic farming systems can alter the composition and activity of the soil microbial community relative to conventional management [Citation40,Citation41]. This can lead to a soil microbial community that is more adapted to cycling of N in organic systems, i.e., with enhanced biological N fixing capacity and more efficient pathways for mineralization of nutrients from organic matter.
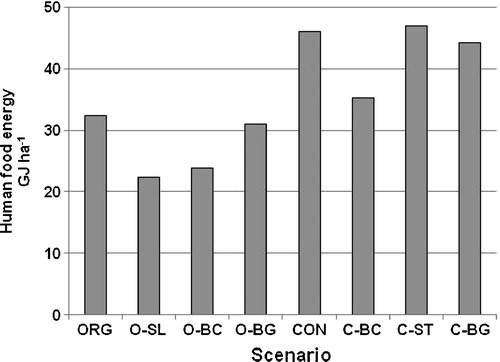
Food energy produced ranged from approximately 47 GJ ha−1 on average over the 8-year rotation for the stockless C-ST scenario, to 22.4 GJ ha−1 for the stockless organic scenario (O-SL) (). In the organic scenarios the best way to maximize food production was to include livestock (in this case dairy cattle) on the farm. In the organic systems, dairy cattle can capitalize on the productive grass/clover swards that dominate the crop rotation, and convert this plant energy to human food energy. Food yields for the two stockless scenarios under organic management were lower since in these scenarios human food energy is only produced in five out of the 8 years of the rotation. In the other 3 years the grass/clover sward is either left in situ as mulch (O-SL), or converted to energy in a pyrolysis system (O-BC). In the stockless CON system it was assumed that the harvested crops were sold off the farm every year and used to feed livestock, or were directly used for human consumption. This is possible in the conventional systems since crop yields do not rely on the nutrients in the grass/clover biomass. In conventional systems the nutrients that are exported off the farm in crop and animal products can be replenished by purchased inorganic fertilizer inputs.
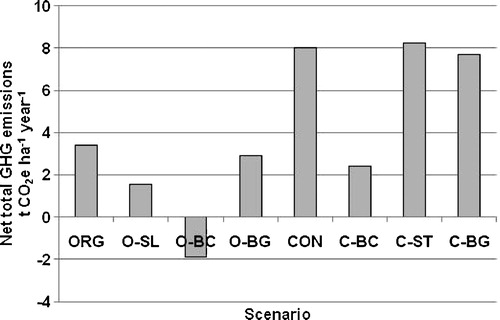
3.3 Net greenhouse gas emissions including on-farm bio-energy production
In the four bio-energy scenarios (O-BC, O-BG, C-BC, C-BG) emissions of GHG can be offset if the energy produced on-farm is assumed to displace the burning of fossil fuels. In these scenarios we assumed that coal burning for electricity was offset by on-farm generation of energy. In the biochar scenarios the sequestration of C was also included as an offset, since a highly stable carbon material is a by-product of energy production using pyrolysis systems. In the O-BC system, GHG emissions from the system are more than completely offset by the energy produced and the C sequestered. Most of the offsets are due to C sequestration (67%). These offsets are based on the assumption that the biochar produced from the on-farm bio-energy system is relatively stable. However, this assumption should be treated with caution. Steinbess et al. [Citation42] studied the turnover of synthetically produced yeast- and glucose-derived biochars in soils. They noted a stimulation of native soil-C losses from soils that received the biochar and calculated a mean residence time for their biochars of 4–29 years. This is significantly less than the 100–1000-year residence times that have been reported in the literature [Citation23]. However, there is huge variability in the characteristics of biochar, depending on feedstocks and production conditions, which can lead to different mean residence times [Citation43]. In addition, the measurement of turnover times of new inputs of biochar to soils presents challenges, because its relatively slow C mineralization rate makes measuring difficult with standard incubation techniques [Citation23]. This means that some degree of uncertainty is associated with any GHG emission scenarios that involve biochar ().
Scenarios that involved recovery of bio-energy from biogas systems offset 410 kg CO2e ha−1 in the O-BG scenario and 451 kg CO2e ha−1 in the C-BG scenario. This accounted for 12% of total emissions in the O-BG scenario and 6% in the C-BG scenario. The inclusion of biogas digesters on farms with ruminants is one strategy to compensate for the high emissions of methane from the rumen. However, emissions from the rumen accounted for 73–75% of the total emissions from the stocked organic systems and for 25–27% of emissions from the stocked conventional systems. So it is apparent that a multi-faceted approach to reductions in methane emissions from ruminant systems will need to be implemented. This could include a reduction in the fibre content of the diet, the inclusion of vegetable oil to suppress rumen protozoan activity, or longer term benefits from selective breeding (of livestock, forage crops and/or rumen microbes). Effective methane output per unit of food (milk or meat) can also be reduced if progress is made with improving longevity and/or productivity, spreading the methane generated during the rearing phase over a greater output. This whole area is complex and still in its infancy; it is interesting to note that current modelling (IPPC, tier 2) does not acknowledge progress from any of these measures.
The offset of GHG emissions by soil C sequestration, apart from the biochar-C, was not included in this analysis. On average, organically farmed land has higher soil-C levels than conventionally farmed land. In 1987, Reganold et al. [Citation44] reported in the prestigious journal Nature, that a side-by-side comparison of an organically and a conventionally managed wheat field showed higher soil-C levels in the organic field. This resulted in more comprehensive paired comparisons of organic and conventional farms. In 1992, Armstrong Brown et al. [Citation45] surveyed 30 pairs of organic and conventional farms in the UK and reported a trend towards higher soil organic matter levels for organic horticultural and arable farms compared with their conventional equivalents. They attributed the differences to the greater use of FYM, reduced tillage intensity, and more periods under temporary ley or permanent pasture.
Including soil-C in GHG inventories remains a contentious issue. Changes in soil-C occur gradually, and eventually reach an equilibrium value that is related to annual inputs of soil-C balanced against losses. For some scenarios in this study, composted manure was returned to the soil (e.g., ORG and C-ST), whereas in the biogas scenarios, some of the C was lost from the system through conversion to CH4 and burning of the gas for energy. The remaining C, however, may be relatively resistant to decomposition since it is stabilized by the digestion process [Citation16]. Therefore it is likely that different quantities and qualities of carbon would be returned to the land in each scenario, and that this would result in variations in equilibrium soil-C among the scenarios. To include changes in soil-C in our GHG balance we would have needed to estimate differences in equilibrium soil-C between the baseline systems and the alternative scenarios and then calculate annual losses or gains of soil-C for each scenario relative to the baseline (e.g., ORG and CON). The rates of gain or loss of soil-C would be expected to diminish each year, so we would also have needed to arbitrarily choose a specific year since the conversion from the baseline to the alternative scenario. Estimating these values was beyond the scope of this study, and would ideally have involved the use of a recognized soil-C model such as CENTURY [Citation46] or ROTH-C [Citation47]. This type of analysis is planned for future life cycle assessments (LCAs) of the NFSC trial data.
3.4 Optimizing food production and minimizing GHG emissions
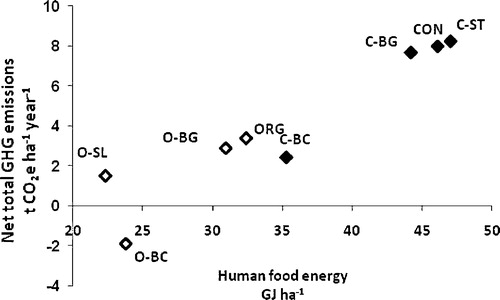
The ideal food production system will maximize food production, while minimizing environmental damage. If we plot the net GHG emissions versus the food energy produced in each of the scenarios () we see that the stocked conventional systems (C-ST and C-BG) and the stockless conventional (CON) systems, in which all crops are exported off the farm for livestock feed, produce the largest amounts of human food energy per hectare. However, this food production comes at the cost of high GHG emissions. Of the conventional production systems, only the scenario that includes the use of crop residues for bio-energy in a pyrolysis system resulted in significantly lower GHG emissions, but food production was also reduced. This is because in two of the 8 years in the rotation the crop is not used for livestock feeding, but is directed towards bio-energy production instead. All of the organic systems produced less food, but they also were all relatively low in emissions.
4 Conclusions
This simple analysis has highlighted some key aspects of life cycle analysis that need to be considered if the results are to be meaningful. In this analysis a full 8-year crop production cycle was studied. In the real world most farms are following a crop rotation and while some phases of the rotation may have relatively low emissions of GHG (the ley phase of the O-SL scenario in this analysis emitted less than 100 kg CO2e ha−1 y−1), other phases of the rotation may emit considerably more (e.g., the cabbage phase of the O-SL scenario emitted about 1400 kg CO2e ha−1 y−1 on-site). Therefore it is necessary to consider a full cycle of the crop rotation when comparing different farming systems, using lyfe cycle assessment (LCA).
Likewise, it is important to look at the full impact of GHG emissions beyond the farm gate, to effectively compare systems. The conventional systems in this study exported most of their emissions beyond the farm gate, resulting in externalized environmental costs that are not accounted for when the LCA stops at the farm gate. This was particularly evident when the emissions associated with pig farming (the ultimate consumers of crops produced on many arable farms in the UK) were also included in the balance. It is also inconsistent to use the farm gate as system boundary for downstream emissions, when most LCAs account for emissions from inputs well before they reach the farm (e.g., the upstream emissions associated with manufacture of farm inputs).
Food production remains the primary goal of farming in the UK and we are facing increasing challenges globally to feed the expanding world population. Therefore any LCA of farming systems needs to place this analysis in the context of food production. The scenarios in this study demonstrate the trade-offs that often exist between food production and environmental sustainability. The systems with the lowest emissions (O-SL and O-BC) also produced the lowest food energy per hectare; whereas highest emissions were associated with the most productive systems. But the fact remains that the highly productive, conventional systems in these scenarios were dependent on imported nutrients for their production. Inorganic nitrogen fertilizer is produced using energy from a non-renewable resource (fossil fuels) and P fertilizer is mined from soil reserves whose supply is finite. It has been estimated that known P-deposits may be depleted within 50 years [Citation48]. High levels of production may therefore not be sustainable in the long term.
The bio-energy scenarios show that there are innovations that can be adopted at farm level to at least partially offset GHG emissions from farming practices. In addition, on-farm bio-energy systems may generate additional income for the farmer, making their implementation a ‘win–win’ situation.
Further studies are needed to clarify the uncertainties associated with LCAs of farming systems. In particular, more research is needed on the stability of biochar-C and on improved strategies to reduce methane emissions from cattle. Overall, improvements in N-use efficiency at farm level will further reduce emissions from food production systems, and at the same time minimize environmental damage.
Acknowledgement
The authors gratefully acknowledge funding from the European Community financial participation under the Sixth Framework Programme for Research, Technological Development and Demonstration Activities, for the Integrated Project QUALITYLOWINPUTFOOD, FP6-FOOD-CT-2003-506358.
Related Research Data
References
- IPCC, IPCC Assessment Report 4 (2007).
- J.M.-F.JohnsonA.J.FranzluebbersS.L.WeyersD.C.ReicoskyAgricultural opportunities to mitigate greenhouse gas emissionsEnviron. Pollut.1502007107124
- S. Baggott, L. Cardenas, E. Garnett, J. Jackson, D. Mobbs, T. Murrells, N. Passant, A. Thomson, J. Watterson, UK Greenhouse Gas Inventory 1990–2005: Annual Report for submission under the Framework Convention on Climate Change, Department of Environment Food and Rural Affairs, 2007.
- B.KustermannM.KainzK.J.HulsbergenModeling carbon cycles and estimation of greenhouse gas emissions from organic and conventional farming systemsRenew. Agric. Food Syst.2320083852
- R.WoodM.LenzenC.DeyS.LundieA comparative study of some environmental impacts of conventional and organic farming in AustraliaAgric. Syst.892006324348
- S.SuhM.LenzenG.J.TreloarH.HondoA.HorvathG.HuppesO.JollietU.KlannW.KrewittY.MoriguchiJ.MunksgaardG.NorrisSystem boundary selection in life-cycle inventories using hybrid approachesEnviron. Sci. Technol.382004657664
- K.J.KramerH.C.MollS.NonhebelTotal greenhouse gas emissions related to the Dutch crop production systemAgric. Ecosyst. Environ.721999916
- T.DalgaardN.HalbergJ.R.PorterA model for fossil energy use in Danish agriculture used to compare organic and conventional farmingAgric. Ecosyst. Environ.8720015165
- IPCC2006 IPCC Guidelines for National Greenhouse Gas Inventories2006IGESJapan
- N.KogaT.SawamotoH.TsurutaLife cycle inventory-based analysis of greenhouse gas emissions from arable land farming systems in Hokkaido, northern JapanSoil Sci. Plant Nutr.522006564574
- K.RefsgaardN.HalbergE.Steen KristensenEnergy utilization in crop and dairy production in organic and conventional livestock production systemsAgric. Syst.571998599630
- C.CederbergB.MattssonLife cycle assessment of milk production – a comparison of conventional and organic farmingJ. Cleaner Prod.820004960
- A.KorsaethRelations between nitrogen leaching and food productivity in organic and conventional cropping systems in a long-term field studyAgric. Ecosyst. Environ.1272008177188
- H.FredrikssonA.BakyS.BernessonA.NordbergO.NoréP.-A.HanssonUse of on-farm produced biofuels on organic farms – evaluation of energy balances and environmental loads for three possible fuelsAgric. Syst.892006184203
- N.HalbergR.DalgaardJ.E.OlesenT.DalgaardEnergy self-reliance, net-energy production and GHG emissions in Danish organic cash crop farmsRenew. Agric. Food Syst.2320083037
- K.MollerInfluence of different manuring systems with and without biogas digestion on soil organic matter and nitrogen inputs, flows and budgets in organic cropping systemsNutr. Cycl. Agroecosyst.842009179202
- A.BoodooC.DelaitreT.R.PrestonThe effect of retention time on biogas production from slurry produced by cattle fed sugar caneTrop. Anim. Prod.41977121
- J.BalsamAnaerobic digestion of animal wastes: factors to considerNational Center for Appropriate TechnologyATTRA – National Sustainable Agriculture Information Service200612
- P.WinsleyBiochar and bioenergy production for climate change mitigationN. Zeal. Sci. Rev.642007510
- D.A.LairdThe charcoal vision: a win–win–win scenario for simultaneously producing bioenergy, permanently sequestering carbon, while improving soil and water qualityAgron. J.1002008178181
- M.E.SanchezE.LindaoD.MargaleffO.MartínezA.MoranPyrolysis of agricultural residues from rape and sunflowers: production and characterization of bio-fuels and biochar soil managementJ. Anal. Appl. Pyrol.852009142144
- J.L.GauntJ.LehmannEnergy balance and emissions associated with biochar sequestration and pyrolysis bioenergy productionEnviron. Sci. Technol.42200841524158
- J.LehmannC.CzimczikD.LairdS.SohiStability of biochar in the soilBiochar for Environmental Management2009EarthscanSterling, VApp. 183–205
- K. Thorup-Kristensen, J. Cooper, H.L. Kristensen, Z. Alwan, Environmental and sustainability audits of organic and low-input farming systems, in: Sixth Framework Programme for Research, Technological Development and Demonstration Activities, for the Integrated Project QUALITYLOWINPUTFOOD, FP6-FOOD-CT-2003-506358, European Union, Brussels, Belgium, 2009.
- Anonymous, in: School of Agriculture Food and Rural Development (Ed.), Nafferton Farm Guide 2007–2008, University of Newcastle Upon Tyne, Newcastle Upon Tyne, UK, 2008, p. 30.
- G.ButlerJ.H.NielsenT.SlotsC.SealM.D.EyreR.SandersonC.LeifertFatty acid and fat-soluble antioxidant concentrations in milk from high- and low-input conventional and organic systems: seasonal variationJ. Sci. Food Agric.88200814311441
- G.ButlerS.StergiadisM.EyreC.LeifertA.BorsariA.CaneverT.SlotsJ.NielsenEffect of production system and geographic location on milk quality parametersU.NiggliC.LeifertT.AlfoldiL.LueckH.Willer3rd International Congress of the European Integrated Project Quality Low Input Food (QLIF)Hohenheim, D(2007) 100–103.
- D.A.JasperManagement of mycorrhizas in revegetationA.D.RobsonL.K.AbbottN.MalajczukManagement of Mycorrhizas in Agriculture, Horticulture and Forestry1994Kluwer Academic Publishers211219
- ADAS Wales, Managing Energy and Carbon – The Farmer's Guide to Energy Audits, p. 35.
- USDA, USDA National Nutrient Database for Standard Reference, United States Department of Agriculture Agricultural Research Service, 2010.
- N.HalbergR.DalgaardJ.HermansenDanish experiences using Life Cycle Assessment (LCA) as a tool for assessing a livestock product's energy use and environmental impact through its life cycleEnvironment Symposium on Energy LCA in Food Systems Agricultural Sustainability Institute University of CaliforniaDavis(2007)
- J. Scurlock, Bioenergy Feedstock Characteristics, Oak Ridge National Laboratory, 2009.
- C.J.MulliganL.StrezovV.StrezovThermal decomposition of wheat straw and mallee residue under pyrolysis conditionsEnergy Fuels2420104652
- P.D’JesusN.BoukisB.Kraushaar-CzarnetzkiE.DinjusGasification of corn and clover grass in supercritical waterFuel85200610321038
- J.K.BernardMilk production and composition responses to the source of protein supplements in diets containing wheat middlingsJ. Dairy Sci.801997938942
- United States Department of Agriculture, USDA National Nutrient Database for Standard Reference, Release 17, p. 26.
- J.HillierC.HawesG.SquireA.HiltonS.WaleP.SmithThe carbon footprints of food crop productionInt. J. Agric. Sustainab.72009107118
- S.K.HuxhamD.L.SparkesP.WilsonThe effect of conversion strategy on the yield of the first organic cropAgric. Ecosyst. Environ.1062005345357
- M.H.EntzR.GuilfordR.GuldenCrop yield and soil nutrient status on 14 organic farms in the eastern portion of the northern Great PlainsCan. J. Plant Sci.812001351354
- F.WidmerF.RascheM.HartmannA.FliessbachCommunity structures and substrate utilization of bacteria in soils from organic and conventional farming systems of the DOK long-term field experimentAppl. Soil Ecol.332006294307
- A.FließbachH.R.OberholzerL.GunstP.MäderSoil organic matter and biological soil quality indicators after 21 years of organic and conventional farmingAgric. Ecosyst. Environ.1182007273284
- S.SteinbeissG.GleixnerM.AntoniettiEffect of biochar amendment on soil carbon balance and soil microbial activitySoil Biol. Biochem.41200913011310
- C.CzimczikC.A.MasielloControls on black carbon storage in soilsGlobal Biogeochem. Cycle212007Art. No. 3005
- J.P.ReganoldL.F.ElliottY.L.UngerLong-term effects of organic and conventional farming on soil erosionNature3301987370372
- S.M.Armstrong BrownH.F.CookH.C.LeeTopsoil characteristics from a paired farm survey of organic versus conventional farming in southern EnglandBiol. Agric. Hortic.1820003754
- K.H.PaustianW.J.PartonJ.PerssonModeling soil organic matter in organic-amended and nitrogen-fertilized long-term plotsSoil Sci. Soc. Am. J.561992476488
- D.S.JenkinsonTurnover of organic carbon and nitrogen in soilPhilos. Trans. R. Soc. Lond. B3291990361368
- R.J.FantelG.R.PetersonW.F.StowasserThe worldwide availability of phosphate rockNat. Resour. Forum91985524
- P.McDonaldR.A.EdwardsJ.F.D.GreenhalghC.A.MorganAnimal Nutrition6th ed.2002Prentice-HallHarlow, Essex, UK