
Abstract
Melissopalynology is an integral part of honey analysis and indicates the honey's botanical and geographical origin. Two preparation methods for light microscopy are commonly and interchangeably used in laboratories: acetolysis and hydration of honey samples. In this study, an extended comparison of the two methods was performed. Eight honey samples from eight locations in central Europe were analysed according to both standard procedures. We identified the pollen grains with 1000× magnification to the lowest possible taxonomic rank and counted out the relative abundances of each pollen type in the sample. In addition, potential other biases that might affect the results were investigated by analysing one honey sample multiple times with each method, consecutively. Across all honey samples, more pollen types were identified with the hydrated method (136) compared to the acetolysed method (95). For the hydrated method, less washing steps were necessary and a higher amount of pollen grains remained. No taxa-specific loss could be observed, apart from Myosotis sp., which was present in significantly lesser amounts in acetolysed compared to hydrated samples. This study shows a detailed analysis of the advantages and disadvantages of the two methods, which are also highlighted in a side-by-side comparison box. Both methods are equally suitable to perform melissopalynological analysis of the most common pollen types and pollen type combinations in honey. However, to identify the largest variety of pollen types in honey samples, the hydrated method is more efficient.
Pollen analyses have been an essential part of environmental research for many years in the fields of aerobiology (Oteros et al. Citation2013; Galán et al. Citation2014; Bastl et al. Citation2017), palaeobiology (Faegri & Iversen Citation1975; Grímsson et al. Citation2020; Geier et al. Citation2023), climatology (Straka Citation1975; Chevalier et al. Citation2020), and forensic palynology (Mildenhall et al. Citation2006; Weber & Ulrich Citation2016). In melissopalynology, they are used in food safety laboratories as important routine tool for the analysis of honey and other honeybee products (Maurizio Citation1975; Vorwohl Citation1995; von der Ohe et al. Citation2004).
In fact, one of the earliest pollen analyses of recent material has been conducted by apiarists in an attempt to identify foraging plants of honeybees. Identification literature for beekeepers with descriptions and drawings of unstained hydrated pollen grains date back to the 1930s, e.g. Armbruster and Jacobs (Citation1934–Citation1935), coinciding with the increasing availability of microscopes with sufficient magnification. The method of hydrating honey samples in glycerine or glycerol gelatine is simple yet effective and has been used by apiarists and melissopalynologists for more than a century to determine the botanical and geographical origin of honey, e.g. by Louveaux et al. (Citation1970, Citation1978), Sawyer (Citation1988), Vorwohl (Citation1995), the DIN (Deutsches Institut für Normung) (Citation2002), and von der Ohe et al. (Citation2004).
Since the mid-twentieth century, acetolysis of pollen samples is a much-utilised light microscopy (LM) method, besides simply hydrating a sample in water or glycerine. Erdtman (Citation1943) stated that there are several methods of pollen analysis available, but acetolysis would deliver the most beautiful results. Acetolysis, as described in detail by Erdtman (Citation1960) and revisited by Hesse and Waha (Citation1989), can be applied to any pollen sample and is the method of choice for palaeobotanists, climatologists and archaeologists due to the age of their analysed samples and the organic debris such samples commonly contain (e.g. Straka Citation1975).
Today, using the hydrated method is standard in melissopalynological investigations (von der Ohe et al. Citation2004). However, which method is actually used for honey pollen analysis depends largely on the training of the analyst, the common practise in the specific laboratory, the geographic region, and the available literature.
Differences in the results between the two methods might occur qualitatively during the identification of pollen types, when they highlight certain characteristics of a pollen grain (e.g. pollen wall sculpture), or quantitatively, when a statistically relevant amount of pollen grains is counted out to track the relative abundance of each pollen type in the sample, e.g. DIN (Deutsches Institut für Normung) (Citation2002) and von der Ohe et al. (Citation2004). These differences might impact the integrity of results in applied melissopalynology, where the occurrence of certain pollen types points to the geographical origin of the honey, and/or where absolute numbers and/or relative percentages are used to classify the botanical origin. Some aspects of sample quality and pollen identification level in regard to the two methods were described before (Lieux Citation1980), yet previous publications on the comparison of the two methods are scarce and often restricted to single honey samples or certain geographical locations (Gadbin Citation1979). More often, after pollen analysis was performed with a hydrated sample, a subsample was additionally acetolysed to confirm the botanical origin (e.g. Durán-Escalante et al. Citation2023).
The aim in this study was to elaborate on the similarities, differences, and potentials of both methods by conducting melissopalynological analyses from multiple samples and multiple places, both in acetolysed and hydrated state. To this end, honey from four countries was investigated. In addition, one selected sample was repeatedly prepared and analysed five times consecutively with both methods to investigate possible influences on the results other than the preparation method.
Material and methods
Study design
In the first part, pollen analyses of the same eight honey samples in hydrated state as well as in acetolysed state were performed. In the second part, one selected honey sample was independently prepared and counted in four more repeats, in order to check for possible variance within one preparation method (see ).
Table I. Study design
Material
Eight honey samples from eight different cities in central Europe were analysed. The cities were Munich (Germany), Bratislava (Slovakia), Ljubljana (Slovenia), as well as Vienna, Linz, Salzburg, Innsbruck, and Klagenfurt (all located in Austria). All extracted honey samples were harvested in the summer of 2020 by local apiarists. For the purpose of depicting a greater variety of pollen types in the sample of each city, honey from several apiaries within the respective city was mixed. The number of apiaries that were represented in the final eight honey samples ranged from two (Ljubljana, Linz, Salzburg, Innsbruck) to 18 (Vienna) according to availability. All samples were thoroughly homogenised before further handling.
For the second part of the study, the honey sample from Munich was analysed four more times. The sample from Munich was selected as it showed the largest variety of pollen types among all analysed samples, with morphologies ranging from very small to very large size.
Acetolysis method (LM)
Acetolysis of samples was performed after Halbritter et al. (Citation2018), with some adaptations for melissopalynology. For this study, 10 g of honey were added to approximately 30 ml of warm water in a small beaker and thoroughly dissolved on a heated magnetic stirrer for 3 min. The sample was transferred into a 12 ml round-bottom centrifuge glass tube and centrifuged at 3000 rpm (1107 × g) for 3 min. The supernatant was decanted and the rest of the solution was added, after which it was centrifuged and decanted again until completed. Before acetolysis, the concentrated pollen material was washed with acetic acid to remove the water and centrifuged at 4000 rpm (1968 × g) for 3 min. After the acetic acid was carefully decanted, acetolysis mixture consisting of nine parts acetic anhydride and one part concentrated sulphuric acid was added to approximately two thirds of the height of the glass tube. The sample was then placed in an ultrasonic water bath at 80 °C for 10 min. Afterwards, the tube with the acetolysed sample was taken out and centrifuged for 6 min at 3000 rpm (1107 × g). The supernatant acetolysis mixture was decanted, a drop of acetic acid was added and vortexed before washing the sample once more in acetic acid. After 3 min at 4000 rpm (1968 × g), the acetic acid was decanted and a final washing step with deionised water was performed. After decanting the tube for a last time, it was placed upside down on a filter paper for at least 10 min. Finally, 100 µl of deionised water was added to the pollen sample and pipetted onto a heated object slide. When the water was nearly completely evaporated, a drop of Kaiser’s glycerol gelatine (Mulisch & Welsch Citation2015) was placed on the sample and it was covered with a 20 mm × 20 mm cover glass.
Hydration method (LM)
An adapted version of the standardised method of melissopalynology according to von der Ohe et al. (Citation2004) was used to perform a detailed LM pollen analysis. From each homogenised honey sample, 10 g were mixed with 30 ml of deionised water and placed on a magnetic stirrer for 5 min. The solution was centrifuged at 3000 rpm (1107 × g) for 3 min in a 12 ml pointed centrifuge glass tube and decanted. These steps were repeated until the solution was completed. The sugary deposit was carefully removed using a pipette. The remaining pollen pellet was resuspended in 100 µl of deionised water. As the amount of pollen was very high at this stage, only approximately half of the suspended pollen was pipetted onto an object slide. This reduced the risk of problematic overlay of pollen grains caused by too much material used. The object slide was then dried on a heating plate and in a final step, the sample was embedded in one drop of Kaiser’s glycerol gelatine (Mulisch & Welsch Citation2015), covered with a 20 mm × 20 mm cover glass and let rest for 24 h.
Pollen identification and counting
LM analysis was performed with an Olympus BX50 with attached digital camera. At least one grain of each distinct pollen type was documented, which is recommended for a later identification attempt, or when proceeding with the analysis at another timer. For documentation, micrographs were taken at a 1000× magnification and in three different optical sections: top view and bottom view for details of the pollen wall sculpture and apertures, and the optical cross-section for pollen wall thickness and measuring the pollen diameter (Koelzer et al. Citation2023). If necessary for correct identification, we consulted online pollen databases PalDat (Citation2000 onwards) and Pollen-Wiki (Stebler Citation2023), as well as relevant literature (e.g. Reille Citation1992; Beug Citation2004). Pollen grains were also counted out with 1000× magnification and up to a total amount of 500 in both methods. To guarantee homogeneous examination of the slide, counting was done in a matrix of multiple random equidistant lines, as in von der Ohe et al. (Citation2004). Spores, algae and other palynomorphs were not considered. Grains of anemophilous Poaceae and Pinaceae were included into the 500 pollen grains for the purpose of a full comparison between the methods with all pollen types. Broken pollen grains were only included when they could be distinctly assigned to an already identified pollen taxa.
All pollen identification and counting were performed by the same palynologically trained researcher, who has more than four years of experience in analysing both acetolysed and hydrated honey samples.
Results
All eight honey samples were analysed using the acetolysed as well as the hydrated method. The identified taxa as well as their relative abundances in the honey samples are seen in Supplemental Table I (acetolysed) and Supplemental Table II (hydrated). show the 20 most abundant pollen types across all pollen countings.
Figure 1. Some of the most abundant pollen forms in acetolysed (left) and hydrated (right) state. A–D. Castanea sativa in equatorial view. E–H. Acer sp. in polar view. I–L. Prunus sp. in polar view. M–P. Myosotis sp. in equatorial view. Q–T. Aesculus hippocastanum in equatorial view. Scale bars ‒ 10 µm.
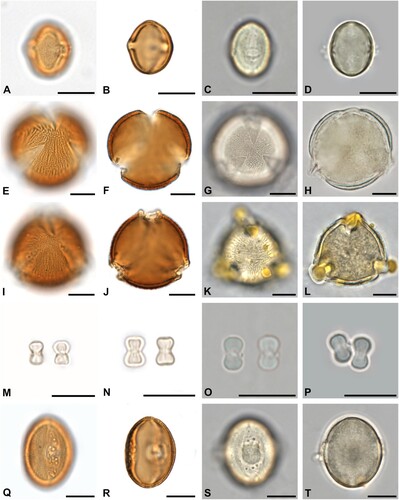
Figure 2. Some of the most abundant pollen forms in acetolysed and hydrated state. A–D. Filipendula sp. in equatorial view. E–H. Ailanthus altissima in equatorial view. I–L. Salix sp. in equatorial view. M–P. Malus-type in polar view. Q–T. Tilia sp. in polar view. Scale bars ‒ 10 µm.
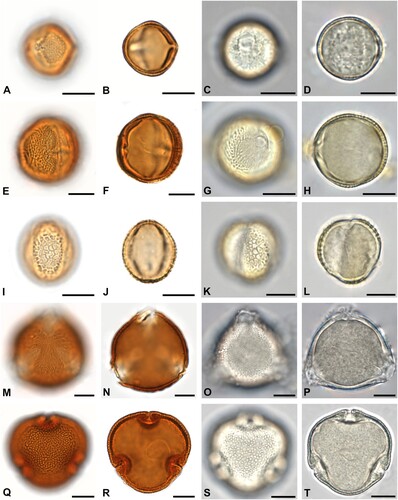
Figure 3. Some of the most abundant pollen forms in acetolysed and hydrated state. A–D. Brassicaceae in polar view. E–H. Buddleja sp. in equatorial view. I–L. Parthenocissus sp. in equatorial view. M–P. Plantago sp. in oblique view. Q–T. Rubus sp. in equatorial view. Scale bars ‒ 10 µm.
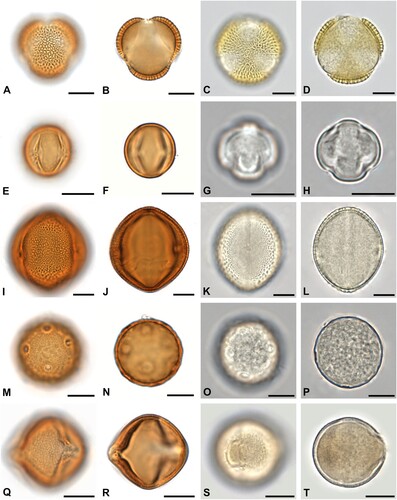
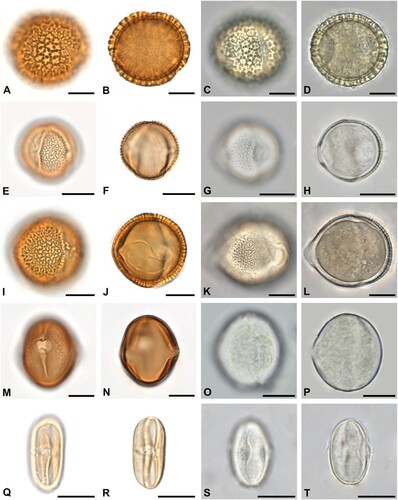
Figure 4. Some of the most abundant pollen forms in acetolysed and hydrated state. A–D. Syringa sp. in equatorial view. E–H. Sambucus-type in equatorial view. I–L. Gleditsia sp. in equatorial view. M–P. Trifolium repens-type in equatorial view. Q–T. Begonia sp. in equatorial view. Scale bars ‒ 10 µm.
Appearance and condition of pollen samples in LM
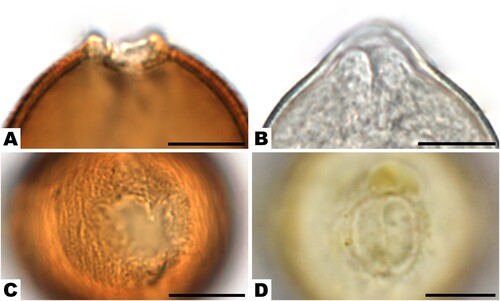
During the process of acetolysis, as expected, the cytoplast dissolved, and the pollen wall remained. It also dissolved organic debris in the sample, which left the background much cleaner and highlighted the pollen grains. The brownish staining after acetolysis increased the visibility of details in the pollen wall structure and sculpture. In some cases, the margins of the aperture could be much better observed in the acetolysed state, e.g. in Rosaceae species (, ). Another important feature of pollen grains is the aperture membrane, which can be smooth or ornamented. In some species, e.g. Aesculus hippocastanum (–), the ornamentation remained even after acetolysis, while in others, e.g. some Lamiaceae or monocots, this characteristic was in many cases lost.
Figure 5. Apertures of Rosaceae species: A, C. Prunus sp. in acetolysed state. B. Malus-type in hydrated state. D. Prunus sp. in hydrated state. Scale bars ‒ 10 µm.
In hydrated state, the pollen wall of some species was naturally coloured in a light yellow (e.g. Salix sp.; , ) or brownish (Aesculus sp.; , ) or even purple (Cirsium-type). In addition, the presence or absence of pollenkitt could only be observed in hydrated state and impacted colouring there. Pollenkitt of Asteraceae species, Prunus sp. (, ) or Helianthemum sp. was yellow, of Koelreuteria sp. brownish, and of Amorpha fruticosa orange-brown. Even within one plant family, different genera could be distinguished by natural colouring. In Rosaceae, for example, Prunus sp. (, ), appeared more yellow in colour than Malus-type (, ). Colour intensity in hydrated state also corresponded to the thickness of the wall. Pollen with very thin walls, e.g. Myosotis sp. (, ) or Begonia sp. (, ), were especially translucent.
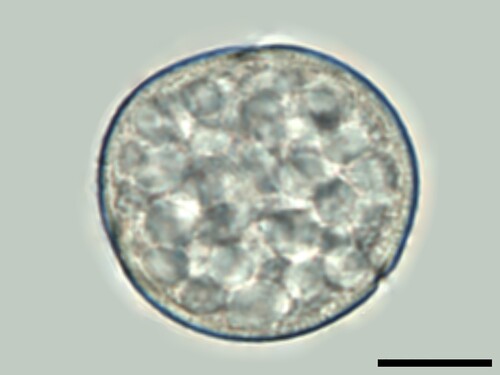
In hydrated pollen samples, the cytoplast did not dissolve. It remained within the pollen walls and slightly expanded when embedded in glycerol gelatine. The way in which the hydrated cytoplast protrudes the apertures posed a valuable tool for identification. In Rosaceae, such as Prunus sp. or Malus-type, it presented somewhat constricted at the tip (, ). In some species, also the contents of the cytoplast were a useful characteristic. Starch globules within the cytoplasm are a prominent microscopic feature in Rumex sp. ().
Figure 6. Numerous starch granules in the cytoplast of Rumex species. Scale bar ‒ 10 µm.
Comparative quantitative analyses of pollen spectra
Across all eight honey samples analysed for this study, a total of 147 pollen types were identified. A lot more pollen types were identified with the hydrated method (136 out of 147, see Supplemental Table II, compared to the acetolysed method (95 out of 147, see Supplemental Table I). The identified pollen types within all acetolysed and hydrated samples were of 69 individual plant families altogether: 68 out of 69 families with the hydrated method, compared to 47 out of 69 families with the acetolysed method. In the honey sample from Munich, a total of 52 plant families was identified (see Supplemental Table III), with 48 out of 52 (hydrated method), compared to 40 out of 52 (acetolysed method). Across all samples, the families comprising the most identified taxa were Asteraceae (12), Fabaceae (10), Rosaceae (8), Boraginaceae (6), and Sapindaceae (5).
Within the honey from eight cities, the most abundant pollen type was Castanea sativa (657 pollen grains or 16.43% in total when acetolysed, compared to 553 or 13.83% when hydrated). Also, Acer sp. and Prunus sp. were among the most abundant, regardless of the method: Prunus sp. with 378 pollen grains (9.45%) when acetolysed and 237 (5.93%) when hydrated; Acer sp. with 356 pollen grains (8.90%) when acetolysed and 319 (7.98%) when hydrated. With a total of 263 pollen grains (6.58%) across all eight pollen counts, Myosotis sp. was the third most abundant pollen type in the hydrated samples, whereas only 19th in the acetolysed samples (39 grains or 0.98%).
In the second part of the study, the honey sample from Munich was prepared and analysed for five consecutive times on different days by the same person, in order to evaluate possible bias caused by the researcher. Also here, the plant families comprising the most pollen types were Asteraceae (7), Fabaceae (7), Rosaceae (7), and Boraginaceae (5). Notable differences between the repetitions of each method occurred in the Brassicaceae and Fabaceae families, as well as in some other pollen types. ‘Brassicaceae’ pollen ranged from 1.6–20% (acetolysed) and 5.6–6% (hydrated). Brassica sp. pollen ranged from 0–4.2% (acetolysed) and 5.2–6.2% (hydrated). Across the acetolysed repetitions, Trifolium repens-type could only be detected in one sample, while ‘Fabaceae’ pollen was present in all five samples. However, in the hydrated repetitions, Trifolium repens-type was present in all and ‘Fabaceae’ pollen in none. Aesculus hippocastanum ranged from 4.6–10.8% (acetolysed) and 4.2–7% (hydrated), Castanea sativa from 3.4–7.2% (acetolysed) and 3.4–4% (hydrated), and Tilia sp. from 4.4–13% (acetolysed) and 5.4–8.2% (hydrated).
Discussion
Across all honey samples analysed for this study, a remarkable difference in identified pollen types between the acetolysed and hydrated method could be observed. Around a third more pollen types were identified in the hydrated samples. This is due to the overall higher quantity of pollen which remained of the honey material after preparation and despite using only approximately half the volume of suspended pollen (equal to 5 g instead of 10 g) for the analysed object slide. Multiple steps of washing, centrifuging, and decanting of the supernatant in the process of acetolysis probably leads to pollen being gradually washed out, reducing the chances of encountering less frequent pollen types during analysis.
An extensive study by Sodl (Citation2013), which focussed on pollen in fabrics, showed that no specific pollen taxa were lost during repeated washing steps with subsequent acetolysis. Similarly, in this study, it could not be observed that specific pollen types are lost to a larger extent in the acetolysed samples. Notable exception is Myosotis sp., where abundances varied drastically between the methods, despite careful microscopic screening. This was repeatedly observed with the several analyses of the honey sample from Munich. Pollen from Myosotis sp. is very small with less than 10 µm in size in addition to a very thin exine (Meudt Citation2016). Therefore, it may have been partially lost during acetolysis. It remains unclear whether this is because of the small size, or possible disintegration of the pollen grain due to the thin wall, or other factors. Other small pollen types with thin walls (e.g. Begonia sp., Buddleja sp., Cynoglossum sp., Omphalodes sp.) were present slightly more often in the hydrated method. In these taxa, differences cannot be quantified however, due to their little overall abundance in the samples. As noted by Ramalho and Kleinert-Giovannini (Citation1986), smaller pollen grains might accompany the movement of the embedding material after adding the cover glass and counting in multiple random lines across the slide is important to avoid effects of differentiated distribution. With glycerol gelatine used for both preparation methods in this study and Myosotis sp. being encountered all over the slide in the hydrated samples, this is not likely to have caused the little abundance of Myosotis pollen in the acetolysed samples.
The depth of taxonomic resolution might account for some other variances in the list of identified pollen types. Generally speaking, certain pollen types may not be distinguishable on species level and a higher taxonomic name should therefore be used (e.g. ‘Rosaceae’ or ‘Prunus-type’ instead of Prunus domestica) in order not to produce false positive results. Another way in which to describe potentially also paraphyletic groups is to assign a pollen type to an aggregate of similar looking pollen species (see Ramalho & Kleinert-Giovannini Citation1986), e.g. by calling it Sambucus-type instead of Sambucus nigra sensu stricto.
The identified taxonomic level of a pollen type might also vary with several repetitions. In this study, for example, some pollen grains were identified as Trifolium repens-type in one sample and Fabaceae in another sample. While Trifolium repens-type can be unambiguously identified with both acetolysed and hydrated methods, there are reasons why it might not be present as such in the result list of some samples. The sample itself might contain obstructions to the visibility of important pollen characteristics, making an identification down to a low taxonomic level unfeasible.
Similarly, pollen grains might be identified as Brassica sp. in one sample and Brassicaceae in another. A major characteristic of Brassica sp. grains in hydrated condition is the typical/average size of 26‒28 µm in equatorial and/or polar diameter (see e.g. PalDat Citation2000 onwards; Stebler Citation2023) – a characteristic, which is not recommended to rely on in acetolysed samples, because pollen grains tend to slightly shrink during acetolysis (Halbritter et al. Citation2018; Koelzer et al. Citation2023). Hence, in acetolysed samples, they might be included in the Brassicaceae pollen type.
Although the multiple repetitions of a method generally produced comparable results, a distinct pollen type may be present in an unusually high abundance in one individual sample. For example, the high amount of Tilia sp. pollen (13%) in one of the acetolysed repetitions (1M_Muen_acet) may be due to a clump of Tilia sp. pollen grains in the portion of the sample that was analysed for this repetition. In hydrated samples, pollen grains of all types can potentially stick together. They may do so because of gluey pollenkitt, remaining sugar, prominent surface sculpturing, or as relic of the tetrad stage (Hesse Citation1981). In the acetolysed method, this is much rarer. Here, clumping may occur due to defects of the anther.
Choosing a preparation method
Both preparation methods have unique advantages and disadvantages when utilised for pollen analysis. While it is relatively quick and easy to prepare a hydrated sample, it is more time consuming and requires a laboratory equipped with necessary chemicals and fume hood to perform acetolysis (Halbritter et al. Citation2018). The availability of technical equipment including a light microscope with sufficient magnification (preferably a 60× objective lens for acetolysed samples and a 100× objective lens in oil for hydrated samples) and a digital camera is highly recommended for both methods. When using a smaller magnification, e.g. a 40× objective lens, certain characteristics of pollen grains cannot be seen and potential diagnostic information is lost.
For the analysis of a sample with high content of organic sediments such as yeasts, spores, algae, or parts of organisms, it may be beneficial to perform acetolysis for better visibility of pollen grains. Sometimes though, the presence or absence of certain non-pollen organic material can be important for the tracing of botanical and geographical origin as well as potential alterations and/or adulterations of honey. For example, to determine honeydew honey microscopically (Straka Citation1975; Beckh & Camps Citation2009), acetolysis would largely remove possible indicators.
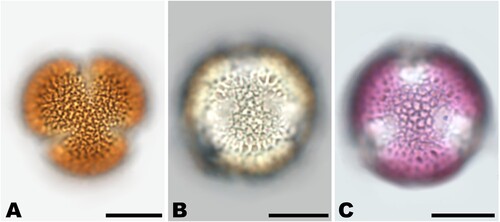
One advantage of acetolysed pollen is the staining of the pollen wall, which increases the visibility of surface details (e.g. Lieux Citation1980; Halbritter et al. Citation2018), see Brassicaceae grain in . The staining of the pollen wall is darker, the more sporopollenin is contained in its structure, which usually corresponds to the thickness of the exine layer in the pollen wall, e.g. Prunus sp. (, ), Tilia sp. (, ), Parthenocissus sp. (, ). After some months though, the brownish staining of the embedded acetolysed samples might fade, which should be considered especially when photographic documentation is desired. In hydrated samples, staining is not required but may be an asset. It can be achieved with agents such as fuchsine (aniline red), see the database Pollen-Wiki (Stebler Citation2023), and compared to the unstained pollen grain (). The dye can be mixed directly into the embedding material, as in Kaiser’s glycerol gelatine (Mulisch & Welsch Citation2015). The quality of embedded hydrated samples will allow proper pollen type identification for years.
Figure 7. Brassicaceae pollen grain acetolysed (A), hydrated unstained (B) and hydrated stained with fuchsine (C). Scale bars ‒ 10 µm. Source: Karen Koelzer.
The choice of a preparation method might also affect the shape in which pollen grains appear. During acetolysis, the cytoplast and aperture membrane is destroyed, while in the hydrated state, the cytoplast usually swells. Some pollen types hence appear spheroidal when hydrated and prolate after acetolysis, e.g. Robinia pseudoacacia or Trifolium repens-type (see ). Therefore, relevant reference literature should be used for identification, preferably referring to the same method of preparation (acetolysed or hydrated). Pollen grains may also shrink to various extent during acetolysis. When using the size for identification purposes, measuring in the hydrated state is advised and allows to compare the measurements to the references in most online databases (PalDat Citation2000 onwards; Koelzer et al. Citation2023; Stebler Citation2023).
When applying the hydrated method, the use of 5 g of honey material will usually be sufficient for the analysis of 500 pollen grains on one slide, unless it is honey known to contain little amounts of pollen, such as for example unifloral Robinia honey (von der Ohe et al. Citation2004). With this volume, the pollen will also be spread out in a comfortable way in order to be able to identify and picture each grain individually while allowing for a continuous flow of counting.
The overall availability of literature should as well be considered when choosing a method. Literature can be limited in certain geographic regions and/or to certain methods. Gadbin (Citation1979), who analysed honey from Chad Republic, could identify more pollen types acetolysed (15), compared to the hydrated method (12). He recommended acetolysis for honey from the central African region, firstly, because the pollen wall details are important for identification when the floral resources are not well known, and secondly, because of more available reference literature with the acetolysed method on the melliferous flora of the region. Similarly, Lieux (Citation1980) recommended acetolysis for honey pollen analysis in the south-eastern United States, where the few palynologists at that time were trained in acetolysis. As one of the first honey researchers in the United States, she herself prepared more than 200 reference samples of foraging plants in Louisiana by using acetolysis (Lieux Citation1969). She also mentions the potential of shared reference literature with other areas of palynology (e.g. palaeobotany) in regions with less advanced palynological knowledge and limited resources (Lieux Citation1980). Countries, where acetolysis continues to be commonly used for the analysis of geographical and botanical origin are India (e.g. Bhargava et al. Citation2009; Ponnuchamy et al. Citation2014), and Nigeria (e.g. Durugbo et al. Citation2020; Ikegbunam et al. Citation2022). Plant species that are restricted to these regions may be easier to identify when using the same method likewise.
Lastly, the choice of preparation methods may also be considered in regard to potential further analyses with additional methods. With the cell content and intine dissolved, acetolysed pollen samples can still be processed for SEM (scanning electron microscopy) as well as TEM (transmission electron microscopy) analysis of the exine pollen wall. Unstained hydrated samples allow for more follow-up methods: iodine staining to detect starch and carmine staining to determine the number of nuclei (Halbritter et al. Citation2018), as well as electron microscopy for more detailed analyses of pollen wall structure/sculpture and cell organelles within the cytoplasm. In addition, hydrated samples can potentially be further processed for DNA-analysis (as described e.g. in Bell et al. Citation2016). This might work best if the hydrated pollen sample is embedded in glycerine instead of glycerol gelatine, from which individual pollen grains may be extracted using a micromanipulator (Halbritter et al. Citation2018; Ulrich & Grímsson Citation2019).
For an elaborate comparison of acetolysed and hydrated methods, see .
Table II. Side-by-side comparison of multiple factors with the acetolysed and hydrated method
The human factor
Besides technical availability, pollen analyses may be unintentionally influenced by human errors. Possible factors of subjectivity may be the researcher’s level of experience with using either the acetolysed or the hydrated method, the palynologist’s condition and mood on the day of analysis, their confidence, time pressure through strict deadlines or limited time until closing hours, splitting the counting across several days, disruptions while counting, or increasing personal identification abilities within a row of multiple samples (e.g. Galán et al. Citation2014). However, colour vision deficiencies, such as described for pollen pellet sorting in Hornby et al. (Citation2022), are a neglectable factor in microscopic analyses, since pollen grains are identified with their more prominent structural and sculptural characteristics rather than solely by colour.
As a self-critical approach to test for potential other biases than preparation methods during counting out pollen samples, the second part of this study included multiple repetitive analyses of the same honey. Differences between the acetolysed and hydrated method were reproducible in regards to pollen diversity as well as specific taxa (e.g. Myosotis sp.). Differences within the acetolysed and the hydrated group, respectively, were neglectable and did not have an effect on the overall integrity of results. The number of identified pollen taxa and the percentages of the most important pollen types were comparable.
Relevance of LM analysis in times of DNA-metabarcoding
Our study shows that both the acetolysed and the hydrated methods are technically suitable for the qualitative and quantitative analyses of pollen in honey. Despite the larger pollen spectrum identified with the hydrated method, there are still limits to taxonomic resolution and the number of identified taxa. Such limitations may be overcome by promising new methods such as DNA metabarcoding. DNA metabarcoding has been used to analyse and quantify the full pollen spectrum in honey (e.g. Smart et al. Citation2017; Noël et al. Citation2023). These studies showed strong, yet taxa-specific, concordance to LM results. DNA metabarcoding may complement LM methods as it potentially enables a higher taxonomic resolution for pollen types that can only be identified collectively to family level by LM, such as Poaceae, Pinaceae, or Cupressaceae (Leontidou et al. Citation2021). Moreover, it was shown to surpass LM when it comes to taxa richness, especially when taxa were present in little abundances (Smart et al. Citation2017; Polling et al. Citation2022). However, limitations concerning the reliable identification of certain plant taxa have been observed with DNA metabarcoding as well. These are mostly due to the choice of primer system in combination with the available reference databases. Another limitation is the quantification of pollen abundances. Some studies have quantitatively compared the relative number of amplicon reads from DNA metabarcoding to that of microscopic pollen counts. Effects of pollen morphology (Swenson & Gemeinholzer Citation2021) and amplification biases through primer mismatch (Bänsch et al. Citation2020; Leontidou et al. Citation2021; Polling et al. Citation2022) may be a common cause for large proportions of unexplained abundance variations. Hence, at the current state of knowledge, verification by LM and botanical plausibility checks are vital to detect false positive results at the stage of taxon assignment. Due to the current technical limitations observed in DNA metabarcoding, it cannot fully replace LM analyses. Here, especially the hydrated method remains the method of choice for reliable and, in general, reproducible quantitative melissopalynological data.
Conclusions
Both the hydrated and acetolysed methods of preparation for the pollen analysis of honey have their unique advantages. In order to identify pollen types correctly applying either method, it needs a high degree of experience, access to reference literature, and awareness of the limitations. For most uses and quality requirements, analysing the sample with either method (acetolysed/hydrated) is sufficient. The reproducibility could be shown through multiple repetitions with acetolysed as well as hydrated material. Remarkably, the hydrated method revealed an overall higher number of taxa on the object slide in total and within 500 counted pollen grains.
For experienced palynologists, pollen analysis of a honey sample takes less than a day of time, from preparation to the list of results. LM methods, especially hydrated samples in glycerol gelatine, require a minimum of costs and may be wider accessible for researchers, students and interested apiarists alike, compared to acetolysis and newer techniques such as DNA metabarcoding.
For going from experimental research to the implementation of novel methods in routine analysis on the official scale, further extensive validation of methods is essential. Here, LM (acetolysis or hydration) functions as a backbone for method development and needs to be conducted with diligence and sufficient photographic documentation. So far, melissopalynology needs the LM techniques and cannot be fully replaced by DNA-methods. However, the latter could be a very useful addition to future research.
Supplemental Material Table III
Download MS Word (71.9 KB)Supplemental Material Table II
Download MS Word (65.8 KB)Supplemental Material Table I
Download MS Word (55.2 KB)Acknowledgements
The authors kindly thank all apiarists who contributed honey samples for this study: Matthias Kopetzky and Adriana Traumüller (Bezirksimkerei Wien), Dietmar Niessner (Bio-Imkerei Bienenschule Wien), Robert Andres (Innsbruck), Bernhard Rihl and David Hintersteiner (LinzerBiene), Daniel Pfeifenberger (Bienenlieb, Salzburg), Winfrid Dareb (City Imker Klagenfurt), Gorazd Trušnovec (Urbani čebelar, Ljubljana), Petra Jezekova (CEEV Živica, Bratislava), and Bernd Dany (Dany’s Bienen & Honig, Munich).
Disclosure statement
No potential conflict of interest was reported by the author(s).
Supplemental data
Supplemental material for this article can be accessed online at https://doi.org/10.1080/00173134.2024.2348651.
Additional information
Funding
References
- Armbruster L, Jacobs J. 1934–1935. Pollenformen und Honigherkunft-Bestimmung. Berlin-Zehlendorf: Verlag des Archivs für Bienenkunde.
- Bänsch S, Tscharntke T, Wünschiers R, Netter L, Brenig B, Gabriel D, Westphal C. 2020. Using ITS2 metabarcoding and microscopy to analyse shifts in pollen diets of honey bees and bumble bees along a mass-flowering crop gradient. Molecular Ecology 29: 5003–5018. doi:10.1111/mec.15675.
- Bastl K, Berger U, Kmenta M, Weber M. 2017. Is there an advantage to staying indoors for pollen allergy sufferers? Composition and quantitative aspects of the indoor pollen spectrum. Building and Environment 123: 78–87. doi:10.1016/j.buildenv.2017.06.040.
- Beckh G, Camps G. 2009. New specifications for unifloral honey. Deutsche Lebensmittel-Rundschau 105: 105–110.
- Bell KL, de Vere N, Keller A, Richardson RT, Gous A, Burgess KS, Brosi BJ. 2016. Pollen DNA barcoding: current applications and future prospects. Genome 59: 629–640. doi:10.1139/gen-2015-0200.
- Beug HJ. 2004. Leitfaden der Pollenbestimmung für Mitteleuropa und angrenzende Gebiete. Pfeil, München.
- Bhargava HR, Jyothi JVA, Bhushanam M, Surendra NS. 2009. Pollen analysis of Apis honey, Karnataka, India. Apiacta 44: 14–19.
- Chevalier M, Davis BAS, Heiri O, Seppä H, Chase BM, Gajewski K, Lacourse T, Telford RJ, Finsinger W, Guiot J, Kühl N, Maezumi SY, Tipton JR, Carter VA, Brussel T, Phelps LN, Dawson A, Zanon M, Vallé F, Nolan C, Mauri A, de Vernal A, Izumi K, Holmström L, Marsicek J, Goring S, Sommer PS, Chaput M, Kupriyanov D. 2020. Pollen-based climate reconstruction techniques for late Quaternary studies. Earth-Science Reviews 210: 103384. doi:10.1016/j.earscirev.2020.103384.
- DIN (Deutsches Institut für Normung). 2002. Untersuchung von Honig - Bestimmung der relative Pollenhäufigkeit, DIN 10760: 2002-05, Berlin, http://www.din.de, http://www.beuth.de.
- Durán-Escalante KC, Ortiz-Díaz JJ, Pinzón-Esquivel JP, Gálvez-Mariscal MA, Alfaro-Bates RG. 2023. Palynological characterisation of palm honey (Sabal yapa) produced in Yucatan (Mexico). Grana 62: 133–145. doi:10.1080/00173134.2023.2178264.
- Durugbo EU, Daramola GG, Abazuh DU, Odim MMO. 2020. Pollen characterization and physicochemical analysis of six Nigerian honey samples; test for authenticity. Turkish Journal of Agriculture – Food Science and Technology 8: 1863–1870. doi:10.24925/turjaf.v8i9.1863-1870.3477.
- Erdtman G. 1943. An introduction to pollen analysis. Waltham, MA: Chronica Botanica Company.
- Erdtman G. 1960. The acetolysis method – a revised description. Svensk Botanisk Tidskrift 54: 561–564.
- Faegri K, Iversen J. 1975. Textbook of pollen analysis. Copenhagen: Munksgaard.
- Gadbin C. 1979. L’intérêt de l’acétolyse en mélissopalynologie. Apidologie 10: 23–28. doi:10.1051/apido:19790103.
- Galán C, Smith M, Thibaudon M, Frenguelli G, Oteros J, Gehrig R, Berger U, Clot B, Brandao R, EAS QC Woroking Group. 2014. Pollen monitoring: Minimum requirements and reproducibility of analysis. Aerobiologia 30: 385–395. doi:10.1007/s10453-014-9335-5.
- Geier C, Bouchal JM, Ulrich S, Uhl D, Wappler T, Wedmann S, Zetter R, Grímsson F. 2023. Collecting in situ/adhered pollen from fossil compressed angiosperm flowers. Review of Palaeobotany and Palynology 310: 104831. doi:10.1016/j.revpalbo.2022.104831.
- Grímsson F, Bouchal JM, Xafis A, Zetter R. 2020. Combined LM and SEM study of the middle Miocene (Sarmatian) palynoflora from the Lavanttal Basin, Austria: Part V. Magnoliophyta 3 – Myrtales to Ericales. Grana 59: 127–193. doi:10.1080/00173134.2019.1696400.
- Halbritter H, Ulrich S, Grimsson F, Weber M, Zetter R, Hesse M, Buchner R, Svojtka M, Frosch-Radivo A. 2018. Illustrated pollen terminology. New York: Springer-Verlag.
- Hesse M. 1981. The fine structure of the exine in relation to the stickiness of angiosperm pollen. Review of Palaeobotany and Palynology 35: 81–92. doi:10.1016/0034-6667(81)90015-4.
- Hesse M, Waha M. 1989. A new look at the acetolysis method. Plant Systematics and Evolution 163: 147–152. doi:10.1007/BF00936510.
- Hornby S, Benn J, Vinkenoog R, Goldberg S, Pound MJ. 2022. Methods in melissopalynology: colour determination of pollen pellets for colour vision deficient individuals. Palynology 46: 1–7. doi:10.1080/01916122.2022.2062476.
- Ikegbunam NC, Nweze NO, Walter OJ, Njokuocha RC, Agwu COC. 2022. Melissopalynological characterization of honey samples from southeastern, Nigeria. Turkish Journal of Agriculture - Food Science and Technology 10: 203–210. doi:10.24925/turjaf.v10i2.203-210.4537.
- Koelzer K, Weber M, Ulrich S. 2023. Integration of the pollen database PONET into PalDat with new features for light microscopy. Grana 62: 221–227. doi:10.1080/00173134.2023.2256328.
- Leontidou K, Vokou D, Sandionigi A, Bruno A, Lazarina M, De Groeve J, Li M, Varotto C, Girardi M, Casiraghi M, Cristofori A. 2021. Plant biodiversity assessment through pollen DNA metabarcoding in Natura 2000 habitats (Italian Alps). Scientific Reports 11: 18226. doi:10.1038/s41598-021-97619-3.
- Lieux MEH. 1969. A palynological investigation of Louisiana honeys. PhD Thesis. Louisiana State University, Baton Rouge, LA.
- Lieux MEH. 1980. Acetolysis applied to microscopical honey analysis. Grana 19: 57–61. doi:10.1080/00173138009424988.
- Louveaux J, Maurizio A, Vorwohl G. 1970. Internationale Kommission für Bienenbotanik: Methodik der Melissopalynologie. Apidologie 1: 193–209. doi:10.1051/apido:19700205.
- Louveaux J, Maurizio A, Vorwohl G. 1978. Methods of melissopalynology. Bee World 59: 139–157. doi:10.1080/0005772X.1978.11097714.
- Maurizio A. 1975. Microscopy of honey. In: Crane E, ed. Honey: A comprehensive survey, 240–257. London: Heinemann, in cooperation with the International Bee Research Association.
- Meudt HM. 2016. Pollen morphology and its taxonomic utility in the Southern Hemisphere bracteate-prostrate forget-me-nots (Myosotis, Boraginaceae). New Zealand Journal of Botany 54: 475–497. doi:10.1080/0028825X.2016.1229343.
- Mildenhall DC, Wiltshire PEJ, Bryant VM. 2006. Forensic palynology: Why do it and how it works. Forensic Science International 163: 163–172. doi:10.1016/j.forsciint.2006.07.012.
- Mulisch M, Welsch U., eds. 2015. Romeis – Mikroskopische Technik. Heidelberg: Springer Spektrum.
- Noël G, Mestrez A, Lejeune P, Francis F, Kawai J, Miwa M, Uehara K, Nagase A. 2023. Pollen meta-barcoding reveals different community structures of foraged plants by honeybees (Apis mellifera L.) along space-time gradient in Japan. Urban Forestry & Urban Greening 79: 127794. doi:10.1016/j.ufug.2022.127794.
- Oteros J, Galán C, Alcázar P, Domínguez-Vilches E. 2013. Quality control in bio-monitoring networks. Spanish aerobiology network. Science of The Total Environment 443: 559–565. doi:10.1016/j.scitotenv.2012.11.040.
- PalDat – a palynological database. 2000 onwards. http://www.paldat.org; accessed 31 October 2023.
- Polling M, Melati S, de Weger LA, Speksnijder AGCL, Koenders MJF, de Boer H, Gravendeel B. 2022. DNA metabarcoding using nrITS2 provides highly qualitative and quantitative results for airborne pollen monitoring. Science of the Total Environment 806: 150468. doi:10.1016/j.scitotenv.2021.150468.
- Ponnuchamy R, Bonhomme V, Prasad S, Das L, Patel P. 2014. Honey pollen: Using melissopalynology to understand foraging preferences of bees. Tropical South India. PLoS One 9(7): e101618. doi:10.1371/journal.pone.0101618.
- Ramalho M, Kleinert-Giovannini A. 1986. Some aspects of the utilization of pollen analysis in ecological research. Apidologie 17: 159–174. doi:10.1051/apido:19860207.
- Reille M. 1992. Pollen et spores d'europe et d'afrique du nord. Marseille: Laboratoire de Botanique historique et Palynologie.
- Sawyer R. 1988. Honey identification. Cardiff: Academic Press.
- Smart MD, Cornman RD, Iwanowicz DD, McDermott-Kubeczko M, Pettis JS, Spivak MS, Otto CRV. 2017. A comparison of honey bee-collected pollen from working agricultural lands using light microscopy and ITS metabarcoding. Environmental Entomology 46: 38–49.
- Sodl B. 2013. Palynologische Untersuchungen an ausgewählten Textilien aus forensischer Sicht. Diploma Thesis, University of Vienna, Vienna.
- Stebler T. 2023. Pollen Atlas. Pollen-Wiki. https://pollen.tstebler.ch/MediaWiki/index.php?title=Pollenatlas; accessed 31 October 2023.
- Straka H. 1975. Pollen- und Sporenkunde. Eine Einführung in die Palynologie. Stuttgart: Gustav Fischer Verlag.
- Swenson SJ, Gemeinholzer B. 2021. Testing the effect of pollen exine rupture on metabarcoding with Illumina sequencing. PLoS One 16(2): e0245611. doi:10.1371/journal.pone.0245611.
- Ulrich S, Grímsson F. 2019. The single-grain method: adding TEM to the equation. Grana 59: 44–57. doi:10.1080/00173134.2019.1666915.
- von der Ohe W, Persano Oddo L, Piana ML, Morlot M, Martin P. 2004. Harmonized methods of melissopalynology. Apidologie 35: 18–25. doi:10.1051/apido:2004050.
- Vorwohl G. 1995. Möglichkeiten und Grenzen der mikroskopischen Honiguntersuchung. Bienenvater 116: 276–283.
- Weber M, Ulrich S. 2016. Forensic palynology: How pollen in dry grass can link to a crime scene. In: Kars H, van den Eikel L, eds. Soil in criminal and environmental forensics, 15–23. Cham: Springer International Publishing.