
Abstract
Geometry of the Top Basement Unconformity (TBU) west of the Alpine Fault has been reconstructed through a set of cross-sections linking surface and subsurface geology. Onshore, the TBU shows tectonic relief of several kilometres between antiformal pop-ups and synformal depressions in contrast with a smoother topography offshore. This geometry arises from reverse slip on sets of north–south to NNE–SSW faults, mostly dipping 50–66° both west and east, that control folding of the TBU and overlying cover sequence. Some of these faults are inherited Upper Cretaceous–Palaeogene normal faults that displaced the TBU during the extensional phases and were later reactivated as reverse faults under compression, whereas others appear to be newly propagated Neogene reverse faults. The faults that deform the TBU have vertical displacements of 3–5 km and lengths of >150 km, and have the potential of being reactivated in the present stress field. Currently active faults comprise a set of blind reverse faults that propagate upsection from pre-existing extensional fault fabric in the basement, imposing a short-wavelength undulation on the TBU.
Introduction
Intracontinental earthquakes arise from the formation and reactivation of faults within the prevailing stress field over depth ranges commonly ≤ 30 km (Nazareth & Hauksson Citation2004). Large earthquakes tend to nucleate within crystalline basement assemblages (e.g. Jackson et al. Citation2008) that possess strong compositional and mechanical heterogeneities acquired during long histories of superimposed deformation, burial and exhumation.
The inherent complexity of basement fault networks, coupled with the lack of direct structural observations, account for many seismic sources that only become recognised after their rupture and propagation to shallow depth (e.g. Stein & Ekström Citation1992). Identification of active faults for hazard maps relies principally on historical rupture and/or repeated fault activity recorded by deformed Quaternary markers and geomorphic evidence (Stafford et al. Citation2008; Stirling et al. Citation2012). However, in many cases the complex hierarchy of faulting at depth remains unresolved. Factors inhibiting detection of basement faults include: (1) discontinuous fault segments at shallow depth converging down-dip into a single, larger structure (Walsh et al. Citation2003); (2) out-of-plane up-dip growth of faults from high competence basement into low-competence cover units, with localisation of detachments and changes in orientation and dip of newly propagating fault segments relative to the deeper faults (Ghisetti & Sibson Citation2006); (3) ‘blind’ faults obscured by young cover sequences (Shaw & Suppe Citation1996); and (4) recurrence time of large earthquakes on buried faults spanning intervals up to tens of thousands of years (Wallace Citation1984). The 2010–2011 Canterbury seismic sequence in the South Island of New Zealand (cf. Campbell et al. Citation2012; Quigley et al. Citation2012; Sibson et al. Citation2012) illustrates this problem, demonstrating the vulnerability of infrastructure built above unrecognised, buried basement faults that reactivate and propagate to the surface through a complex system of interlinked breaks during an intense – although geologically short-lived and possibly infrequent – seismic crisis.
The gap between geophysical parameters describing the seismic sources and geologically identified deformation on a given set of faults is rarely completely filled (e.g. Brune & Allen Citation1967; Wang Citation2002). In most cases it is only possible to infer the location, geometry and mechanisms of seismogenic faults by combining surface data with seismic reflection profiles and historical earthquakes.
This paper analyses the Top Basement Unconformity (TBU, identified as the surface between metamorphic and igneous units and overlying sedimentary cover sequence) in the West Coast region of the South Island of New Zealand to highlight fault architecture within the seismogenic domain. We define the extent, geometry and mechanisms of basement-penetrating faults that have the potential of being reactivated in the present stress field in addition to the previously identified active faults (Stirling et al. Citation2012).
The selected area provides a good case history for this analysis, given: (1) the presence and regional extent of faults that uplift emergent basement blocks relative to adjoining sedimentary basins, where the TBU is buried beneath 5–8 km thick sequences of Upper Cretaceous, Palaeogene and Neogene sediments; (2) reverse-slip reactivation of inherited normal faults (Bishop & Buchanan Citation1995; Ghisetti & Sibson Citation2006) in large historical earthquakes (e.g. 1929, Mw7.8 Buller earthquake; 1968, Mw7.1 Inangahua earthquake; 1962, Mw5.9 Westport earthquakes; 1991, Mw5.8 and Mw6 Hawk's Crag earthquakes, cf. Adams & Le Fort Citation1963; Anderson et al. Citation1993, Citation1994; Doser et al. Citation1999); and (3) available coverage (http://www.nzpam.govt.nz) of offshore seismic reflection surveys (of varying quality and date of acquisition) tied to exploration wells, enabling the offshore and onshore regions to be linked and the TBU mapped down to 5 km b.s.l.
Our analysis shows the regionally distributed faulting and folding of the TBU, associated with north–south- to NNE–SSW-trending faults dipping both east and west. The faults have a cross-strike spacing averaging 15–30 km, lateral dimensions compatible with penetration through the seismogenic crust and have given rise to several kilometres of vertical displacement of the TBU during multiple episodes of Neogene reverse faulting. This fault system is largely composed of inherited crustal discontinuities (terrane boundaries and Late Cretaceous–Palaeogene normal faults) that include previously recognised seismogenic active faults (Stirling et al. Citation2012), as well as blind faults that control folding of the TBU and cover sequence and have the potential to be reactivated in the present compressional stress field (Sibson et al. Citation2012; Townend et al. Citation2012).
Regional tectonic setting of the basement
West of the Alpine Fault () the upper crustal basement rocks of the Australian Plate are remnants of the southern Gondwana margin. They comprise Palaeozoic collisional assemblages that started to be rifted away from Australia and Antarctica in a sequence of intra-continental extensional episodes beginning at c. 110 Ma (late Early Cretaceous) followed by seafloor spreading in the Tasman Sea in the Late Cretaceous, from c. 90–80 to 60 Ma (Bradshaw Citation1989; Laird & Bradshaw Citation2004).
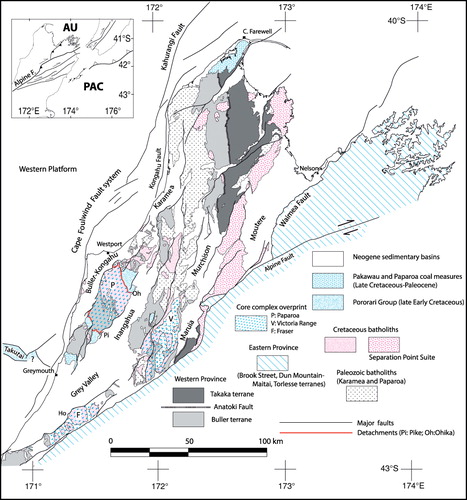
In the West Coast of the South Island the westernmost units () are the Ordovician metamorphosed greywackes of the Buller Terrane (continental margin foreland), intruded by Devonian–Carboniferous granites of the Karamea and Paparoa batholiths (Mortimer Citation2004). To the east, the Buller Terrane is in tectonic contact with the complex assemblage of units of the Takaka Terrane, consisting of north-trending faulted slices of Middle Cambrian–Early Devonian siliciclastic, carbonate and volcanic rocks (intra-oceanic island arc to passive margin) with metamorphic overprint. The boundary between the Buller and Takaka terranes is the north–south-oriented Anatoki Fault (), moderately east-dipping in the north to subvertical in the south (Jongens Citation2006). Further east, the contact between the Takaka Terrane and the Permian–Middle Triassic subduction assemblages of the Brook Street Terrane (in the hanging wall of the Waimea Fault) is obliterated by the Triassic–Lower Cretaceous granites of the Separation Point suite. These intrusions belong to the Carboniferous–Lower Cretaceous Median Batholith (subduction-related magmatic arc originally developed at the Gondwana margin; Tulloch & Kimbrough Citation2003) and were affected by a late Early Cretaceous metamorphic overprint. The contact is further masked by Cenozoic faulting and thick Neogene sedimentary cover within the Moutere Basin.
Progressive extensional disruption of the Gondwana margin is recorded in the Buller Terrane by intrusion of the younger (110–82 Ma) granites of the Hohonu batholith (Waight et al. Citation1998), coeval with the earliest rifting episodes along the Gondwana margin. The earliest stages of lithospheric extension are recorded by the tectono-stratigraphic and igneous assemblages of late Lower Cretaceous metamorphic core complexes (110–90 Ma) exposed in the Paparoa Range and, further east, in the Victoria Range and Fraser Complex (Tulloch & Kimbrough Citation1989; Spell et al. Citation2000; ). In the Paparoa Range, low-angle east–west mylonitic shear zones with normal sense of shear and NNE-oriented stretching lineations (Pike Detachment to the south and Ohika Detachment to the north; ) separate amphibolite facies gneisses and igneous rocks in the lower plate from lower greenschist facies metasediments in the upper plate. These rocks are overlain by the rhyolitic Stitt Tuffs (c. 101 Ma) and latest Lower Cretaceous terrestrial breccias and conglomerates of the Pororari Group. Other WNW–ESE-oriented grabens attributed to the same deformation event are preserved in offshore regions largely unaffected by Cenozoic shortening and include the Takutai graben west of Greymouth (), possibly infilled by sediments of the Pororari Group (Bishop Citation1992).
The Late Cretaceous rifting events in the Tasman Sea, coeval with seafloor spreading and separation of the Zealandia continental crust from the eastern Gondwana margin, were associated with a substantial change in the orientation of tectonic fabric (Laird Citation1993), possibly connected to the propagation of a major transform system between the Tasman and Southern ocean spreading centres. During this stage, basement extension was controlled by sets of north-trending en échelon grabens filled with Upper Cretaceous–Paleocene terrestrial to marine deposits, continuous from the western coast of the South Island (Paparoa, Pakawau Basin) to the Taranaki Basin (Nathan et al. Citation1986).
Following a period of relative tectonic quiescence, a new extensional plate boundary propagated north from the Emerald fracture zone (Australia–Antarctica spreading centre) from 45 to 30 Ma (Kamp Citation1986; Lamarche et al. Citation1997; Sutherland et al. Citation2000) with the formation of oceanic crust south of New Zealand and development of a north-trending belt of intra-continental rift basins within the present South Island West Coast (Kamp Citation1986). The faults bounding these basins control variations in facies and thickness of the Palaeogene units (e.g. in the Inangahua, Murchison, Buller–Kongahu basins, cf. Nathan et al. Citation1986) in accord with the persistent activity of north–south to NNE–SSW normal faults and reactivated Late Cretaceous faults during this time interval.
The inherited fabric and heterogeneities acquired by basement rocks over the whole range of lithospheric depth and during a long-lasting series of tectonic and magmatic events likely played a mechanical role in shaping the geometry of the Alpine Fault right-lateral and transpressive plate boundary (Sutherland et al. Citation2000). This fault propagated across the New Zealand continent after 25 Ma (early Miocene), as a consequence of a change in Australia–Pacific plate motion (cf. Kamp Citation1986).
West of the Alpine Fault, shortening was accommodated by reactivation with reverse mechanisms of the north–south and NNE–SSW Late Cretaceous and Palaeogene normal faults (‘compressional inversion’), folding of the cover sequence and propagation of newly formed, favourably oriented, blind thrusts (Ghisetti & Sibson Citation2006). Repeated pulses of reactivation have resulted in uplift and partial or total denudation of the synrift terrestrial-marine sequences above basement pop-ups and concurrent development of sedimentary depocentres filled with syncompressional Miocene–Quaternary clastic units. The finite shortening associated with the latest deformation is reflected by the increase in average crustal thickness from 15–25 km offshore to 30–40 km west of the Alpine Fault (Eberhart-Phillips & Reyners Citation1997; Grobys et al. Citation2008).
Structural map of the Top Basement Unconformity (TBU)
The regional marker used in this study is the Top Basement Unconformity (TBU), defined as the surface that separates metamorphic and igneous units (the Buller and Takaka terranes together with Palaeozoic and Mesozoic intrusive suites; see ) from the overlying sedimentary cover. This surface is diachronous and coincides with the basal unconformity of the late Lower Cretaceous and Upper Cretaceous–Paleocene synrift deposits at a few localities and, more generally, with the unconformity at the base of the Palaeogene rift sequence. The sediment–basement contact is not preserved in areas where all sedimentary cover has been removed by erosion or, possibly, never deposited.
The units of the two Cretaceous rift stages (late Lower Cretaceous Pororari Group and Upper Cretaceous–Paleocene Paparoa coal measures) were deposited in high-energy environments (fan deltas, debris flows, high-gradient rivers transporting coarse material into lacustrine basins) within deep fault-bounded terrestrial basins filled with up to 2 km of sediments (Laird & Bradshaw Citation2004). Pockets of synrift deposits are preserved in the everted grabens (Wellman Citation1949; Kamp et al. Citation1996), uplifted by Neogene compressional inversion of their bounding normal faults (Bishop & Buchanan Citation1995; Ghisetti & Sibson Citation2006). In contrast, the units of the later extensional phases (e.g. Eocene Brunner coal measures) were deposited on a more subdued topography (river floodplains, lacustrine basins, lagoons and coastal plains) within slowly subsiding crustal blocks. The transgression of these units onto the basement is marked by a low-relief erosion surface, initially cut by fluvial erosion after the 85 Ma break-up, and preserved in many regions of the South Island (Waipounamu erosion surface, LeMasurier & Landis Citation1996). This erosional surface was progressively modified and extended by marine transgression and wave-cut planation during continuous regional subsidence in the Late Eocene, with widespread drowning of the continental mass in the Oligocene (Nathan et al. Citation1986). Progressive foundering is recorded by the diachronous onlap of shallow marine Eocene deposits, overlain by Oligocene units deposited over a vast carbonate shelf and plateau (Nathan et al. Citation1986). The latter was dissected by intervening pelagic basins (filled with Oligocene calcareous turbidites) that either occupied inherited troughs or, more likely, were controlled by the continued reactivation of the earlier normal faults as indicated by the presence of proximal, mass-flow breccias with coarse basement clasts within the turbidites (Crooks & Carter Citation1976).
In the study area, the TBU has been mapped by: (1) interpretation and depth conversion (through ties to exploration wells) of a number of seismic reflection profiles from surveys CK81, EZC, EZF, DS382, P059-84, PR75-83-84-85-86, GV, WD-84-86-87, WV (all available from http://www.nzpam.govt.nz); (2) construction of 15 regional cross-sections (–) that incorporate subsurface data, geological data from published maps (Rattenbury et al. Citation1998, Citation2006; Suggate & Waight Citation1999; Nathan et al. Citation2002) and available stratigraphic columns and well logs (Wellman et al. Citation1973; Nathan et al. Citation1986; King et al. Citation1999; http://www.nzpam.govt.nz) ( and ). The TBU and the overlying cover sequence below and above the present topography are interpolated and projected using geometric ties between scattered outcrops, the thickness of units measured in stratigraphic sections and well logs.
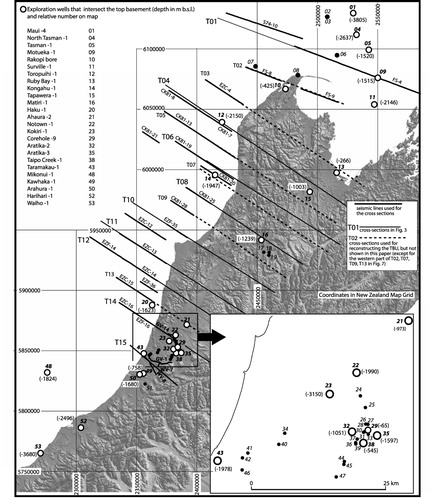
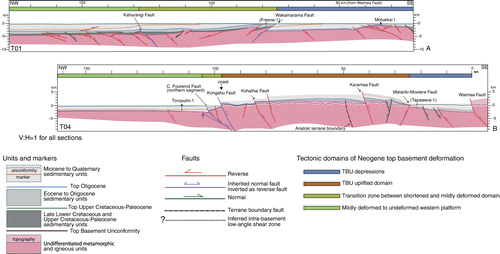
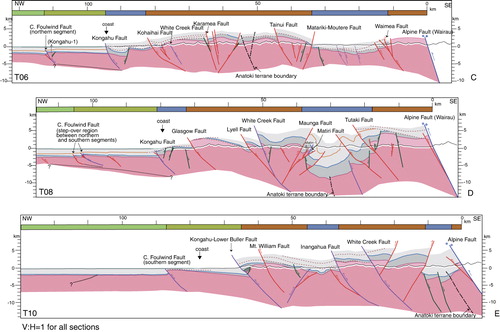
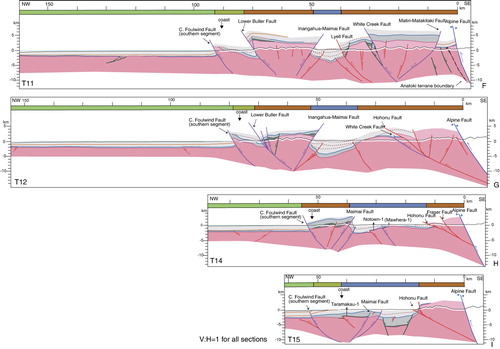
Table 1 List of exploration wells drilled in the study area (see also ) providing information on location of wells that have intersected the TBU, the lithology of intersected units and the relative depth (in metres b.s.l.). Wells that have not intersected the basement are also listed, with information on the units drilled at total depth (TD). Data compiled from http://www.nzpam.govt.nz.
Geological cross-sections
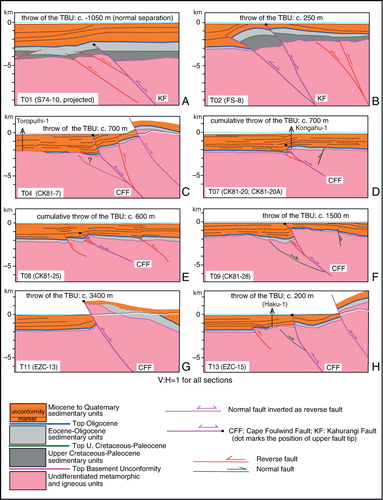
shows 9 of the 15 cross-sections used for reconstructing the deformed geometry of the TBU (). Sections are aligned with their starting points along the Alpine Fault (the Waimea Fault for the northernmost sections T01 and T04 in ).
The cross-sections highlight relevant geometric differences from north to south, but also show significant similarities in the southeast–northwest structural setting, as displayed by the subdivision into ‘tectonic domains’ superimposed on each section.
In the whole region between sections T04 and T15, the western boundary of deformation of the thrust belt relative to the mildly deformed and topographically subdued offshore ‘western platform’ coincides with two principal east-dipping segments of the Cape Foulwind Fault and the contiguous Kahurangi Fault, lying 10–20 km west of the present coastline. The coastline is close and subparallel to the southern segment of the Cape Foulwind Fault from Cape Foulwind to south of Greymouth (sections T11–T15 in ), and the amount of vertical separation of the TBU on the fault reaches maximum values of 2–3.5 km between sections T13 and T11. North of Cape Foulwind a significant step-over region (section T08 in ) separates the southern segment of the Cape Foulwind Fault from the northern segment, which has lesser separation (sections T04 to T10 in ) and is continuous with the Kahurangi Fault (section T01 in ). In the hanging wall of the Cape Foulwind and Kahurangi faults, the TBU dips gently eastwards. Significant deformation is evident in the folding of the Miocene–Quaternary syncompressional sequence, truncated by sets of unconformities (e.g. sections T10, T11 and T12 in ).
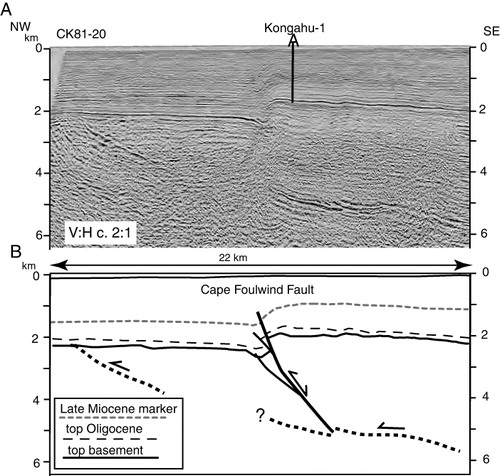
Onshore, the TBU is intensely dissected by sets of regional faults (the vast majority with north–south to NNE–SSW trends; see ) of predominant reverse-slip character. The map trace of many faults is indicative of steep to moderate dips that can be projected down to a depth of 5 km in many sections. There is, however, some evidence for lower dips of c. 30° on surface faults (cf. Ghisetti & Sibson Citation2006), as is the case for the faults bounding the Motueka High (section T01 in ) and for the Hohonu Thrust Fault in the immediate footwall of the Alpine Fault (sections T12, T14 and T15 in ). Some of the offshore seismic lines of survey CK81 (e.g. depth-converted lines CK81 9, 10, 15, 18, 20, 23, 24, 25 in http://www.nzpam.govt.nz) show a low-angle east-dipping reflector within the basement at a depth of 7–8 km () into which the westernmost faults are rooted (see sections T06 and T08 in ). This geometry is consistent with an intra-basement shear detachment, although it cannot be excluded that the reflections arise from older basement structures unrelated to the recent deformation.
Recognition of the inherited synrift normal faults reactivated as reverse faults during the Neogene is based on the preserved late Lower Cretaceous and Upper Cretaceous–Paleocene synrift sequences in the fault hanging walls (e.g. Cape Foulwind, Lower Buller, Inangahua–Maimai in sections T01, T11, T12, T14; , ) and/or on relevant variations in the thickness of the Eocene and Oligocene sediments deposited in the Palaeogene rifting phases, with abrupt across-fault transitions from thin sequences of shelf limestones to thick sequences of calc-flysch deposits (e.g. southern segment of the Cape Foulwind Fault in sections T11, T12, T14, T15, ; Karamea Fault in section T06, ; White Creek Fault in sections T08 and T10, ; and Kongahu Fault in sections T06 and T08, ). Some faults display a change from normal separation to reverse separation along-strike, depending on the degree of inversion (e.g. the normal separation on the Kahurangi Fault in section T01, , in contrast with the reverse components in the other sections to the south). The conjugate normal faults bounding the original grabens now control the boundary of inverted and uplifted basement pop-ups, where the TBU reaches the greatest elevation. The basement pop-ups are separated by elongated depressions located on original basement highs that underwent localised subsidence, becoming the loci of sedimentation during Neogene shortening.
An almost continuous cover of Palaeogene units deposited in the latest extensional phases extends from the offshore (western platform) to a large area onshore, with the exception of the basement blocks in the hanging wall of the Waimea (sections T04, T06, ) and Hohonu faults (sections T12, T14, T15, ). Regionally, there is a transition from a thin veneer of Eocene–Oligocene deposits in the offshore western platform relative to the thicker units preserved in the emergent region (see sections T08–T15, ). This transition indicates the reversal of palaeogeographic elevation as a consequence of compressional inversion.
A regionally continuous cover of the earliest (middle–late Miocene) marine syncompressional units can be reconstructed for a large part of the area, with the exception of the hanging walls of the Waimea (sections T04, T06, ) and Hohonu faults (sections T12, T14, T15, ). In contrast, the depositional areas of the late syncompressional units (Pliocene–Quaternary) appear to be restricted to the offshore region (with marine deposits) and to narrow, elongated basins of localised basement down-warping onshore (e.g. Moutere, Murchison, Maruia, Grey Valley), infilled with clastic terrestrial deposits. Facies variations and middle Miocene, Pliocene and Quaternary unconformities regionally mapped within these units (Nathan et al. Citation1986; Suggate & Waight Citation1999) attest to progressive synsedimentary deformation and uplift controlled by ongoing reverse faulting.
Contour map of the top basement unconformity (TBU)
The present elevation of the TBU preserved in outcrop, drilled by wells (), reconstructed in the 15 serial cross-sections and identified in the depth-converted seismic lines (–) constrains the 3D reconstruction of the deformed surface, performed using Move software (Midland Valley, http://www.mve.com). Given the sparse coverage of subsurface data, the 5–30 km spacing of transects () and the uncertainties in the position of the TBU projected above and below the present topography, the proposed reconstruction (shown in through the 2D contour map of the TBU) is a first-order approximation. shows the large-scale cumulative deformation recorded by the regional morphology and gradient of the TBU and by its displacement across the regional faults.
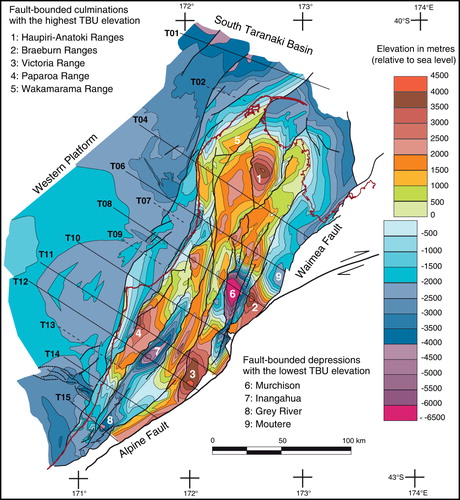
The TBU is a composite diachronous surface which never coincided with a horizontal datum of known elevation; the present elevation of this surface therefore cannot provide absolute values of uplift and subsidence, especially in cases where the palaeogeographic relief was controlled by synrift faults. However, over a large part of the study area (), the TBU corresponds to the basal transgressive contact of terrestrial to shallow marine Eocene and Oligocene units. This contact is a proxy for a regional low-relief and low-elevation reference datum that provides a marker for identifying regional deformation.
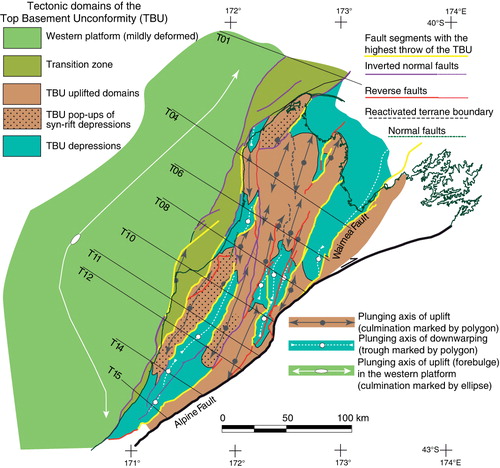
The map of (see for location and name of faults) shows the following features.
A poorly shortened western platform with a lack of significant fault dissection. However, c. 100 km west of Cape Foulwind, the TBU displays a regional large-scale bulge plunging to the north (towards the Taranaki Basin) and south (towards zones of east–west foundering bounded by the early synrift Takutai graben).
The strong elevation gradient along the transition zone parallel to the western coastline, bounded by the Cape Foulwind and Kahurangi faults to the west and the Kongahu and Lower Buller faults to the east. Within this zone the TBU is tilted in an east-dipping monocline, with elevation 0–500 m a.s.l. near Cape Foulwind and depth of 2–3 km b.s.l. in the footwall of the Kongahu and Lower Buller faults.
The sharp elevation boundary that controls the position of the northern South Island coastline, with the exclusion of the Moutere depression in the footwall of the Waimea Fault.
The strong north- to NNE-trending tectonic fabric of the TBU associated with pronounced curvature of the surface in elongated antiformal domes and adjacent synformal depressions, with steep limbs truncated by the north–south to NNE–SSW reverse faults, spaced on average 15–30 km across-strike.
The highest elevations are >4 km a.s.l. (Haupiri–Anatoki, Braeburn, Victoria and Paparoa ranges, ) whereas the deepest depressions attain maximum depths of −3 km (Moutere), < − 6 to −7 km (Murchison) and < −5 km b.s.l. (Inangahua and Grey River Valley), respectively.
Regional faults dissecting the TBU
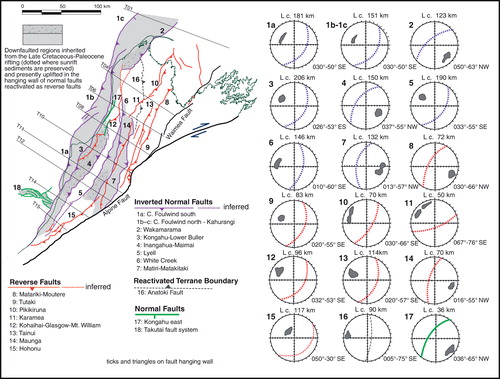
The basement faults that control the strongest contrast in elevation of the TBU are identified in in order to provide a clearer image of their continuity, spacing, geometry and mechanisms. The analysis only takes into account the vertical separation of the TBU and does not constrain any horizontal separations, although (at least in the present stress regime) they are likely to be a second-order component of the slip vector (see the predominance of close-to-pure reverse slip associated with earthquakes in the area; Townend et al. Citation2012).
The geometry of the faults reconstructed in the 3D model is portrayed in the stereonets in . Most faults strike 010–030° and dip 50−66° to NW and SE. A few faults have different geometry, for example, the east–trending Takutai faults offshore and the NE–SW Karamea Fault (dipping >70° SE) and Hohonu Fault (dipping 30° SE), both onshore. However, there are many uncertainties in the definition of the fault dips for many onshore faults given that the 3D reconstruction is based on the surface trace and the cross-section reconstructions.
The presence of Upper Cretaceous–Paleocene synrift units, the thickness changes across faults bounding Eocene and Oligocene extensional basins and the along-strike variations from normal to reverse separation indicate normal faults that were inherited from earlier extensional phases and later reactivated during the compressional phases (–).
The average fault lengths are shown in above each stereonet. These are minimum values measured along the simplified and smoothed fault surfaces reconstructed in the 3D model. Many faults appear continuous over 50–100 km lengths, whereas some aligned and contiguous fault systems (e.g. Kongahu and Lower Buller, Lyell, Inangahua and Maimai) reach total cumulative lengths of 150–200 km. The Cape Foulwind–Kahurangi fault system represents one of the most significant structures in the investigated area, comprising at least two sections 150–180 km long (faults 1a and 1b–c in ) with overall length >300 km.
Relationships between basement faults and folds in the cover
Some of the basement faults identified in are exposed at the surface, with evidence for Quaternary activity and historical seismicity (cf. Stafford et al. Citation2008; Stirling et al. Citation2012). However, other faults with large basement displacement and significant regional extent remain buried under thick covers of Neogene clastic sediments, both onshore and offshore. For some faults (e.g. Cape Foulwind and Kahurangi) available seismic lines () show that there are along-strike variations in the stratigraphic level reached by the fault tip (from Palaeogene to Miocene and Plio-Quaternary units). Notably, both the TBU and the overlying cover sequence are only folded in proximity of the faults, and a gentle monocline characterises the unfaulted packages above the fault tip (). The variation in geometry of the Cape Foulwind and Kahurangi faults can be correlated with along-strike differences in their finite vertical separation, culminating with emergence of the fault near the surface in the area of highest vertical separation (section T11, ). These geometries are likely to characterise other blind faults beneath Neogene folded sequences (e.g. subsurface of Murchison Basin, cross-section T08 in ), but the poor quality and paucity of onshore seismic data make it difficult to document this setting.
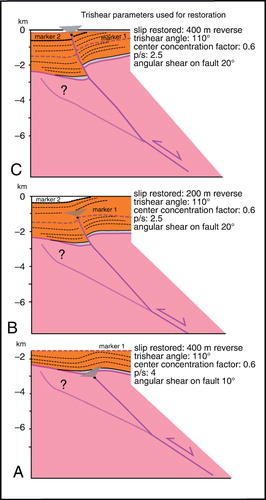
Trishear fault propagation folding appears to provide an appropriate model for the growth of forced folds above the buried Cape Foulwind and Kahurangi faults. Trishear describes localised folding within a triangular zone ahead of the fault tip (Erslev Citation1991; Allmendinger & Shaw Citation2000), and the key parameters are: (1) the fault dip angle; (2) the location of the fault tip line; (3) the cumulative fault slip; (4) the trishear apical angle; (5) the propagation to slip ratio (p/s), quantifying the incremental distance of fault tip propagation across the folded sequence during individual episodes of fault activity; and (6) the centre concentration factor, measuring whether folding is homogeneously distributed within the triangular trishear zone or rather occurring within a narrower domain.
Development of an unbreached fold above the fault tip and the geometry of the underlying displaced horizons largely depend on the length of time beds are allowed to deform ahead of the propagating fault before being offset by slip on the fault, as measured by the p/s ratio (see Allmendinger et al. Citation2004). Note that the TBU is not folded in the hanging wall of the Kahurangi and Cape Foulwind faults in sections T01–T02 () and T14 (), where synrift deposits in the fault hanging wall document the existence of a system of early normal faults that had already propagated through the TBU in the Late Cretaceous. It is possible that other pre-existing normal faults with smaller displacements were located below the TBU during the synrift stages and later reactivated as reverse faults, as suggested for the footwall splay of the Cape Foulwind Fault in section T04 (). However, other splays of the Cape Foulwind Fault may be interpreted as normal faults not reactivated in the later stages (e.g. sections T09 and T13 in ) or newly formed faults that ruptured across intact crust (e.g. sections T07 and T08 in ). Slow growth of the Cape Foulwind Fault during compressional inversion is marked by folding of both the Palaeogene and early–middle Miocene units, waning into a gentle monoclinal flexure of the late Miocene–Quaternary sequence. Data analysed for this study do not provide good constraints on the deformation of late Pliocene and Quaternary units, but ongoing studies based on high-resolution profiles (Barnes & Ghisetti Citation2013) suggest a Quaternary growth sequence controlled by activity on the fault.
Modelling of the trishear parameters needed to progressively restore the offset and folding of beds along the Cape Foulwind Fault in section T04 is shown in . Three restored stages of fault propagation and offset show the development of sediment monoclines in the Neogene sequence draping the fault tip (see also the present geometries preserved in sections T01,T07 and T08 in ) and are in agreement with relatively low propagation/slip ratios for the fault (2.5 ≤ p/s ≤ 4). The absence of Upper Cretaceous synrift deposits and the curvature of the TBU in section T04 () are compatible with the reconstructed geometry of fault propagation from within the basement in .
Discussion
summarises the regional setting of the reconstructed TBU, showing the distribution of antiformal basement pop-up and synformal basement depressions, the trend and plunge of the axes of uplift and down-warping, the extent of north–south and NNE–SSW faults that bound tectonic domains with contrasting elevation of the TBU and the position of fault segments that cause the highest vertical separation of TBU.
Geometry and inheritance of regional faults cutting the TBU
The long sequence of extensional and compressional events that have affected igneous and metamorphic units have certainly imprinted the complex fabric of the West Coast basement, but dissection and elevation gradients of the TBU can be attributed to a relatively simple set of through-going north–south to NNE–SSW faults spaced on average 15–30 km across-strike (). The north-trending tectonic fabric can be traced back to terrane boundaries (e.g. Anatoki Fault) and faulted margins along Palaeozoic and Cretaceous batholiths (), but is dominantly imparted by the inherited systems of Late Cretaceous–Palaeogene normal faults. The oldest, east–west-oriented, synrift normal faults (of late Early Cretaceous age) can be recognised in the less-deformed offshore area (e.g. Takutai Fault System; –) and at the exhumed northern and southern margin of the Paparoa Range (Pike and Ohika detachment faults; ), but they are truncated by the north-trending faults and do not significantly control the Neogene structural fabric.
Onshore, some of the original north-trending extensional basins bounded by opposite-dipping normal faults that were reactivated as reverse faults in the Neogene (), are marked by preserved synrift units and by fault-controlled thickness variations that are maintained in the characteristic harpoon-shaped folds (Bishop & Buchanan Citation1995) in the hanging wall of the inverted normal faults (e.g. , ).
The most important faults () have maximum vertical separations of the TBU of 3–5 km () and can be traced with continuity across the set of regional cross-sections (). The 3D reconstruction and the connection with subsurface faults identified by seismic surveys reveal the crustal-scale continuity of faults whose segmented traces may appear discontinuous at the surface.
Dip angles attributed to faults in the subsurface (–) are only constrained by the mapped surface trace and the geometric compatibility between adjacent cross-cutting and/or oppositely dipping faults in the 3D model. Seismic lines offshore provide some control on fault dips down to depths of 3–5 km. For most faults in the region, the reconstructed upper crustal dips are in the range 50–66° (). This is in agreement with their inferred normal fault inheritance (Ghisetti & Sibson Citation2006), although close to the expected orientation of frictional lock-up (Sibson Citation2009). However, extrapolation of moderate to steep dips at increasing depth remains speculative. A general expectation (assuming horizontal trajectories of S Hmax) is that as confining pressure increases with depth, reverse reactivation of moderate-to-steeply dipping faults would give way to the formation of new, favourably oriented, ‘Andersonian’ thrusts dipping at c. 30° (Sibson Citation2009). Dip variations may well occur in staircase trajectories controlled by detachments or other discontinuities as, for example, in the case of the low-angle shear zones inferred from some seismic lines offshore (sections T06 and T08 in , ). Propagation of newly developed, favourably oriented low-angle thrust faults that truncate the inherited normal faults has been documented and discussed by Ghisetti & Sibson (Citation2006) for subsurface fault splays in the footwall of the Pikikiruna Fault, for the Mt William Fault and for small-scale faults in the footwall of the White Creek Fault.
Fault plane solutions (Anderson et al. Citation1993; Reyners et al. Citation1997; Doser et al. Citation1999; Leitner et al. Citation2001) are consistent with dips in the range 30–60° for ruptures within the basement. The two largest historical earthquakes of Buller (1929) and Inangahua (1968) have been modelled as reverse faults dipping c. 45° east and west, respectively (Anderson et al. Citation1994; Doser et al. Citation1999), while one of the two 1991 Hawk's Crag earthquakes (Mw5.8) beneath the Paparoa Range has been modelled as a thrust with dip of c. 30° (Anderson et al. Citation1993, their event ‘N’).
Folded geometry of the TBU and propagation of basement faults
The presently emergent region west of the Alpine Fault is a mosaic of elongated fault-bounded blocks with basement pop-ups largely stripped of the Palaeogene and Neogene cover sequence, elevated several kilometres above the intervening basement depressions that are infilled by thick syncompressional sedimentary units ().
Vertical separation of the TBU between pop-ups and depressions is much larger than any possible inherited variation in the original elevation of the post-rift low-relief and low-elevation surface that defines the TBU over a vast part of the study area. An inherited relief of the order of a couple of kilometres can be envisaged for the areas where the unconformity defining the TBU is at the base of synrift units. In this case the elevation resulting from compressional inversion of the bounding normal faults would be even more pronounced given that in the up-thrust blocks of the Paparoa, Wakamarama and Victoria ranges the TBU was originally depressed below thick synrift sequences ().
Within the fault-bounded blocks the TBU displays a pronounced curvature in elongated antiformal domes and synformal basins. Folding of the top basement unconformity has been described in other thrust belts (e.g. Narr & Suppe Citation1994; Bump Citation2003; Giambiagi et al. Citation2009), and may involve a variety of brittle deformation mechanisms within the basement assemblages comprising sets of closely spaced discontinuous faults and distributed cataclasis accompanying bending and reactivation of foliation (Bump Citation2003). If models of forced folding and trishear fault propagation are used to restore the progressive growth of faults in the study area (), folding of the TBU may be explained by the presence of basement faults that propagated across the basement unconformity and the overlying sedimentary cover sequence during the Neogene. The geometry of the segmented Cape Foulwind and Kahurangi faults () suggests that the original system of normal faults was made up of distinct en échelon segments with different amounts of displacement, with the northern (Kahurangi Fault, sections T01 and T02 in , ) and southern segments (Cape Foulwind Fault, 1a in ; section T14 in ) cutting through the surface and controlling depositional areas of synrift basins. In contrast, the absence of synrift deposits along the northern segment of the Cape Foulwind Fault (1b in ) is compatible either with: (1) the presence of low-displacement normal faults not cutting the TBU that were later reactivated as reverse faults and propagated upsection into the post-rift sequence (see ); or (2) the growth of an entirely new reverse fault segment that ruptured across the basement and overlying cover sequence during the Neogene.
The double plunging character of the axes of uplift and down-warping and the location of culminations in the antiformal pop-ups and troughs in the synformal depressions are a measure of the along-strike variation in the vertical component of separation along the faults, making it possible to distinguish the fault segments with the largest finite vertical separation (in yellow in ). These belong to a regionally widespread set of conjugate, east- and west-dipping, north–south to NNE–SSW faults, showing that deformation of the TBU results from distributed compressional inversion within a large extensional province. Many faults (e.g. Cape Foulwind, Kahurangi, Wakamarama, Kohaihai, Glasgow, Mt William, Karamea, Waimea, Maunga, Lyell, see ) truncate at a slightly oblique angle to the axes of uplift and down-warping within basement blocks, suggesting repeated episodes of fault reactivation, eventually associated with propagation of new fault splays branching from the deeper fault segments (cf. Giba et al. Citation2012).
Fault reactivation and present seismotectonic regime
Data presented in this study favour a scenario where inherited regional north–south- to NNE–SSW-trending basement normal faults () have been reactivated with reverse mechanisms since the early Miocene. Multi-stage activity and synsedimentary growth of the reverse faults are suggested by changes in the fault-controlled thicknesses of syncompressional sedimentary sequences hosted in the footwall basins, associated with Miocene, Pliocene and Quaternary unconformities that were subsequently folded and faulted (e.g. , ).
The driving mechanism for reactivation of the inherited extensional tectonic fabric in the upper crust can be attributed to the regional response of the Australian plate lithosphere along the Alpine Fault continental plate boundary, as indicated by the timing of compressional inversion coeval with establishment of the plate boundary and syntectonic infilling of subsiding troughs with thick clastic units derived from the uplifting southern Alps (Sutherland Citation1996; Cutten et al. Citation2006).
The presence of reverse faults dipping both east and west that bound basement pop-ups and depressions across the whole emergent region () and the lack of consistent younging during progressive reactivation of the inherited normal faults indicate that: (1) selective reactivation is independent of fault vergence and (2) there is not a regular pattern in the migration of shortening west of the Alpine Fault.
A more regular pattern of east-to-west migration in the system of reverse faults should result from flexural bending of the Australian lithosphere against the Pacific Plate as suggested – south of the study area – for the Westland sedimentary basins (Sircombe & Kamp Citation1998; Harrison Citation1999), although this interpretation is not unique (Sutherland Citation1996; Walcott Citation1998). Nearly 100 km west of the present coastline, the geometry of the TBU in the western platform is broadly consistent with the presence of a ‘foreland bulge’ (), marking the position of the present-day flexural hinge. Similar geometries have been described further south along the seismic line SIGHT 2W (Harrison Citation1999) and in the Mikonui-1 basement high (Sircombe & Kamp Citation1998), as well as in the western platform of the Taranaki Basin (Holt & Stern Citation1994).
Regional maps (Rattenbury et al. Citation1998, Citation2006; Nathan et al. Citation2002) and the cross-sections of suggest that there is indeed a progressive westwards migration in the emergence of the uplifted domain that can be related to the long-term flexural response of the shortened Australian crust. This is recorded by the lack of preserved Miocene sediments in the easternmost basement blocks in the immediate footwall of the Alpine Fault, contrasting with their presence in the whole region to the west both onshore and offshore. The migration is also evidenced by deposition of the youngest Pliocene and Quaternary marine deposits only in the westernmost blocks and offshore, in contrast with coeval terrestrial deposits in the more internal eastern depressions such as Moutere, Murchison and Maruia (Nathan et al. Citation1986).
Our reconstruction of the present elevation and offset of the TBU does not simply equate to absolute values of uplift and subsidence (given that the TBU has never been a zero elevation datum for the area), but it shows that the inherited extensional template of north–south to NNE–SSW faults plays an important role in controlling the response of individual thick-skinned crustal blocks to shortening, imposing short-wavelength undulations that depend on the spacing of the reactivated sets of inherited conjugate normal faults. This pattern has been described in other foreland settings characterised by reactivation of inherited discontinuities (e.g. Pivnik & Johnson Citation1995; Parra et al. Citation2009), and may interfere with the long-wavelength flexural deformation of the Australian Plate.
In this paper we do not present data that constrain Quaternary activity and slip rates of the basement faults, but rather point out that there are no obvious differences in the geometry (trend, dip and dip angle) or regional location relative to the plate boundary for those faults that dissect the TBU with the largest vertical separations (). This setting implies similar reactivation potentials for the set of north–south to NNE–SSW trending basement faults in the present seismotectonic regime, although slip rates, recurrence intervals and single-event displacement on individual faults may differ considerably. The Kongahu, Lower Buller, Inangahua, Maimai, Lyell and White Creek faults contribute to the regional dissection of the TBU (), and comprise recognised Late Quaternary active segments (Rattenbury et al. Citation1998; Nathan et al. Citation2002; Stirling et al. Citation2012). Many other basement faults that cause large separation of the TBU () cannot be easily assessed for seismic hazard analyses because they are blind and associated with forced folding of the Neogene cover sequence ().
Seismogenic upper crust in the West Coast region averages 15–20 km in thickness (Eberhart-Phillips & Reyners Citation1997; Doser et al. Citation1999). The largest historical earthquakes on the White Creek Fault (1929, Mw7.8 Buller earthquake) and on a blind reverse fault with surface reactivation of the northern part of Lyell and Inangahua faults (1968, Mw7.1 Inangahua earthquake) have been assigned centroid depths of c. 10 km (Anderson et al. Citation1994; Doser et al. Citation1999). Both earthquakes show that north–south- to NNE–SSW-oriented faults with inferred dips of c. 45° can be reactivated with reverse and reverse-sinistral mechanisms, with seismic slip vectors trending on average 260–300°. These slip vectors lie subparallel to the 110–120° average trajectories of S Hmax estimated for the West Coast region (Anderson et al. Citation1993; Balfour et al. Citation2005; Sibson et al. Citation2012). A recent review based on recalculated focal mechanisms (Townend et al. Citation2012) shows similar and regionally consistent average orientation of S Hmax of c. 115° with a dominant reverse fault regime in the West Coast region. Notably, north–south to NNE–SSW moderate to steeply dipping faults cannot be easily reactivated in this stress regime (Sibson Citation2009) unless weakening factors (e.g. fluid overpressure, gouge zones, changes in fault dip with depth) play an important role. In such a compressional regime the expectation would be for new-forming ‘Andersonian’ thrusts to have dips of c. 30° to the ESE or WNW (Sibson Citation2012). It is however also possible that presently active reverse faults follow composite staircase trajectories comprising segments of steep inherited normal faults and segments of shallow-dipping, newly propagating thrust faults that are favourably oriented in the present stress field (Ghisetti & Sibson Citation2006).
Based on these considerations, we propose a seismotectonic setting where newly propagating low-angle faults that are growing in the present stress regime splay from the Alpine Fault (). The only emergent shallow-dipping structure that can be directly linked to shortening in the footwall of the Alpine Fault is the Hohonu Thrust Fault, which possesses a NE–SW orientation parallel to (rather than oblique to) the Alpine Fault and dips c. 30° SE. However, we infer the presence of other low-angle active faults hidden at depth >10 km, as supported by the thrust mechanism of one of the two 1991 Hawk's Crag earthquakes located at depth of c. 10 km beneath the Paparoa Range (Anderson et al. Citation1993). These faults eventually ramp upsection and transfer components of shortening into the upper crust by exploiting the steep inherited faults that control the geometry of the TBU and of the folded sedimentary cover (). Comparisons may be drawn with other areas of active compressional inversion (e.g. northern Honshu, Sibson Citation2009) where earthquake rupturing involves competition between reverse-slip reactivation of inherited steep faults and the development of c. 30° dipping ‘Andersonian’ thrusts.
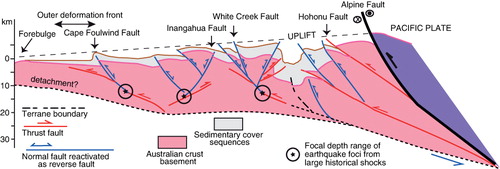
In this scenario, the transition zone between the strongly uplifted coastal blocks and less-deformed offshore regions of the western platform () marks the position of a complex outer front of deformation within the compressional orogen (). The transition zone is bounded by the Cape Foulwind and Kahurangi faults, defining one of the lengthiest fault systems of the entire region. This system displays significant along-strike segmentation and variations in geometry and throw of the TBU connected to different amounts of progressive inversion and upwards propagation (with low propagation/slip ratios) into the Neogene sedimentary sequence (). The significant morphotectonic control exerted by this fault is reflected by the advanced position of the coastline in the region of Cape Foulwind relative to the areas to the north, associated with the east-tilting of the TBU and its emergence () along the segment of the Cape Foulwind Fault that has the largest vertical separation (). The inferred Late Quaternary activity and earthquake potential of the Cape Foulwind and Kahurangi faults will be addressed in a companion paper which is currently in preparation by the authors.
Conclusions
The reconstructed geometry of the Top Basement Unconformity (TBU) provides a marker for reconstructing regional deformation in the shortened Australian crust west of the Alpine Fault.
The structural trends of the folded TBU and the several kilometres of finite vertical separation between uplifted basement pop-ups and down-warped basement depressions are controlled by spacing, lateral extent and conjugate geometry of a crustal fabric of inherited extensional faults that underwent selective and persistent reverse-slip reactivation during ongoing compression that started in the middle Miocene (coeval with activity of the Alpine Fault) and continues at present.
Some of the faults control the distribution of preserved Upper Cretaceous–Paleocene synrift deposits as well as variations in thickness of the Palaeogene rift sequences; they therefore must have breached the TBU, or at least controlled significant geomorphic development, during the extensional phases. Compressional reactivation and growth of these faults is evidenced by the propagation of the fault tip within syncompressional units of progressively younger age and eventual rupture to the surface. In other cases, the marked curvature of the TBU close to the faults and the monoclinal folding of unbreached syncompressional units above blind fault tips suggest growth and propagation of faults (low-displacement inherited faults and/or new faults) from deeper positions within the basement. These faults have since grown upsection, possibly with low propagation/slip ratios. This setting is demonstrated by the Cape Foulwind and Kahurangi faults, which mark the westernmost edge of the deformed TBU close to the onshore–offshore transition boundary. These faults display a complete spectrum of along-strike variations of deformation in the cover sequence controlled by the varying position of the fault tip line and the vertical separation imposed by different amounts of compressional inversion, with eventual propagation of new segments.
Geometry of the faults in the depth range of typical earthquake nucleation (10–15 km) remains hypothetical (), but several large historical earthquakes have modelled fault dips of 30–60°. The structural style depicted for the uppermost basement shows that many faults that deform the TBU are regionally continuous and widespread, have dimensions, spacing and offsets compatible with trans-crustal penetration and contain fault segments that have ruptured in large historical earthquakes. The mapped faults ramp at angles of 50–66° in the uppermost 5 km; at greater depth they may have lower angles or there may be newly forming, favourably oriented thrust faults that ramp towards the surface by incorporating the steeply dipping faults.
The propagation of new low-angle ‘Andersonian’ thrust faults in the lower seismogenic crust and reactivation of blind inherited faults whose tip lines migrate upsection through folded sedimentary covers at low propagation/slip ratios are factors that inhibit a clear recognition of all faults capable of generating future large earthquakes.
A number of faults identified in as major structures controlling deformation of the TBU were not included in the recently revised seismic hazard model of New Zealand (Stirling et al. Citation2012). We suspect that many of them could potentially rupture in the present stress field in moderate to large earthquakes, especially in the region of the transition zone bounded by the Kongahu–Lower Buller and Cape Foulwind–Kahurangi fault systems. Additional neotectonic research in this region is needed to quantify dimensions and slip rates of these potential earthquake sources for seismic hazard analyses.
Deformation of the basement records a long-term history of fault activity and should be considered together with evidence for surface faulting and Quaternary deformation, especially in regions that are more vulnerable because of higher population concentration, infrastructure and proximity to fault-controlled coastlines.
Acknowledgements
Research was funded by a Brian Mason Grant to FCG through the University of Canterbury. PMB was funded by two Ministry of Business, Innovation and Employment (MBIE) Envirolink Medium Advice Grants and NIWA Core Hazard Centre funds. Use of the Midland Valley Move v.2012–2013 software was made possible by academic licence to the University of Canterbury and is gratefully acknowledged.
References
- Adams RD, Le Fort JH 1963. The Westport earthquakes, May 1962. New Zealand Journal of Geology and Geophysics 6: 487–509. doi:10.1080/00288306.1963.10420062
- Allmendinger RW, Shaw JH 2000. Estimation of fault propagation distance from fold shape: implications for earthquake hazard assessment. Geology 28: 1099–1102. doi:10.1130/0091-7613(2000)28%3C1099:EOFPDF%3E2.0.CO;2
- Allmendinger RW, Zapata T, Manceda R, Dzelalijia F 2004. Trishear kinematic modeling of structures with examples from the Neuquen Basin, Argentina. In: McClay KR ed. Thrust Tectonics and Hydrocarbon systems American Association of Petroleum Geologists Memoir 82: 356–371.
- Anderson H, Beanland S, Blick G, Darby D, Downes G, Haines J, et al. 1994. The 1968 May 23 Inangahua, New Zealand earthquake: an integrated geological, geodetic and seismological source model. New Zealand Journal of Geology and Geophysics 37: 59–86. doi:10.1080/00288306.1994.9514601
- Anderson H, Webb T, Jackson J 1993. Focal mechanisms of large earthquakes in the South Island of New Zealand: implications for the accommodation of Pacific-Australia plate motion. Geophysical Journal International 115: 1032–1054. doi:10.1111/j.1365-246X.1993.tb01508.x
- Balfour NJ, Savage MK, Townend J 2005. Stress and crustal anisotropy in Marlborough, New Zealand: evidence for low fault strength and structure-controlled anisotropy. Geophysical Journal International 163: 1073–1086. doi:10.1111/j.1365-246X.2005.02783.x
- Barnes PM, Ghisetti F 2013. Offshore faulting and earthquake sources, West Coast, South Island. Stage 2. MBIE Envirolink West Coast Regional Council Advice: 1237-WCRC114. NIWA, Wellington, unpublished Report, 34 p.
- Beggs JM, Ghisetti FC, Tulloch AJ 2008. Basins and petroleum systems analysis of the West Coast region, South Island, New Zealand. PESA Eastern Australasian Basins Symposium III, September 2008, Sydney.
- Bishop DJ 1992. Middle Cretaceous-Tertiary tectonics and seismic interpretation of North Westland and Northwest Nelson, New Zealand. PhD thesis. Wellington, Victoria University.
- Bishop DJ, Buchanan PG 1995. Development of structurally inverted basins: a case study from the West Coast, South Island, New Zealand. In: Buchanan JG, Buchanan PG ed. Basin inversion, Geological Society of London Special Publication 88: 549–585.
- Bradshaw JD 1989. Cretaceous geotectonic patterns in the New Zealand region. Tectonics 8: 803–820. doi:10.1029/TC008i004p00803
- Brune JN, Allen CR 1967. A low stress-drop, low-magnitude earthquake with surface faulting: the Imperial, California earthquake of March 4, 1966. Bulletin of the Seismological Society of America 57: 501–514.
- Bump AP 2003. Reactivation, trishear modeling, and folded basement in Laramide uplifts: implications for the origins of intra-continental faults. GSA Today, March 2003, 4–10. doi:10.1130/1052-5173(2003)013%3C0004:RTMAFB%3E2.0.CO;2
- Campbell JK, Pettinga JR, Jongens R 2012. The tectonic and structural setting of the 4 September 2010 Darfield (Canterbury) earthquake sequence, New Zealand. New Zealand Journal of Geology and Geophysics 55: 155–168. doi:10.1080/00288306.2012.690768
- Crooks I, Carter RM 1976. Stratigraphy of Maruia and Matiri Formations in their type section (Trent Stream, Matiri River, Murchison). Journal of the Royal Society of New Zealand 6: 459–487. doi:10.1080/03036758.1976.10421485
- Cutten HNC, Korsch RJ, Roser BP 2006. Using geochemical fingerprinting to determine transpresive fault movement history: application to the New Zealand Alpine Fault. Tectonics 25: TC 4014. doi:10.1029/2005TC001842
- Doser DI, Webb T, Maunder DE 1999. Source parameters of large historical (1918–1962) earthquakes, South Island, New Zealand. Geophysical Journal International 139: 769–794. doi:10.1046/j.1365-246x.1999.00986.x
- Eberhart-Phillips D, Reyners M 1997. Continental subduction and three-dimensional crustal structure: the northern South Island, New Zealand. Journal of Geophysical Research 102: 11843–11861. doi:10.1029/96JB03555
- Erslev EA 1991. Trishear fault-propagation folding. Geology 19: 617–620. doi:10.1130/0091-7613(1991)019%3C0617:TFPF%3E2.3.CO;2
- Geophysical Surveys Incorporated 1981. Operations Report Marine Seismic Survey Karamea, NZ CK-81. PPL 38058. Petroleum Report PR884. http://www.nzpam.govt.nz (accessed 3 February 2014).
- Ghisetti FC, Sibson RH 2006. Accommodation of compressional inversion in north-western South Island (New Zealand): old faults versus new? Journal of Structural Geology 28: 1994–2010. doi:10.1016/j.jsg.2006.06.010
- Giba M, Walsh JJ, Nicol A 2012. Segmentation and growth of an obliquely reactivated normal fault. Journal of Structural Geology 39: 253–267. doi:10.1016/j.jsg.2012.01.004
- Giambiagi L, Ghiglione M, Cristallini E, Bottesi G 2009. Kinematic models of basement/cover interaction: insights from the Malargue fold and thrust belt, Mendoza, Argentina. Journal of Structural Geology 31: 1443–1457. doi:10.1016/j.jsg.2009.10.006
- Grobys JWG, Gohl K, Eagles G 2008. Quantitative tectonic reconstructions of Zealandia based on crustal thickness estimates. Geochemistry, Geophysics, Geosystems 9. doi:10.1029/2007GC001691
- Harrison AJ 1999. Multi-channel seismic and flexural analysis of the Westland sedimentary Basin, South Island, New Zealand. Master thesis. Wellington, Victoria University.
- Holt WE, Stern TA 1994. Sediment loading on the Western Platform of the New Zealand continent; implications for the strength of a continental margin. Earth and Planetary Science Letters 107: 523–538. doi:10.1016/0012-821X(91)90098-3
- Jackson J, McKenzie D, Priestley K, Emmerson B 2008. New views on the structure and rheology of the lithosphere. Journal of the Geological Society of London 165: 453–465. doi:10.1144/0016-76492007-109
- Jongens R 2006. Structure of the Buller and Takaka Terrane rocks adjacent to the Anatoki Fault, northwest Nelson, New Zealand. New Zealand Journal of Geology and Geophysics 49: 443–461. doi:10.1080/00288306.2006.9515180
- Kamp PJJ 1986. The mid-Cenozoic Chaleenger Rift System of western New Zealand and its implications for the age of Alpine fault inception. Geological Society of America Bulletin 97: 255–281. doi:10.1130/0016-7606(1986)97%3C255:TMCRSO%3E2.0.CO;2
- Kamp PJJ, Webster KS, Nathan S 1996. Thermal history analysis by integrated modeling of apatite fission track and vitrinite reflectance data: application to an inverted basin (Buller coalfield, New Zealand). Basin Research 8: 383–402. doi:10.1046/j.1365-2117.1996.00152.x
- King PR, Naish TR, Browne GH, Field BD, Edbrooke SW ( comp.) 1999. Cretaceous to recent sedimentary patterns in New Zealand. Institute of Geological & Nuclear Sciences folio series 1, 35.
- Laird MG 1993 Cretaceous continental rifts: New Zealand region. In: Ballance PF ed. South Pacific sedimentary basins. Sedimentary Basins of the World 2. Amsterdam, Elsevier Science. Pp. 37–49.
- Laird MG, Bradshaw JD 2004. The break-up of a long-term relationship: the Cretaceous separation of New Zealand from Gondwana. Gondwana Research 7: 273–286. doi:10.1016/S1342-937X(05)70325-7
- Lamarche G, Collot J-Y, Wood RA, Sosson M, Sutherland R, Delteil J 1997. The Oligocene-Miocene plate boundary, south of New Zealand: evolution from oceanic spreading to strike-slip faulting. Earth and Planetary Science Letters 148: 129–139. doi:10.1016/S0012-821X(97)00026-5
- Leitner B, Eberhart-Phillips D, Anderson H, Nabelek JL 2001. A focused look at the Alpine fault, New Zealand: seismicity, focal mechanisms, and stress observations. Journal of Geophysical Research 106: 2193–2220. doi:10.1029/2000JB900303
- LeMasurier WE, Landis CA 1996. Mantle-plume activity recorded by low-relief erosion surfaces in West Antarctica and New Zealand. Geological Society of America Bulletin 108: 1450–1466. doi:10.1130/0016-7606(1996)108%3C1450:MPARBL%3E2.3.CO;2
- Mortimer N 2004. New Zealand's geological foundations. Gondwana Research 7: 261–272. doi:10.1016/S1342-937X(05)70324-5
- Narr W, Suppe J 1994. Kinematics of basement-involved compressive structures. American Journal of Science 294: 802–860. doi:10.2475/ajs.294.7.802
- Nathan S, Anderson HJ, Cook RA, Herzer RH, Hoskins RH, Raine JI, et al. 1986. Cretaceous and Cenozoic sedimentary basins of the West Coast region, South Island, New Zealand. New Zealand Geological Survey Basin Studies 1, 89.
- Nathan S, Rattenbury MS, Suggate RP ( comp.) 2002. Geology of the Greymouth area. Institute of Geological & Nuclear Sciences 1:250 000 geological map 12. Lower Hutt, Institute of Geological & Nuclear Sciences, 1 sheet +58 p.
- Nazareth JJ, Hauksson E. 2004. The seismogenic thickness of the southern California crust. Bulletin of the Seismological Society of America 94: 940–960. doi:10.1785/0120020129
- Parra M, Mora A, Jaramillo C, Strecker MR, Sobel ER, Quiroz L, et al. 2009. Orogenic wedge advance in the northern Andes: evidence from the Oligocene-Miocene sedimentary record of the Medina Basin, Eastern Cordillera, Colombia. Geological Society of America Bulletin 121: 780–800. doi:10.1130/B26257.1
- Pivnik DA, Johnson GD 1995. Depositional response to Pliocene-Pleistocene foreland partitioning in northwest Pakistan. Geological Society of America Bulletin 107: 895–922. doi:10.1130/0016-7606(1995)107%3C0895:DRTPPF%3E2.3.CO;2
- Quigley M, Van Dissen R, Litchfield N, Villamor P, Duffy B, Barrell D, et al. 2012. Surface rupture during the 2010 Mw 7.1 Darfield (Canterbury) earthquake: implications for fault rupture dynamics and seismic-hazard analysis. Geology 40: 55–58. doi:10.1130/G32528.1
- Rattenbury MS, Cooper RA, Johnston MR ( comp.) 1998. Geology of the Nelson area. Institute of Geological & Nuclear Sciences 1:250 000 geological map 9. Lower Hutt, Institute of Geological & Nuclear Sciences, 1 sheet +67 p.
- Rattenbury MS, Townsend DB, Johnston MR ( comp.) 2006. Geology of the Kaikoura area. Institute of Geological and Nuclear Sciences 1:250 000 geological map 13. Lower Hutt, New Zealand. GNS Science. 1 sheet + 70 p.
- Reyners M, Robinson R, McGinty P 1997. Plate coupling in the northern South Island and southernmost North Island, New Zealand, as illuminated by earthquake focal mechanisms. Journal of Geophysical Research 102: 15197–15210. doi:10.1029/97JB00973
- Shaw JH, Suppe J 1996. Earthquake hazards of active blind thrust faults under the central Los Angeles basin, California. Journal of Geophysical Research 101: 8623–8642. doi:10.1029/95JB03453
- Sibson RH 2009. Rupturing in overpressured crust during compressional inversion – the case from NE Honshu, Japan. Tectonophysics 473: 404–416. doi:10.1016/j.tecto.2009.03.016
- Sibson RH 2012. Reverse fault rupturing: competition between non-optimal and optimal fault orientations. In: Healy D, Butler RWH, Shipton ZK, Sibson RH ed. Faulting, fracturing and igneous intrusion in the earth's Crust, Geological Society of London Special Publication 367: 39–50. doi:10.1144/SP367.4
- Sibson RH, Ghisetti FC, Crookbain RA 2012. Andersonian wrench faulting in a regional stress field during the 2010–2011 Canterbury, New Zealand, earthquake sequence. In: Healy D, Butler RWH, Shipton ZK, Sibson RH ed. Faulting, fracturing and igneous intrusion in the earth's crust. Geological Society of London Special Publication 367: 7–18. doi:10.1144/SP367.2
- Sircombe KN, Kamp PJJ 1998. The South Westland Basin: seismic stratigraphy, basin geometry and evolution of a foreland basin within the Southern Alps collision zone, New Zealand. Tectonophysics 300: 359–387. doi:10.1016/S0040-1951(98)00254-6
- Spell TL, McDougall I, Tulloch AJ 2000. Thermochronologic constraintrs on the breakup of the Pacific Gondwana margin: the Paparoa metamorphic core complex, South Island, New Zealand. Tectonics 19: 433–451. doi:10.1029/1999TC900046
- Stafford PJ, Pettinga JR, Berrill JB 2008. Seismic source identification and characterization for probabilistic seismic hazard analyses conducted in the Buller-NW Nelson Region, South Island, New Zealand. Journal of Seismology 12: 477–498. doi:10.1007/s10950-008-9099-x
- Stein RS, Ekström GE 1992. Seismicity and geometry of a 110-km long blind thrust fault, 2, Synthesis of the 1982–85 California earthquake sequence. Journal of Geophysical Research 97: 4865–4883. doi:10.1029/91JB02847
- Stirling M, McVerry G, Gerstenberger M, Litchfield N, Van Dissen R, Berryman K, et al. 2012. National Seismic Hazard model for New Zealand: 2010 update. Seismological Society of America Bulletin 102: 1514–1542. doi:10.1785/0120110170
- Suggate RP, Waight T 1999. Geology of the Kumara-Moana area. Institute of Geological & Nuclear Sciences geological map 24. Lower Hutt, New Zealand, Institute of Geological & Nuclear Sciences. 1 sheet + 120 p.
- Sutherland R 1996. Transpressional development of the Australia-Pacific boundary through southern South Island, New Zealand: constraints from Miocene-Pliocene sediments, Waiho-1 borehole, South Westland. New Zealand Journal of Geology and Geophysics 39: 251–264. doi:10.1080/00288306.1996.9514709
- Sutherland R, Davey F, Beavan J 2000. Plate boundary deformation in South Island, New Zealand, is related to inherited lithospheric structure. Earth and Planetary Science Letters 177: 141–151. doi:10.1016/S0012-821X(00)00043-1
- Townend J, Sherburn S, Arnold R, Boese C, Woods L 2012. Three-dimensional variations in present-day tectonic stress along the Australia-Pacific plate boundary in New Zealand. Earth and Planetary Science Letters 353–354: 47–59. doi:10.1016/j.epsl.2012.08.003
- Tulloch AJ, Kimbrough DL 1989. The Paparoa metamorphic core complex, New Zealand: Cretaceous extension associated with fragmentation of the Pacific margin of Gondwana. Tectonics 8: 1217–1234. doi:10.1029/TC008i006p01217
- Tulloch AJ, Kimbrough DL 2003. Paired plutonic belts in convergent margins and the development of high Sr/Y magmatism: the Peninsular Ranges Batholith of California and the Median Batholith of New Zealand. Geological Society of America Special Paper 374: 275–295. doi:10.1130/0-8137-2374-4.275
- Waight TE, Weaver SD, Muir RJ 1998. Mid-Cretaceous granitic magmatism during the transition from subduction to extension in southern New Zealand: a chemical and tectonic synthesis. Lithos 45: 469–482. doi:10.1016/S0024-4937(98)00045-0
- Walcott RI 1998. Modes of oblique compression: late Cenozoic tectonics of the South Island of New Zealand. Review of Geophysics 36: 1–26. doi:10.1029/97RG03084
- Wallace RE 1984. Patterns and timing of late Quaternary faulting in the Great-Basin Province and relation to some regional tectonic features. Journal of Geophysical Research 89: 5771–5790. doi:10.1029/JB089iB07p05763
- Walsh JJ, Bailey WR, Childs C, Nicol A, Bonson CG 2003. Formation of segmented normal faults: a 3-D perspective. Journal of Structural Geology 25: 1251–1262. doi:10.1016/S0191-8141(02)00161-X
- Wang CY 2002. Detection of a recent earthquake fault by the shallow reflection seismic method. Geophysics 67: 1465–1473. doi:10.1190/1.1512791
- Wellman HW 1949. Geology of the Pike River coalfield, North Westland. New Zealand Journal of Science and Technology 30: 84–95.
- Wellman HW, Beck AC, Suggate RP, Grindley GW, Kear D 1973. Stratigraphic columns for the Cretaceous-Lower Quaternary sediments of North–West Nelson and the West Coast, South Island. New Zealand Geological Survey Report 63. Wellington, New Zealand, New Zealand Geological Survey. 94 p.