
Abstract
The United Nations 2013 Minamata Convention advocates for updated environmental assessments of potential point-source sites of mercury contamination, including historic closed or abandoned mines. The Puhipuhi mercury mine (Northland), a historic and abandoned mine site, is located near one of the headwaters of the Wairoa River. In this study, total mercury levels in soils and sediments (37.8–1748 µg g−1), total and methylated mercury in waters (69.6–240 ng L−1 and 0.637–1.95 ng L−1, respectively), and elemental mercury in air (0.06–0.5 ng m−3) were measured to assess the probability and form of mercury release from the site to the surrounding natural environment. Results showed that mercury concentrations at the site are elevated compared to regional backgrounds and further work is necessary to determine how mercury may be transported from the site.
Introduction
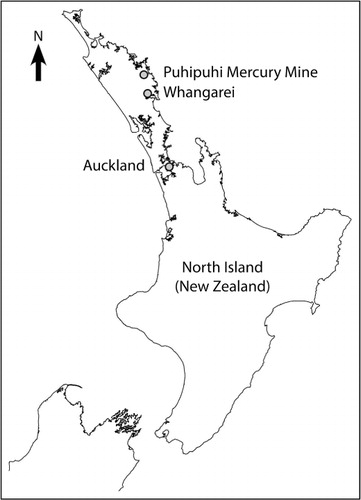
The 2013 enactment of the United Nations Environmental Program (UNEP) Legally Binding Instrument on Mercury, known as the Minamata Convention, renews worldwide focus on assessment and remediation of mercury-contaminated sites, such as historic mining operations that used mercury amalgams or processed mercury ore (UNEP Citation2013). The Puhipuhi area in Northland is one of only three places in New Zealand where mercury (Hg) has been mined as the primary target commodity. The site is located within the Waikiore Conservation Area, north of Whāngārei, and is currently managed by the NZ Department of Conservation (). The Puhipuhi Hg mine (), non-operational for more than 60 years, is currently being assessed as a point source for Hg pollution to the region’s soil and waterways. The Hikurangi depression, a former swamp reclaimed for dairy farmland, receives discharge from the western Puhipuhi upland via the Waiotu Stream (Ferrar Citation1925; Henderson Citation1944; Northland Regional Council Citation2002). The northern Wairoa River, which is the region’s largest river, also receives discharge from the Puhipuhi upland via the Waiotu Stream (Henderson Citation1944; Northland Regional Council Citation2002).
The Hg ore deposits of the Northland province of New Zealand are localised in active and fossil hydrothermal systems, particularly in the Ngāwhā and Puhipuhi areas, respectively. At Puhipuhi, Hg is mostly present as cinnabar (HgS), but also as an impurity in marcasite (≤1 wt%), mackinawite (≤1 wt%) or Ba-phosphates (≤0.5 wt%) (Craw et al. Citation2000). Mercury mining occurred at Puhipuhi Mine between 1917 and 1945, and few precautions were taken during this period to mitigate the spread of Hg to the environment. Between 1917 and 1945 a total of 43 tonnes (t) of Hg were produced from Puhipuhi ore (grading 0.17–1.0%), with company-specific yields given below when available (Christie et al. Citation1995). Between 1917 and 1921 the property was mined by Whāngārei Cinnabar Company, Auckland Cinnabar Mining Company and NZ Quicksilver Mines Limited (NZQM), producing 15.5 t of Hg from a total of 1558 t of ore (Ferrar Citation1925; Butcher Citation2010). During this time the tenor of the Puhipuhi ore was described to be similar to deposits worked in California, but much lower than ore from Almaden, Spain (Ferrar Citation1925). From mine-workings and boring operations, the ore-body was estimated to contain about 35,000 t of Hg ore (Ferrar Citation1925).
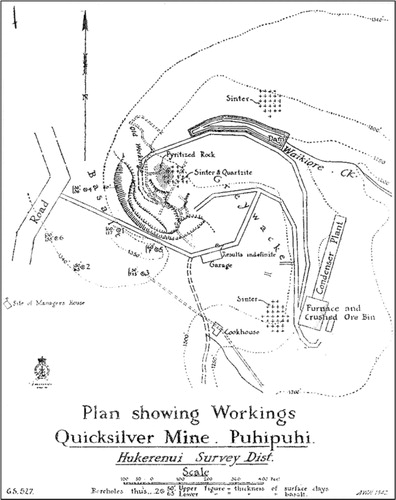
In 1926, the Great British Mine took over and produced c. 0.71 t of Hg from 400 t of ore in one year (Henderson Citation1944). From 1928 to 1933, no further ore was discovered and work ceased. In 1934 Mercury Mines (New Zealand) bought the rights, and between 1935 and 1938 1.24 t of Hg was produced (Webb Citation1940). In 1939 a syndicate, New Zealand Mercury Mines Ltd. (NZMM), invested in infrastructure including new processing facilities with crushers, ore bins, rotary kilns, a condensing plant, auxiliary buildings and workshops (Webb Citation1941). Waikiore Stream was dammed to ensure a water supply; shows the site during the peak of its operation under NZMM in 1944 (Henderson Citation1944; Butcher Citation2010). The mine was active from 1941 to 1945, and produced c. 15.1 t of Hg from over 4810 t of ore (Henderson Citation1944; O’Brien Citation1946; Butcher Citation2010). Adverse weather conditions, a high ratio of overburden to ore, the patchy nature of the ore-body, difficulties in securing earth-moving equipment and, above all, the collapse in the price of Hg resulted in low production of Hg at Puhipuhi (O’Brien Citation1946). Despite considerable investment and prolonged effort, Hg mining at Puhipuhi ceased totally in 1945. The site has remained undisturbed, with much of the WWII-era processing equipment still standing. The mine is situated at the north end of the Waikiore Stream and includes an open-pit quarry, dam and the remains of a processing plant ().
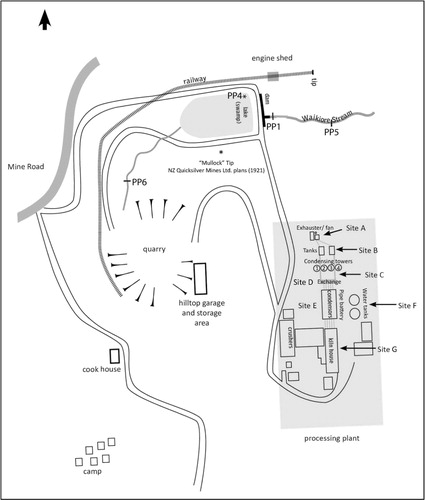
At Puhipuhi the Hg extraction process began with truckloads of ore from the quarry being off-loaded onto a concrete chute which led from the road to the crushers (Site G). The ore was crushed and then lifted to the furnace to be roasted (Site G). Gaseous elemental mercury (Hg0) released during roasting initially passed through five horizontal metal pipes set into a concrete reinforced metal trough (5.4 m × 10 m) filled with water (Site G) to condense Hg0 (Butcher Citation2010). The metal pipes extended to the pipe battery (Site E), which consisted of ten low concrete troughs (1.2 m × 3.6 m and 0.7 m apart), with terracotta pipes set into cooling troughs of water to condense Hg0 (Butcher Citation2010). Four metal condensing towers (12 m height and 3 m diameter, Site C) trapped gaseous Hg0 that passed through the pipe battery, and funnelled condensed Hg0 back through the cooling system via the pipe exchange (Site D): a hollow concrete structure that directed flow from the five pipes of the cooling system to two larger pipes that fed into the tower structure. After the condensing towers, two drum-shaped metal tanks (3 m × 3 m, Site B), and the exhauster fan set within a timber structure (Site A) trapped Hg0 and vented gaseous by-products of the Hg extraction process (Butcher Citation2010).
Only a few published studies of Hg contamination at Puhipuhi exist; a study by Hoggins & Brooks (Citation1973) surveyed the Hg content of molluscs collected from an estuary of the Wairua (Wairoa) River, Northland, which receives input from the Puhipuhi watershed. Their results indicated a dispersion of Hg from Puhipuhi up to 35 km from the cinnabar deposits. Total mercury (HgT) levels in water dropped below normal background (0.0001 ppm) within c. 8 km; however, HgT levels in sediments exceeded natural background levels (>0.01 ppm) up to 35 km downstream of the mine deposits. No other published values exist for HgT at or around the mine site, and no values for methylmercury (MeHg) have ever been reported for the sediments and waterways around Puhipuhi. Public concern over use of road aggregate sourced from Puhipuhi quarries prompted investigation of Hg release from quarry rock (Craw et al. Citation2002), and lead to the conclusion that sediment carried in runoff to streams poses a higher risk of Hg contamination than leaching of Hg through dissolution.
Processed (i.e. roasted) Hg ore, known as calcines, contain more soluble Hg minerals (i.e. montroydite, eglestonite, corderoite and elemental Hg) compared to unroasted ore (waste rock from the quarry), and leaching of calcines can be a significant source of HgT as has been observed at numerous Hg mines (Gray Citation2003; Navarro et al. Citation2005; Stetson et al. Citation2009; Gray et al. Citation2010; Wiederhold et al. Citation2013; Yin et al. Citation2013). Plans of mine workings at Puhipuhi show two tip locations. In 1921 under NZ Quicksilver Mines Ltd., the ‘mullock’ (i.e. waste rock) tip was located just south of the present-day dam, between the Waikiore Stream and the quarry (; Ferrar Citation1925). In 1945 under the NZ Mercury Mines Ltd., overburden was dumped at the end of the tramway just above the Waikiore Stream in what was once a natural gully but has now been altered by tram-loads of overburden (Butcher Citation2010). It is assumed that the tips at Puhipuhi include both waste rock (from the quarry) and calcines; however, historical records from Puhipuhi do not explicitly state the contents. Published studies have shown that mine waste (waste rock and calcines) from historical Hg mine sites can have HgT concentrations ranging from 10 to 1500 µg g−1 (Rytuba Citation2003). Methylmercury concentrations can also be significantly inflated in calcined mine wastes (Gray et al. Citation2002a, Citation2003). The presence of calcines will increase mobility of Hg in leachate.
This report contains the first data describing total Hg in soils and waters and MeHg in waters at the abandoned and vegetation-overgrown Puhipuhi Hg mine. These data are placed into the context of the historical mining operations at the site to identify likely ‘hotspots’ for species-specific Hg contamination. The results of this study provide information regarding the potential for release of toxic Hg species from the mine to the surrounding environment.
Materials and methods
Samples for Hg analyses were collected following protocols outlined in Olson and DeWild (Citation1999) with the following variations. High-density polyethylene (HDPE) and Teflon® (PTFE) bottles were used for sample collection. Sample bottles were cleaned by being filled with 6 M hydrochloric acid (HCl) and heated overnight in a hot water bath (c. 40 °C), then rinsed with reagent-grade water and stored in double zip-type bags. Water samples for total mercury (HgT) and total methylated mercury (MeHgT) analyses were collected at both the mine site and along a transect of the Waikiore Stream () in HDPE and PTFE bottles, and filtered the same day through 0.45 μm membrane syringe filters. GPS coordinates are provided for water sample locations in . Filtered samples were stored in clean HDPE or PTFE bottles and spiked with 1% v/v 11 M reagent-grade HCl and stored out of direct light at 4 °C, as per Olson & DeWild (Citation1999). The PTFE bottles were used to acquire duplicate samples from two sites suspected to be low in Hg. Filtered water samples for common anion analysis were stored in sterile 50 mL conical tubes and kept refrigerated. Anion concentrations (F−, Cl−, Br−, NO3−, SO42−) were measured in filtered water using a Dionex DX-120 ion chromatograph with an IonPAC As14 column (4 × 250 mm) in the Department of Chemistry at the University of Melbourne. An Orion 250a combination electrode was used in the field to take pH and oxidation-reduction potential (ORP, mV) measurements. The ORP measurements have been corrected to a standard hydrogen electrode (+249 mV at 20 °C), as outlined in the manual for an Orion 96–96 combination electrode, and are reported as redox potential (Eh, mV).
Table 1 Water chemistry data from Waikiore Stream and dam at Puhipuhi Mine, including filtered (<0.45 μm) mercury (HgT, MeHgT) concentrations.
Table 2 Total solid-phase mercury (HgT) content of soils and sediments, and gaseous elemental mercury (Hg0) from processing area, including pH of standing water when sediment samples were collected. Processing area is located at 35°27′43″S, 174°15′10″E.
Surface soil samples were collected as a grab sample from a depth of roughly 5–10 cm from various areas of the processing plant using a stainless steel spade. The final sample was a composite of three subsamples collected from the sampling site. Samples were placed in sterile 50 mL conical polypropylene tubes and sealed. Soil samples were stored on ice until they could be stored in the laboratory at –80 °C. Sediments (water-suspended soil and debris) were collected from standing water throughout the processing area in sterile 50 mL conical polypropylene tubes. Excess water was removed prior to analysis by centrifuging the sample. A moss sample was collected from the spigot of a metal cooling trough near the kiln house remains. For solid HgT analysis, c. 5 g (wet-weight) of soil, sediment or moss sample was freeze-dried overnight on a Heto-Drywinner vacuum system. Accurate GPS coordinates could not be measured in the processing area due to heavy tree cover; a clearing near the pipe battery (site E) provides the relative location of the processing area to the Waikiore Stream.
All water and freeze-dried solid samples (soil, sediments and moss) were shipped for analysis to the Wisconsin Mercury Research Lab (WMRL) of the Wisconsin Water Science Center (USGS; Middleton, Wisconsin). Filtered HgT analysis of water was determined using cold vapour atomic fluorescence spectrometry (CVAFS) following US EPA Method 1631 (Olson & DeWild Citation1999). Filtered MeHgT analysis of water was determined by distillation, gas chromatography separation and speciated isotope dilution mass spectrometry using inductively coupled plasma mass spectroscopy (ICP-MS) following USGS Method 01–445 and WMRL protocols (Olson & DeWild Citation1999). Solid samples were analysed for HgT by acid digestion and CVAFS following USGS Method 5A-8 and WRML protocols (Olson & DeWild Citation1999; Olund Citation2004).
Mercury vapour concentrations in air directly above soils and in processing equipment were determined at several areas of the mine using an oxidation-based Hg collection method, NIOSH Method 6009 (Eller & Cassinelli Citation1994). Samples were collected on Anasorb® sorbent tubes, Model C300, containing Hopcalite resin. Flow rate and volume of air sampled were regulated using a SKC PCXR4 Universal Air Sampling Pump with a fixed flow rate of 2 L min−1, recommended for short sampling times (Takaya et al. Citation2006). All samples were acquired at the soil horizon or within structures, and sheltered from the wind. Once sampled, the sorbent tubes were sealed with Teflon® tape and then sent to the ChemCentre in Western Australia to be analysed by cold vapour atomic absorption spectrometry per NIOSH Method 6009 (Eller & Cassinelli Citation1994).
Results
Water chemistry and Hg speciation data are shown for the Waikiore Stream and processing area at Puhipuhi Mine ( and ). Around the processing area, the pH of standing water was acidic to neutral, ranging from 2.7 to 7.4; water trapped in the cooling troughs had pH values within the range 5.2–6.4, similar to the background pH of 4.0–5.5 from the surrounding forested area (Craw et al. Citation2002). Concentrations of filtered HgT were highest in the portion of stream below the dam (219–240 ng L−1) in samples PP1 and PP5, whereas above the dam HgT was measured at c. 118 ng L−1. The lowest concentration of HgT was found in the creek between the quarry and the dam at 69.6 ng L−1. Filtered MeHgT concentrations were highest closer to the dam (1.41–1.95 ng L−1). Further downstream, MeHgT concentrations were 0.637–0.823 ng L−1, similar to values measured above the dam (0.706–0.823 ng L−1).
Table 3 Total mercury (HgT), methylmercury (MeHgT) and gaseous elemental mercury (Hg0) of sediments, soils, water and vegetation of Puhipuhi Mine, published values for other Hg mine sites, regional baselines and regulatory values.
The HgT content of soils and sediments varied across the processing area at Puhipuhi (). The highest concentrations were found at Site D, the remains of the pipe exchange, and at Site A, the exhauster/fan (529–1748 μg g−1 and 37.8–1486 μg g−1, respectively). Sediments from the pipe battery, Site E, and the water holding tanks, Site F, had the lowest concentrations of HgT (39.4 μg g−1 and 123 μg g−1, respectively). Sediments sampled from one of the condensing towers, Site C, had much higher HgT than soils collected from near the tower (353 μg g−1 versus 35.3–50.5 μg g−1). Very low concentrations of gaseous elemental mercury (Hg0) were detected across the processing area (0.06–0.5 ng m−3). A background air sample taken at Puhipuhi Rd near the entrance to the mine site was below the detection limit (<0.01 µg Hg on the sorbent tube).
Discussion
Background HgT levels are typically of the order 0.04–74 ng L−1 for most Northern Hemisphere lakes and 1–7 ng L−1 for most northern rivers and streams (USEPA Citation2001). Background MeHgT levels in surficial waters range from 0.04 to 0.8 ng L−1 (Krabbenhoft et al. Citation2007). For New Zealand, a series of legislative standards establish limits for HgT and MeHgT in drinking water, fish, and aquatic ecosystems based on these background concentrations (Chrystall & Rumsby Citation2009). Measurements of the distribution and abundance of HgT and MeHgT at the Puhipuhi Hg mine provide important data for comparison of Hg speciation and concentration in local and regional waterways. Elevated filtered HgT levels in Waikiore Stream at Puhipuhi (c. 70–240 ng L−1), and the fractionation of HgT as MeHgT, are within the range of previously published values for contaminated mine sites; see (Ganguli Citation2000; Rytuba Citation2000; Scudder et al. Citation2009; Kocman et al. Citation2010). Filtered water concentrations of HgT at Puhipuhi are below New Zealand’s 0.007 mg L−1 (7000 ng L−1) maximum acceptable value (MAV) for inorganic Hg in drinking water (Ministry of Health Citation2013). However, they are above the ANZECC and ARMCANZ (Citation2000) water quality guideline trigger value of 60 ng L−1 Hg for the protection of aquatic ecosystems. This value is lower than both the chronic continuous concentration (CCC) for long-term exposure to aquatic organisms (770 ng L−1) and the chronic maximum concentration (CMC) for short-term exposures set by the US EPA (1400 ng L−1) (USEPA Citation2013).
Values for HgT upstream (PP6) of the tips are lower than those observed below the tips, indicating probable leaching of Hg from mine waste. Craw et al. (Citation2000) estimated from leaching experiments that 10–100 ppb of Hg could be released in low-pH (1–3) conditions from Puhipuhi quarry rock, and concentrations of up to 100 ng L–1 HgT would be expected in waters near mineralised deposits. Concentrations of HgT exceed 100 ng L−1 in waters adjacent to both tips (PP1, PP4, PP5). Despite increased concentrations of HgT, MeHgT values above and below the dam are roughly the same. A low fraction (<1%) of HgT as MeHgT occurs in Puhipuhi stream waters, which is typical for streams in mined areas (versus un-mined areas) (Scudder et al. Citation2009). The dammed portion of the stream had the highest MeHgT concentrations (1.95 ng L−1) and highest fraction of HgT as MeHgT (1.6%), and has the greatest capacity to methylate Hg of the areas sampled, likely correlating to factors such as dissolved organic matter, pH, chloride and sulphate (Compeau & Bartha Citation1985; Gilmour et al. Citation1998; Benoit & Gilmour Citation1999; Ullrich et al. Citation2001; Benoit et al. Citation2003). The results presented here are a preliminary snapshot; MeHgT measurements must be taken routinely for water and sediments in order to understand the bioavailability of Hg from Puhipuhi to methylating bacteria, and the potential for MeHgT accumulation in local aquatic or avian fauna and flora.
The global average of HgT in uncultivated soils falls within the range 0.045–0.16 μg g−1 (Siegel Citation2002). Natural concentrations of HgT in soil can depend greatly on the parent rock and mineral material which the soil was derived from. In New Zealand, volcanic soils and soils in geothermal areas (e.g. Auckland and the Ngāwhā geothermal field) have slightly inflated concentrations of HgT compared to global values (<0.03–0.45 μg g−1 and 0.017–0.35 μg g−1 respectively) (Davey & van Moort Citation1986; ARC Citation2001). Craw et al. (Citation2002) used rocks from the South Island that were comparable to those found in the Puhipuhi region to establish regional backgrounds of 0.1–0.25 ppm HgT for soils from unweathered metagreywacke and 0.04–0.14 ppm from clay-altered greywacke and metamorphosed basalts. In the same study, mineralised rocks from Puhipuhi had HgT concentrations 1–100 ppm above regional background and the HgT content of Puhipuhi region subsoils (C-horizon) were highly variable, ranging from 0.1–100 ppm (Craw et al. Citation2002).
Soil and sediment HgT concentrations at Puhipuhi Mine are inflated compared to regional baselines; they are up to 2–3 orders of magnitude above the global average and similar to values reported for mine surface soils (100–1000 μg g−1; ). At the processing site, elevated concentrations of HgT at Sites D and E (pipe exchange and pipe battery/cooling troughs, respectively) are attributed to deposition of elemental mercury (Hg0) released during heating of the ore and by cooling and trapping of the Hg vapour. Elevated HgT concentrations in soils near condensing towers and the exhaust fan (Sites C and A, respectively) are most likely from emission deposition of condenser soot (fine-grained particulates of cinnabar that travel with Hg vapour) and Hg0 that escaped condensation and collection at Site D. Elevated concentrations of HgT are observed away from towers and structures (Site C and Site F), which could be from physical placement of condenser soot, emission deposition of vapours, mechanical dispersion or aqueous dissolution of Hg0 and cinnabar in surface waters; these processes have been observed at other historic Hg mine sites (Navarro et al. Citation2005; DeGraff et al. Citation2007).
Elemental Hg levels measured in the air within structures and directly above soils in the processing plant area (0.06–0.50 ng m−3) are similar to typical ambient air in New Zealand (0.42–3.1 ng m−3), and well below the New Zealand ambient air quality guideline limit of 0.33 μg m−3 Hg0 (Chrystall & Rumsby Citation2009). These concentrations are much lower than values measured at other historic Hg mines (>300 ng m−3) (Navarro et al. Citation2005; DeGraff et al. Citation2007; Gosar & Teršič Citation2012). The concentration of gaseous Hg at Site A (0.16–0.50 ng m−3) is several orders of magnitude lower than expected for soil that contains upwards of 1000 ppm HgT. Considering the standard Gibbs energy (ΔG°) of Hg0 vaporisation (Hg0(l) ⇔ Hg0(g)) as 31.85 kJ mol−1, the Keq of the reaction at 15°C (ΔG° = –RT ln Keq, R = 8.314 J mol−1 K−1) is 1.67× 10⁻⁶ (Linstrom & Mallard Citation2001). For a range of Hg0(l) of 30–1400 ppm, the expected equilibrium Hg0(g) would be c. 50–2300 ng m−3, similar to values measured at other mine sites (refer to ). Sampling conditions at Puhipuhi do not provide equilibrium measurements of Hg0(g), but a snapshot of the flux of Hg0(g) from soils and structures. Either the sampling is inefficient in accurately capturing the flux of Hg0 from the soil, or the low concentration of Hg0(g) measured at Site A suggests that the majority of HgT measured in the topsoil is not Hg0(l) but matrix-bound Hg species. Precipitation of Hg with chloride, phosphate, carbonate and hydroxides from leachate, and adsorption of Hg species (e.g. Hg2+, Hg22+) by clay minerals, oxides and organic matter, are key processes in the retention of Hg in soils (McLean & Bledsoe Citation1992; Steinnes Citation2013). The mobility of Hg species in soils is highly dependent on soil pH and redox conditions. In the acidic soils of Puhipuhi region (pH 4–5.5), oxidised Hg species likely complex with chloride forming HgCl20(aq) or adsorb to organic matter, inhibiting volatilisation of Hg0 from the soil matrix (McLean & Bledsoe Citation1992; Scudder et al. Citation2009; Steinnes Citation2013). Mercury species originating from the host rock/ore could be present as cinnabar (HgS) which has low solubility at low pH, or as a minor impurity (< 1 wt%) in iron sulphide and barium phosphate minerals which are highly soluble in low pH conditions (Craw et al. Citation2000).
Degassing of Hg from soils can fluctuate daily and seasonally, and continuous gaseous Hg monitoring (e.g. Tekran® 2537 automated ambient air analyser) can be expensive and time consuming. Mosses are exposed to heavy metals through wet and dry deposition (e.g. rain water or absorbed to dust) rather than uptake from soil, and are indicators of Hg mobilisation in air at contaminated sites (Yeaple Citation1972). Enriched concentrations of HgT (>1 ppm) are typical for moss from Hg-contaminated sites (geothermal plants, chlor-alkali works and abandoned Hg mines; Yeaple Citation1972; Lodenius Citation1981; Baldi Citation1988; Qiu et al. Citation2005). Mercury was detectable in moss collected from a cooling trough at Site E (9.1 µg g−1) and further sampling of moss across the Puhipuhi site could be used to measure the dispersion of Hg in air. Mercury adsorbed to dust, rather than volatilisation of Hg0 from soil, may be a significant factor in the remobilisation and dispersion of Hg across the Puhipuhi processing site.
Lower pH waters (pH < 4.5) at the site (including standing water in structures) are indicative of localised acid mine drainage formation (i.e. oxidative dissolution of metal sulphides), and these waters may assist in the leaching of Hg from surficial soils during rainfall runoff (Gray et al. Citation2002b). However, erosion of soils and carry-off of soil during rainfall are likely to be greater factors in controlling the mobilisation of Hg across the site and to the Waikiore Stream. Further work, including geochemical analysis of surface soils (upper 10 cm) as well as sub-soils (C-horizon) and pH-controlled leaching experiments, would enhance our understanding of the speciation state of Hg in Puhipuhi soils and how they may be mobilised.
Conclusions
At Hg mine sites, the three main pathways for release of Hg are: (1) gaseous elemental Hg from processing equipment and soils; (2) leaching of soluble Hg species from processing area soils and mine waste; and (3) soil erosion and runoff of insoluble Hg species from the processing area and unroasted ore from mine waste. This study provides the first attempt at quantifying the above pathways at the Puhipuhi mine and insights into future work. The abandoned mine site at Puhipuhi follows similar contamination patterns surveyed at Hg mine sites in the Western United States (DeGraff et al. Citation2007). High HgT concentrations are found in the processing site, particularly around structures where Hg was released from ore through high-temperature processing equipment. At Puhipuhi, the most contaminated areas sampled were those historically exposed to Hg vapours (exhaust fan, condensing towers and cooling troughs). Gaseous Hg0 levels detected in structures and topsoil were quite low compared to other Hg mine sites where HgT in soils also exceeded 1000 ppm (DeGraff et al. Citation2007; Rimondi et al. Citation2012). We speculate that volatilisation of Hg0 from processing areas does not contribute significantly to contamination at Puhipuhi. The advection and dispersion of insoluble and soluble Hg species across the site from rainfall runoff and deflation of topsoil could be a major control on Hg contamination at Puhipuhi. This is supported by elevated HgT concentrations in soils from areas not directly involved in the separation and collection of Hg ore, such as the water holding tanks at Site F. A more extensive soil survey, including deeper soil profiles, and the inclusion of more sampling locations removed from the processing area, would help identify the advection and dispersion of Hg from hotspots across the Puhipuhi mine site.
At Puhipuhi, the mine waste tips are located up-gradient from the Waikiore Stream. Elevated filtered HgT and MeHgT concentrations measured in Waikiore Stream near the dump sites suggest that Hg has been released from waste rock and the processing areas, potentially to undergo methylation. The positioning and content of the waste rock tips therefore poses a significant contamination risk, as Hg can be released from mine waste calcine and transported into the local catchment. Future investigations should further assess the potential for Hg dispersion by Waikiore Stream from the site into the receiving environment.
References
- ANZECC, ARMCANZ 2000. Australian and New Zealand guidelines for fresh and marine water quality. Australian and New Zealand Environment and Conservation Council and Agriculture and Resource Management Council of Australia and New Zealand, Canberra. Pp. 1–103.
- ARC 2001. Background concentrations of inorganic elements in soils from the Auckland region. ARC Technical Publication. http://www.aucklandcity.govt.nz/council/documents/ ( accessed 29 July 2013).
- Baldi F 1988. Mercury pollution in the soil and mosses around a geothermal plant. Water, Air, and Soil Pollution 38: 111–119.
- Benoit JM, Gilmour CC, Heyes A, Mason RP, Miller CL 2003. Geochemical and biological controls over methylmercury production and degradation in aquatic ecosystems. ACS Symposium Series 835: 262–297. 10.1021/bk-2003-0835.ch019
- Benoit JM, Gilmour CC 1999. Sulfide controls on mercury speciation and bioavailability to methylating bacteria in sediment. Environmental Science and Technology 33: 951–951. 10.1021/es9808200
- Butcher M 2010. The Puhipuhi Mercury Mine history and site description. http://www.doc.govt.nz/conservation/historic/by-region/northland/whangarei/puhipuhi-mercury-mines ( accessed 26 April 2012).
- Christie T, Brathwaite B 1995. Mineral commodity report 8—Mercury. New Zealand Mining 17: 34–39.
- Chrystall L, Rumsby A 2009. Mercury inventory for New Zealand 2008. Technical Report to the New Zealand Ministry of Environment. Auckland, Pattle Demalore Partners Ltd. 136 p.
- Compeau GC, Bartha R 1985. Sulfate-reducing bacteria: principal methylators of mercury in anoxic estuarine sediment. Applied and Environmental Microbiology 50: 498–502.
- Craw D, Chappell D, Black A 2002. Surface run‐off from mineralised road aggregate, Puhipuhi, Northland, New Zealand. New Zealand Journal of Marine and Freshwater Research 36: 105–116. 10.1080/00288330.2002.9517074
- Craw D, Chappell D, Reay A 2000. Environmental mercury and arsenic sources in fossil hydrothermal systems, Northland, New Zealand. Environmental Geology 39: 875–887. 10.1007/s002549900068
- Davey HA, van Moort JC 1986. Current mercury deposition at Ngawha Springs, New Zealand. Applied Geochemistry 1: 75–93. 10.1016/0883-2927(86)90039-9
- DeGraff JV, Rogow M, Trainor P 2007. Approaches to contamination at mercury mill sites: Examples from California and Idaho. Reviews in Engineering Geology 17: 115–134.
- Eller PM, Cassinelli ME 1994. NIOSH manual of analytical methods. Cincinnati, OH, National Institute for Occupational Safety and Health.
- Ferrar HT 1925. The geology of the Whangarei–Bay of Islands subdivision, Kaipara division. By authority WAG Skinner. Wellington, Government Printer.
- Ganguli PM 2000. Mercury speciation in drainage from the New Idria mercury mine, California. Environmental Science and Technology 34: 47–73. 10.1021/es991364y
- Gilmour CC, Riedel GS, Ederington MC, Bell JT, Gill GA, Stordal MC 1998. Methylmercury concentrations and production rates across a trophic gradient in the northern Everglades. Biogeochemistry 40: 327–345. 10.1023/A:1005972708616
- Gosar M, Teršič T 2012. Environmental geochemistry studies in the area of Idrija mercury mine, Slovenia. Environ Geochem Health 34(1): 27–41. 10.1007/s10653-011-9410-6
- Gray JE, Theodorakos PM, Bailey EA, Turner RR 2000. Distribution, speciation, and transport of mercury in stream-sediment, stream-water, and fish collected near abandoned mercury mines in southwestern Alaska, USA. The Science of the Total Environment 260(1–3): 21–33.
- Gray JE, Crock JG, Fey DL 2002a. Environmental geochemistry of abandoned mercury mines in West-Central Nevada, USA. Applied Geochemistry 17: 1069–1079.
- Gray JE, Crock JG, Lasorsa BK 2002b. Mercury methylation at mercury mines in the Humboldt River Basin, Nevada, USA. Geochemistry: Exploration, Environment, Analysis 2: 143–149. 10.1016/S0883-2927(02)00004-5
- Gray JE 2003. Leaching, transport, and methylation of mercury in and around abandoned mercury mines in the Humboldt River Basin and surrounding areas, Nevada. US Geological Survey Bulletin 15.
- Gray JE, Greaves IA, Bustos DM, Krabbenhoft DP 2003. Mercury and methylmercury contents in mine-waste calcine, water, and sediment collected from the Palawan Quicksilver Mine, Philippines. Environmental Geology 43(3): 298–307.
- Gray JE, Plumlee GS, Morman SA, Higueras PL, Crock JG, Lowers HA et al. 2010. In vitro studies evaluating leaching of mercury from mine waste calcine using simulated human body fluids. Environmental Science and Technology 44: 4782–4788. 10.1021/es1001133
- Henderson J 1944. Cinnabar at Puhipuhi and Ngawha, North Auckland. NZ Journal of Science and Technology 26: 47–60.
- Hoggins FE, Brooks RR 1973. Natural dispersion of mercury from Puhipuhi, Northland, New Zealand. New Zealand Journal of Marine and Freshwater Research 7: 125–132. 10.1080/00288330.1973.9515459
- Kocman D, Kanduč T, Ogrinc N, Horvat M 2010. Distribution and partitioning of mercury in a river catchment impacted by former mercury mining activity. Biogeochemistry 104: 183–201. 10.1007/s10533-010-9495-5
- Krabbenhoft DP, Engstrom D, Gilmour C, Harris R, Hurley JP and Mason RP 2007. Monitoring and evaluating trends in sediment and water indicators. In: Harris R, Krabbenhoft DP, Mason R, Murray MW, Reash R, and Saltman T eds. Ecosystem responses to mercury contamination: indicators of change. Webster, NY: SETAC. Pp. 47–86.
- Linstrom PJ, Mallard WG 2001. NIST Chemistry webbook. NIST standard reference database No. 69.
- Lodenius M 1981. Regional distribution of mercury in Hypogymnia physodes in Finland [air pollution]. Ambio 10.
- McLean JE, Bledsoe BE 1992. Behaviour of metals in soils (EPA Ground Water Issue, EPA 540-S-92-018: 25 p.). Washington, DC: Environmental Protection Agency.
- Ministry of Health 2013. Guidelines for drinking-water quality management for New Zealand 2013. 3rd edition. Wellington, Ministry of Health.
- Navarro A, Biester H, Mendoza JL, Cardellach E 2005. Mercury speciation and mobilization in contaminated soils of the Valle del Azogue Hg mine (SE, Spain). Environmental Geology 49: 1089–1101. 10.1007/s00254-005-0152-6
- Northland Regional Council 2002. Groundwater. In: Northland Regional Council State of the Environment Report 2002. Pp. 115–137.
- O’Brien J 1946. Mines Statement. Appendix to the Journals of the House of Representatives Pp 1–56.
- Olson ML, DeWild JF 1999. Techniques for the collection and species-specific analysis of low levels of mercury in water, sediment, and biota. US Geological Survey Water-Resources Investigations Report. Pp. 99–4018.
- Olund SD 2004. Methods for the preparation and analysis of solids and suspended solids for total mercury. Reston, VA: US Department of the Interior, US Geological Survey.
- Qiu G, Feng X, Wang S, Shang L 2005. Mercury and methylmercury in riparian soil, sediments, mine-waste calcines, and moss from abandoned Hg mines in east Guizhou province, southwestern China. Applied Geochemistry 20: 627–638.
- Rimondi V, Gray JE, Costagliola P, Vaselli O, Lattanzi P 2012. Concentration, distribution, and translocation of mercury and methylmercury in mine-waste, sediment, soil, water, and fish collected near the Abbadia San Salvatore mercury mine, Monte Amiata district, Italy. The Science of the Total Environment 414: 318–327. 10.1016/j.scitotenv.2011.10.065
- Rytuba JJ 2000. Mercury mine drainage and processes that control its environmental impact. The Science of the Total Environment 260: 57–71. 10.1016/S0048-9697(00)00541-6
- Rytuba JJ 2003. Mercury from mineral deposits and potential environmental impact. Environmental Geology 43(3): 326–338.
- Scudder BC, Chasar LC, Wentz DA, Bauch NJ, Brigham ME, Moran PW et al. 2009. Mercury in fish, bed sediment, and water from streams across the United States, 1998–2005. Scientific Investigations Report 2009–5109.
- Siegel FR ed. 2002. Environmental geochemistry of potentially toxic metals. Berlin, Springer. 218 p.
- Steinnes E 2013. Mercury. In: Alloway BJ ed. Heavy metals in soils: trace metals and metalloids in soils and their bioavailability. 3rd ed. Berlin, Springer. Pp. 411–428.
- Stetson SJ, Gray JE, Wanty RB, Macalady DL 2009. Isotopic variability of mercury in ore, mine-waste calcine, and leachates of mine-waste calcine from areas mined for mercury. Environmental Science and Technology 43: 7331–7336. 10.1021/es9006993
- Takaya M, Joeng JY, Ishihara N, Serita F, Kohyama N 2006. Field evaluation of mercury vapor analytical methods: comparison of the “double amalgam method” and ISO 17733. Industrial Health 44: 287–287. 10.2486/indhealth.44.287
- Ullrich SM, Tanton TW, Abdrashitova SA 2001. Mercury in the aquatic environment: a review of factors affecting methylation. Critical Reviews in Environmental Science and Technology 31: 241–293. 10.1080/20016491089226
- UNEP 2013. Minamata convention on mercury—text and annexes. United Nations Environment Programme. Pp. 1–69.
- USEPA 2001. Mercury update: impact on fish advisories. U.S. Environmental Protection Agency Fact Sheet. Pp. 1–10.
- USEPA 2013. Mercury—Law and Regulations, U.S. Environmental Protection Agency. http://www.epa.gov/hg/regs.htm ( accessed 11 September 2012).
- Vaselli O, Higueras P, Nisi B, María Esbrí J, Cabassi J, Martínez-Coronado A et al. 2013. Distribution of gaseous Hg in the Mercury mining district of Mt. Amiata (Central Italy): A geochemical survey prior the reclamation project. Environmental Research 125: 179–187.
- Webb PC 1940. Mines Statement. Appendix to the Journals of the House of Representatives. Pp. 1–102.
- Webb PC 1941. Mines Statement. Appendix to the Journals of the House of Representatives. Pp. 1–80.
- Wiederhold JG, Smith RS, Siebner H, Jew AD, Brown GE, Bourdon B et al. 2013. Mercury isotope signatures as tracers for Hg cycling at the New Idria Hg mine. Environmental Science and Technology 47: 6137–6145.
- Yeaple DS 1972. Mercury in bryophytes (moss). Nature 235: 229–230. 10.1038/235229a0
- Yin R, Feng X, Wang J, Bao Z, Yu B, Chen J 2013. Mercury isotope variations between bioavailable mercury fractions and total mercury in mercury contaminated soil in Wanshan Mercury Mine, SW China. Chemical Geology 336: 80–86. 10.1016/j.chemgeo.2012.04.017