
ABSTRACT
The Fox Peak and Forest Creek Faults in South Canterbury show evidence for segmentation based on the surface expression of late Quaternary faulting. Slip rates were calculated at over 100 sites along the Fox Peak Fault from (a) global positioning system (GPS) and total station fault scarp profiles; (b) field measurements of fault geometry and kinematics; and (c) age data from infrared stimulated luminescence, Schmidt hammer exposure-age dating and regional map correlations. Near the centre of fault segments, maximum slip rates for the Fox Peak Fault reach c. 1.6–1.7 mm yr−1, whereas an average slip rate of c. 1–1.5 mm yr−1 summed across the Forest Creek and Fox Peak Faults falls below rates derived by geodetic models. The geomorphology and single event displacements suggest segment-breaching ruptures of the Fox Peak Fault during late Quaternary earthquakes with moment magnitudes (MW) of 7.0–7.2. This study highlights the role that evaluations of landscape evolution in reverse faulting regimes can play in assessing seismic hazard.
Introduction
Fault segmentation is an important component of understanding both seismic hazard and mountain range-scale landscape evolution. Segment boundaries can be identified by (a) changes in fault geometry or surface discontinuities (e.g. step-overs or cross-faults); (b) variations in structural or topographic relief; (c) slip rate or paleoearthquake age variations; and (d) historical rupture limits (Knuepfer Citation1989; DePolo et al. 1991; McCalpin Citation2009). For most active faults, (d) is not available; seismic hazard evaluations rely on identifying (a) through (c) for delineating potential barriers to earthquake rupture propagation (Wesnousky Citation2006). Only a few studies have systematically examined the segmentation of continental reverse and thrust faults (Arrowsmith & Strecker Citation1999; Densmore et al. Citation2007, Citation2010; Amos et al. Citation2010, Citation2011; Hubbard et al. Citation2014), despite the propensity for reverse faults to rupture multiple segments and faults in historical earthquakes (Officers of the Geological Survey Citation1983; Rubin Citation1996; Wesnousky Citation2008; Field et al. Citation2013).
In New Zealand, reverse fault segmentation and growth over 106–year timescales have been studied via the topographic and drainage evolution of anticlinal ranges in Otago (Jackson et al. Citation1996, Citation2002). The segmentation of faults and folds over 104–105–year timescales has also been studied in relation to displacement patterns along the Ostler Fault (Davis et al. Citation2005; Amos et al. Citation2007, Citation2010). Whether fault segments persist through these different timescales to influence the magnitudes and slip distributions in earthquakes is not well known.
In this article, we use neotectonic mapping, high-resolution surveying and Quaternary geochronology to investigate the temporal and spatial evolution of the reverse-slip Fox Peak and Forest Creek Faults in the central South Island, New Zealand. Both faults have excellent surface expressions of Late Pleistocene–Holocene faulting and provide the opportunity to study fault segmentation over 103 to 106–year timescales. Slip rates are estimated at over 100 locations along the Fox Peak Fault and compared with geodetic rates. Segmentation (e.g. geometric, structural and slip rate-based) is considered over timescales ranging from 1000–year slip rates to the structural and topographic evolution over millions of years. The results have implications for expected rupture segmentation, earthquake magnitudes and regional tectonics.
Geologic setting and previous work
New Zealand is situated at the margin of the obliquely convergent Pacific and Australian plates (e.g. Walcott Citation1998). Geodetically derived convergence rates at the plate boundary in New Zealand range from 30–50 mm yr−1 (Wallace et al. Citation2007; DeMets et al. Citation2010). Approximately 75% of this oblique convergence in the South Island is accommodated by slip on the Alpine Fault, a 400 km-long, predominantly right-lateral fault. In the central South Island, the remaining c. 25% is distributed primarily onto structures east of the Alpine Fault in the Pacific Plate (Walcott Citation1998; Norris & Cooper Citation2001; Sutherland et al. Citation2006).
A zone of north–northeast-striking, predominantly west-dipping reverse faults c. 70 km from the plate boundary, including the Lake Heron, Forest Creek, Fox Peak and Ostler Faults, corresponds with a secondary maximum in convergence and strain rates (e.g. Beavan & Haines Citation2001; Wallace et al. Citation2007) (). Seismic and magnetotelluric surveys indicate that these faults may comprise a semi-continuous zone of orogen-scale backthrusts of the Alpine Fault (Wannamaker et al. Citation2002) and have surface traces that indicate ongoing activity through at least the latest Pleistocene (Beanland Citation1987; Berryman et al. Citation2002). Faults are moderately to steeply dipping at the surface and are listric at depth. Historical seismicity in this region is low, but focal mechanisms from micro-seismicity studies indicate predominantly reverse-slip, with some sinistral strike-slip (Fox Citation1987; Leitner et al. Citation2001).
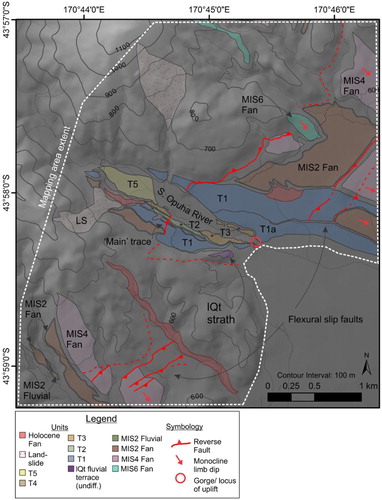
Figure 1. Location map of study site in A, New Zealand and B, relative to other central South Island reverse faults (OF: Ostler Fault; NF: northern Nevis–Cardrona and Grandview fault; DF: northern Dunstan Fault) (modified after Langridge et al. Citation2016). C, Surface traces of the Fox Peak (FPF) and Forest Creek (FCF) Faults in South Canterbury, New Zealand (inset) mapped on a 15 m digital elevation model-derived hillshade model. Three sections of the Fox Peak Fault were identified for mapping purposes (from south to north): Cloudy Peaks, Ribbonwood and Bray sections. Areas of detailed mapping along these sections are shown as white rectangles with figure references indicated. Arrows on structural lines demarcate fold limb dip directions (i.e. strike ridges). FC/SO divide is the drainage divide between the Forest Creek and South Opuha Rivers.
Geologically derived slip rates of c. 1–2 mm yr−1 are well-established on the Ostler and Irishman Creek Faults (Amos et al. Citation2007, Citation2010). Other faults like the Lake Heron, Forest Creek and Fox Peak Faults have not yet had slip rates established by detailed field studies. Where geologic slip rates are available or inferred from preliminary studies, geodetic slip rates are 2–3 times higher (Beavan et al. Citation2007; Upton et al. Citation2004; Amos et al. Citation2007, Citation2010; Wallace et al. Citation2007). Significant strike-slip (2–5 mm yr−1) is suggested by the geodetic models (Wallace et al. Citation2007), but not observed in the field (e.g. Amos et al. Citation2007). If geodetic models more accurately predict fault slip rates and kinematics in this region, current estimates of the regional seismic hazard might be underestimated (Stirling et al. Citation2012).
The Fox Peak Fault is a c. 40 km-long range front structure that bounds the Sherwood and southern Two Thumb ranges to the west and the Fairlie Basin to the east (C). The ranges are composed primarily of Permo-Triassic Torlesse greywacke and semi-schist. (Cox & Barrell Citation2007) (Figure S1). Strike ridges and synclines of Tertiary sandstones, limestones and siltstones have been progressively uplifted since the Miocene and in places define the margins of the Fairlie Basin (James Citation1998; Cox & Barrell Citation2007) (). The Fox Peak Fault and related structures have thus been active since at least the Late Miocene–Pliocene (e.g. Upton et al. Citation2004; Ghisetti et al. Citation2007). It is likely that an inverted normal fault from a period of Miocene extension as has been proposed for the Ostler Fault to the south (Ghisetti et al. Citation2007). Field studies and geophysical surveys show that the fault is listric at shallow depths (e.g. Long et al. Citation2003; Figure S2).
Peaks in the Sherwood and Two Thumb Ranges () reach over 2000 m in places and constitute some of the highest topography east of the central Southern Alps. Tarns and lateral moraines indicate that widespread mountain glaciers occupied the high catchments during the Last Glacial Maximum (LGM). Post-LGM alluvial fans and landslides dominate the geomorphology along the northern Sherwood Range front. Fill-cut and strath terraces of variable age are present where major streams emerge from the Two Thumb and Sherwood Ranges.
Previous studies of the Fox Peak Fault have focused on structural mapping and reconnaissance of active faulting (Beanland Citation1987; Cutten Citation1990; James Citation1998; Upton et al. Citation2004). Uplift rates of c. 1 mm yr−1 have been assigned based on estimations of faulted terrace ages and offsets (Beanland Citation1987; James Citation1998; Berryman et al. Citation2002; Upton et al. Citation2004). Evidence of strike-slip motion is limited to a proposed offset of an abandoned channel along the northern portion of the fault that could indicate up to 2.5 mm yr−1 of lateral slip (Cutten Citation1990; James Citation1998; Berryman et al. Citation2002). Therefore, the net geologic slip rate of the Fox Peak Fault alone could accommodate a significant portion of the geodetically derived slip rates (2.5–7 mm yr−1) for the eastern Southern Alps (Wallace et al. Citation2007; Litchfield et al. Citation2014).
The Forest Creek Fault is identified as an uphill facing scarp along the eastern Two Thumb Range (). Northeast of the field area, the fault-related deformation becomes more diffuse and branches into oppositely verging folds underlying glacial moraines and river terraces in the Rangitata River valley (Cox & Barrell Citation2007). Upton et al. (Citation2009) continue the Forest Creek Fault northward to join the Lake Heron Fault, with a total possible length of c. 80 km. In this study, we focus on the fault traces bounding the Two Thumb Range ().
Methodology
Fault section and segmentation terminology
We assessed three classes of fault segmentation in order to evaluate earthquake hazards and the nature of landscape evolution along the Fox Peak and Forest Creek Faults. Criteria used to assess segmentation classes include geometric and geomorphologic indicators, structural and geologic indicators, and changes in fault slip rates (modified after Knuepfer Citation1989; DePolo et al. Citation1991; Rubin Citation1996). These classes of fault segments can, but do not always, spatially correlate to earthquake rupture segments, and help to inform hazard estimates and models of fault evolution over different timescales (Arrowsmith & Strecker Citation1999; Wesnousky Citation2006).
Geometric and geomorphologic indicators of segmentation were assessed in this study using satellite imagery and field mapping, and include step-overs, gaps and changes in fault orientation and/or surface trace expression. Mapping was conducted on a combination of 1 m GeoEye satellite imagery and a 15 m digital elevation model. Fault traces and Quaternary geomorphology were mapped by hand and differential GPS (dGPS) in the field.
Structural and geologic indicators of segmentation include cross-faulting or folding, and differences in structural or topographic relief across these features. These were both assessed on the basis of previous geologic mapping and data presented in this study. Hereinafter, geometric and structural segments are referred to as ‘fault sections’ to avoid confusion with slip-rate delineated fault segments.
Delineation of fault segments on the basis of slip rates required detailed surveying, structural mapping and dating to obtain along-strike slip rate gradients. Below, we detail how this information was used to obtain net slip and slip rates.
Net slip
We used the methodology of Thompson et al. (Citation2002) to estimate net slip and slip rates. Scarp profiles were measured using a combination of real-time kinematic (RTK) GPS, dGPS and total station measurements. RTK positions have a typical vertical precision of 15–30 mm and were collected with a Trimble R8 receiver fixed to a stadia rod. It was the preferred method to collect point profiles in the field where practical. A handheld Trimble GeoXH dGPS was used in difficult terrain and to check RTK data on some profiles for critical sites. It has an estimated vertical precision of 10–50 mm. Total station use was restricted to the Cloudy Peaks terraces, where it was used in conjunction with other techniques (Stahl Citation2014). The precision of the Trimble 5600 DR200 total station is <2 mm.
Fault dips were determined in the field by direct measurement in outcrop and trench exposures (e.g. Stahl et al. Citation2016), or estimated via projection across landforms (e.g. terrace risers and treads). Where these data were not available, the fault plane solution for a given area and surface expression of the fault were used to infer a range of fault dips. Where a single fault trace splayed into two or more closely spaced traces at topographic lows, trench data and ‘anastomosing’ fault traces suggest a flattening of the fault plane at the surface (Stahl et al. Citation2016). A range of gentler fault dips was used for net slip calculations at these locations. The position of the fault along the scarp was also determined from a combination of natural exposures and trenches.
Linear regression was used to characterise surfaces displaced by faults and then calculate net slip via Monte Carlo simulations (). Surveyed fault profiles were projected perpendicular to the strike of the fault. The slopes and intercepts of lines fit to the hanging wall, scarp and footwall were determined. The net slip then is a function of these lines, fault dip and the point of intersection of the fault with the scarp face. For input parameters that were quantified by linear regression (e.g. slope and intercept), the mean and standard deviation of those variables were used to define normal distributions for sampling in each iteration of the Monte Carlo simulation (B).
Figure 2. Schematic of the Monte Carlo simulation procedure for calculating net slip and slip rate from field measurements (modified after Thompson et al. Citation2002; Rood et al. Citation2011). A, Surveyed fault profile and parameters required to calculate net slip. B, Probability distributions of inputs (e.g. slope and intercepts of lines fit to surfaces, fault dip, feature age). OSL: Optically stimulated luminescence. C, Histograms of outputs (net slip and slip rates).
Where profiles traversed two or more faults (e.g. widely spaced backthrusts or subsidiary synthetic faults), the survey line was broken into components with the aim of calculating slip on each fault. Where fault geometry was uncertain due to closely spaced backthrust ‘pop-up’ structures, line-length shortening was resolved onto the dominant fault mechanism at the site to calculate net slip. Net slip was calculated from vertical separations of terraces that were discontinuous across a fault by assuming fault, scarp and terrace surface geometries from adjacent sites. Hanging wall gradients of back-tilted terraces were projected near the scarp-hanging wall interface. We do not consider interseismic strain accumulation as a contribution to the observed offset (Thompson et al. Citation2002; Amos et al. Citation2007).
Surface ages
Where possible, infrared stimulated luminescence (IRSL) was used to date silts and sands in exposed alluvial deposits. The multiple aliquot additive dose (MAAD) method was used on 4–11 μm grain feldspar during infrared stimulation. Measurements of radionuclide and water contents, dose rate and equivalent dose, as well as age determinations, were undertaken at the Victoria University of Wellington Luminescence Dating Laboratory. The ages of some regionally extensive fan surfaces were inferred where mapping and correlation with surfaces and deposits of known age allowed some confidence in their approximation (after Cox & Barrell Citation2007; Quigley et al. Citation2007). For river terraces with embedded surface clasts of Torlesse greywacke, Schmidt hammer exposure-age dating (SHD, Stahl et al. Citation2013 and below) was used to derive calibrated ages.
Calibrated exposure-ages of surface clasts on river terraces can be determined via SHD. Schmidt hammer rebound values (R-values) quantify the mechanical integrity of rock by measuring the percentage rebound of a hammer mass in a controlled impact against the surface. Clasts that have been weathering at the surface for a longer time have lower mechanical strength, and thus lower R-values, than clasts that have only recently been exposed. With some numerical (i.e. absolute) age control, a chronofunction relating SH R-value to exposure-age can be constructed and used to obtain the exposure-ages of fluvial terraces (Equation 1). The equation relating Schmidt hammer R-value to age for Torlesse greywacke is(1) where SHR is the median R-value for a population of clasts on a surface, a is a parameter related to local chemical weathering rate (dependent on climate and greywacke lithology) and b is a constant (−0.189). In this study, the methodology for data collection followed that of Stahl et al. (Citation2013) by testing 50–100 clasts per surface.
To calculate exposure ages and associated errors, we modify the simple age calculation of Stahl et al. (Citation2013) (Equation 1) to incorporate terrace order and other known age constraints. The algorithm describing this process is illustrated in . The process uses rejection sampling to reduce the spread in the R-value dataset from independent constraints on terrace formation chronology. In each iteration, ‘final’ R-values are accepted only if each sampled R-value obeys the known terrace order, so that all probability density functions (PDFs) are refined simultaneously. Age distributions are then calculated as in Equation (1), using distributions of R-value medians (SHR) assembled from 100,000 trials ().
Figure 3. Algorithm to calculate SH exposure-age and error using Monte Carlo rejection sampling. Step 1: Conversion of raw histogram of SH values A, to a probability distribution B. Step 2: Random sample selection from B, checked against acceptance/rejection criteria from known terrace order and absolute age constraints C. Step 3: Accepted data used to populate a new distribution D. Step 4: Median of D selected over 100,000 trials and used to produce a final distribution E. Step 5: Calculation of SH exposure age statistics based on distribution E.
At two sites (Cloudy Peaks terraces and the South Opuha River), SHD was used to obtain ages for flights of fluvial terraces. In both instances, semi-schist clasts were avoided during sampling because schist weathers differently than greywacke and schistocity orientation can affect R-values. The possibility that these clasts were inadvertently sampled increases the error in age calculations.
Slip rate estimates
A Monte Carlo simulation was used to calculate slip rates and the uncertainty therein (C) (Thompson et al. Citation2002). Input PDFs of scarp profile regression statistics, fault geometry and surface ages were used to calculate output histograms of net slip and slip rates (). The shape of the input distribution depends on the accuracy to which the input parameter was measured or estimated in the field, or is calculated from SHD ages. Scarp profile intercepts and slopes were modelled as normal PDFs (i.e. defined by a mean and standard deviation). For fault dips, normal PDFs were used where measurements could be confidently taken from nearby outcrops or trenches. Where dip measurements were taken from outcrops not correlating with surface scarps, or were inferred based on scarp morphology, a trapezoidal distribution of dips was used to incorporate the additional uncertainty and a range of most likely values. Trapezoidal distributions of fault position along scarp were derived from measurements in outcrop and subsurface data and vary from site to site. Discrete distributions of the SHD ages (e.g. ) were used rather than specifying a continuous distribution model. Ages constrained by IRSL and mapping were modelled as normal PDFs.
Tectonic geomorphology of the Fox Peak and Forest Creek Faults
Fox Peak Fault
Previous studies (e.g. James Citation1998; Upton et al. Citation2004; Cox & Barrell Citation2007) and reconnaissance mapping for this study indicated that the Fox Peak Fault is divisible into geometrically distinct sections (). These distinctions are based on differences in surface expression of faulting and gaps in the fault trace. From south to north, these are referred to as the Cloudy Peaks, Ribbonwood and Bray sections ().
Cloudy Peaks section
At the Cloudy Peaks terraces (southern Two Thumb Range; , ), four imbricate traces of the Fox Peak Fault are present across a 2–2.5 km-wide zone. The traces vertically displace river terraces located c. 2–90 m above Firewood Stream (). The terraces have previously been mapped as late LGM (c. 16–18 kyr BP) to recent outwash and fill-cut terraces (Beanland Citation1987; Cutten Citation1990; James Citation1998; Upton et al. Citation2004). In natural exposures, the terraces comprise bedrock straths with thin (2–5 m) veneers of fluvial gravel and most are not associated with glacial outwash. The development of the terrace sequence is driven by ongoing incision due to a combination of tectonically controlled uplift and local sediment fluxes (e.g. landslides), as well as climatically controlled sediment supply (Bull Citation1990; Merritts et al. Citation1994; Amos et al. Citation2007). Therefore, the ages of the river terraces do not necessarily correlate to regional glacial cycles or marine isotope stages (MIS). For instance, the abandonment of discontinuous terraces immediately up and downstream of faults (e.g. T7, T6 in ) could be related to tectonic uplift over a single earthquake cycle or landslide-controlled sediment supply in the catchment. The development of more extensive terraces (e.g. T5, T4, T2, T1), with wide straths, is likely to be more strongly influenced by sustained climate-controlled sediment abrasion and supply (e.g. Bull Citation1990; Quigley et al. Citation2007).
Figure 4. Tectonic and Quaternary geomorphic map of the Fox Peak Fault at the Cloudy Peaks terraces. T1–T7 are late Pleistocene fluvial terrace surfaces, with T1 being the highest and oldest terrace; lQt is an older late Quaternary terrace surface (see for specific ages).
The ages of the terraces were constrained by an IRSL sample (WLL946; ) and SHD (). The IRSL sample was taken from fluvial sand in a hand-dug pit in T4 (). The deposit is located near the top of the terrace sequence (i.e. within the ‘lag’ deposit mantling the underlying strath), and its age is therefore representative of the age of abandonment of the terrace. We conducted Schmidt hammer testing on the other terraces in an effort to further constrain the abandonment ages of the terrace treads.
Figure 5. Infrared stimulated luminescence (IRSL) WLL946 sample pit (A, location on ) and B, close-up of sand unit sampled for IRSL.
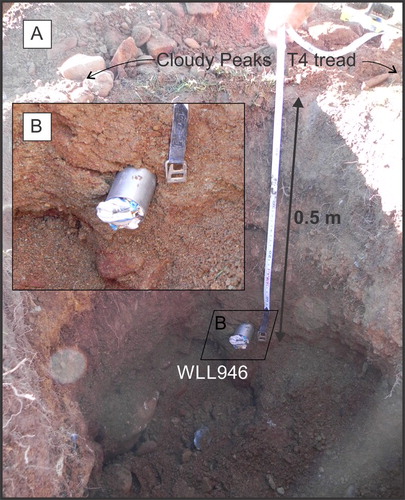
Table 1. Infrared stimulated luminescence (IRSL) sample ages and measurements.
Table 2. Schmidt hammer exposure-age data from river terraces at the Cloudy Peaks terraces.a
All faults exposed in outcrops at the Cloudy Peaks terraces are moderately to steeply dipping at the surface, with the major structures dipping to the northwest (). Outcrop data indicate that the faults are listric and dips decrease at shallow depths (Figure S2). This manifests in the landscape as steep fault scarps (or fold scarps) with gentle backlimbs, similar to the morphology of the folded outwash plains crossing the listric Ostler Fault () (Amos et al. Citation2007, Citation2010).
Figure 6. Stream exposures of faults at Cloudy Peaks (1.85 m tall person for scale). A, T6 displaced by c. 5 m across Fault 2, looking southwest. Inset shows location of fault in B. B, Reverse fault splays in the stream exposure in A. (i) Torlesse greywacke, (ii) terrace gravels entrained in fault zone between fault splays, (iii) terrace gravels. C, Outcrop scale ‘triangle zone’ with facing thrusts and backthrusts offsetting vertically bedded Torlesse greywacke sandstone and argillite, viewed looking northeast. D, Fault plane solution for the entire Cloudy Peaks area. The small component of right-lateral strike slip is not apparent at the surface, and may be related to tear-faulting or transfer structures near this end of the Fox Peak Fault.
River terraces show progressive vertical offset along four reverse fault traces in the field area. In the southeast, a frontal fault (Fault 1, , A) splays at the surface across T5 into a northwest-dipping master fault and an antithetic fault to form a pop-up structure. The next fault to the northwest (Fault 2, , A) displaces every terrace in the field area with exception of T1 (which is not present at the fault), and displaces the youngest mapped terrace (T7). The progressive displacement on this fault through the development of the terrace sequence and the large cumulative displacement suggest that this has been the most active fault since the abandonment of T2.
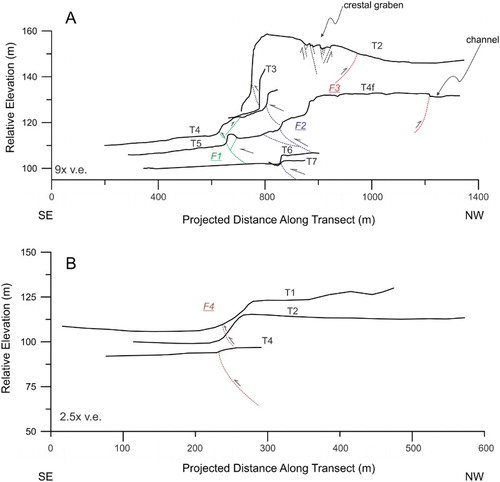
A possible structure cutting T2–T4 is present c. 80 m northwest of Fault 2, although any apparent offset is likely to be enhanced or perhaps produced entirely by local erosion (Stahl Citation2014). Northwest of Fault 2, a backthrust (Fault 3, , A) displaces T2 and T4f (a fill terrace with the same age as T4) on the east side of Firewood Stream, along with T5, T4a, T4 and a late Quaternary terrace remnant on the west side of the stream (). Because of the magnitude of displacement on Fault 3 and location on the ‘backlimb’ of the Fault 2 anticline, it is likely that the two are mechanically linked and slip sympathetically (A). A c. 150 m-wide crestal graben, defined by bending moment (i.e. normal-slip) faults, occupies the hinge zone of the anticline produced by Fault 2 (, A). Local extension is enhanced by antithetic faulting on Fault 3. Fault 4, a northwest-dipping reverse fault, is located 1 km to the north of Fault 3, and displaces T1, T2 and T4 by variable amounts (, B). There is no clear indication of strike-slip along any of the faulted terraces.
Figure 7. Topographic profiles along different age geomorphic surfaces at the Cloudy Peaks terraces (; locations in ). The modern stream gradient has been removed to show the extent of listric folding (e.g. Amos et al. Citation2007). A, The frontal three faults (dips and geometry not drawn to scale) cut across all terraces except T4a and T1 (see for explanation); B, Fault 4 at T1, T2 and T4. Only T4 is displaced by all of the reverse faults.
Immediately southwest of the area shown in , fault traces become less obvious and deformation is accommodated by broad-wavelength folding of terrace surfaces. Structural contours of Barrell and Strong (Citation2012) show that the Fox Peak Fault does not continue south into the Albury Range (). Rather, it is inferred that the fault becomes blind beneath the southwest extent of the Two Thumb Range, where topographic and structural relief decrease with accrued slip on the fault ().
Northeast of the Cloudy Peaks terraces, fault traces become indistinct and are recognised only by topographic lineaments (Stahl Citation2014). Deformation is inferred to be accommodated by folding within a strike ridge of Tertiary sedimentary rocks (Figures 1, S1). The Tertiary strike ridge ends abruptly near the South Opuha River at a northwest-striking fault mapped by James (Citation1998) and Barrell and Strong (Citation2012) (Figures 8, S1). This fault separates Torlesse greywacke in the northeast from Tertiary units to the southwest. Although there is no topographic expression of this fault, the depth to basement increases at the South Opuha River (Barrell & Strong Citation2012), indicating that, by definition, this represents a structural section boundary, with the Ribbonwood section to the north (see description below). To the southwest of this boundary fault (i.e. on the Cloudy Peaks section), northwest-directed faulting of a fan surface with an inferred MIS4 age (c. 70 kyr BP), potentially due to flexural-slip faulting in underlying Tertiary units, suggests that deformation has occurred in the Pleistocene (southern-most traces on ). Younger river terraces show no evidence of faulting or folding here. Steep, bedrock faults observed in outcrops near the Two Thumb Range front are likely to be related to the principal northwest-dipping Fox Peak Fault, but do not show any evidence for late Quaternary displacement (Stahl Citation2014).
Figure 8. Tectonic and Quaternary geomorphic map of the Fox Peak Fault at the South Opuha River area (boundary between Cloudy Peaks and Ribbonwood sections). South of the river, surface expression of faulting is dominated by flexural-slip faults within the Tertiary strike ridge (). At the river, faulting is confined to a single, northwest-dipping trace with a small displacement (c. 1–2 m throw) (compared with Cloudy Peaks, to the south). Terraces are incised into a late-glacial fan (see for specific ages), although higher terraces and fans are also preserved near the river. To the north, flexural-slip faulting is again evident and coincides with a narrow gorge in the South Opuha River (•). The main, range-bounding fault continues to the north but has only intermittent surface expression north of the river. Arrows denote the direction of tilting of late Quaternary fan surfaces (i.e. monocline limb dip).
Ribbonwood section
South Opuha River terraces
The South Opuha River terraces () have formed by incision into fan sediments (Figure S3). The age of the fan deposit is unknown, but the thickness of the deposit and position at the range front indicates that it is probably derived from a late to post-LGM sediment flux (c. 18–14 kyr BP), as is observed elsewhere in Canterbury (Knuepfer Citation1988; Bull Citation1990; Alloway et al. Citation2007). Thus, the degradational river terraces at the range front are probably younger than 18–14 kyr BP. In this study, other fan surfaces above the degradational terraces on the northeast side of the South Opuha River were mapped according to MIS stages (after Cox & Barrell Citation2007) that produce broad age estimates. Where possible, Schmidt hammer testing was conducted on the river terraces to further constrain their abandonment ages ().
Table 3. Schmidt hammer (SH) exposure-age data from the South Opuha River terraces.a
On the south side of the river, a single c. 1 m high scarp crosses the South Opuha River terraces (). The throw is the same on T1, T1a and T2. On the upper fan surface, throw apparently doubles to c. 2 m, although the scarp height has likely been modified by erosion. Some faults were found further into the range, but do not lie along strike of a scarp (Figure S3). On the northeast side of the river, antithetic fault traces c. 2 km downstream of the main trace offset T1 and MIS2/MIS4 fan surfaces (, ). These traces coincide with a narrow bedrock gorge of the South Opuha River and the along-strike projection of inferred flexural-slip faults to the south (). We therefore consider them likely to be flexural-slip faults representing the emerging surface manifestation of the strike ridge to the south, but cannot confirm the mechanism of faulting. The remainder of the Ribbonwood section to the north (northernmost traces on ) consists of disparate fault traces and tilted Late Pleistocene fan surfaces (, ).
Figure 9. Topographic profiles along different age geomorphic surfaces at the South Opuha River terraces (; locations in ) with interpreted structures. Symbols (e.g. solid line, open circles, crosses) are used to differentiate terrace surfaces. The apparently greater offset of T1 on the north side of the river (T1 north) is due to the greater slope of the hanging wall at this location; the net displacement of T1, T2 and T3 are the same when accounting for this effect. Fault dips are not drawn to scale.
A west–northwest striking structure at the northern end of the Ribbonwood section, here named the Stony Creek Anticline (, ), separates the Ribbonwood and the Bray sections of the Fox Peak Fault (). Wind gaps with late Quaternary gravels abandoned along the length of the Stony Creek Anticline () indicate that it has been active in the Quaternary. This L–shaped pattern of interfering faults and folds is common elsewhere in Canterbury (Campbell et al. Citation2012) and produces characteristic secondary folds and faulting (Nicol Citation1993). The re-emergence of Tertiary units in a syncline to the northeast of the Stony Creek Anticline and the change in surface expression of the Fox Peak Fault from the south (, S1) further define a fault section boundary.
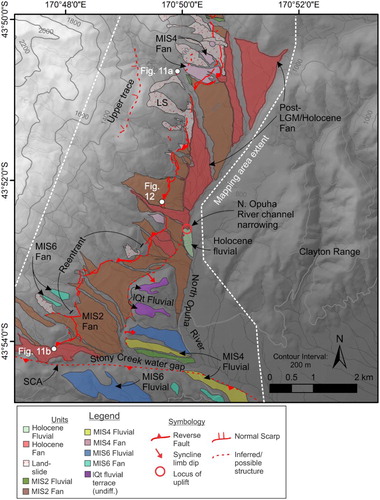
Figure 10. Tectonic and Quaternary geomorphic map of the Bray segment of the Fox Peak Fault (north of the Ribbonwood section, ). Age control and marine isotope stage correlations are discussed in the text. Debris mantled slopes and alluvial fans are not differentiated in this mapping because the former are rare (only present at Fox Peak ski field road) and closely resemble the latter. A northeast–southwest striking monocline (western edge of a syncline not in the map area) has been active in the late Quaternary. Fault traces of the Fox Peak Fault are often sinuous and splay into two or more traces around valleys. (•) Location of the North Opuha River at its narrowest – an effect of the uplift of the frontal monocline. The inferred fault trace shown at the Stony Creek Anticline (SCA) is an estimation of the surface projection of the reverse fault associated with the SCA.
Bray section
North of the Stony Creek Anticline, the main trace of the Fox Peak Fault becomes more continuous and deformation is localised near the range front (). The fault is generally confined to a single trace but splays into two or more sinuous traces near stream valleys. The fault dip in outcrop and as inferred by mapping is c. 55°, although it flattens where the fault crosses valleys in the southwest ().
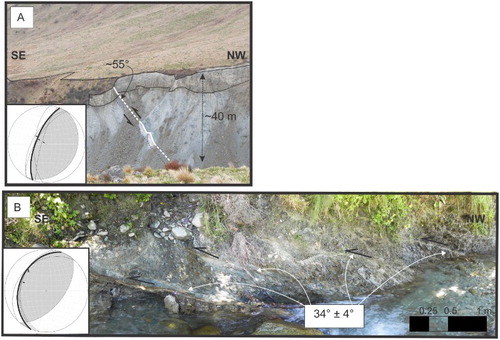
Figure 11. Fault outcrops and dip variability along the Bray segment. Fault plane solutions with the mean fault plane are provided for each class of faulting. A, Moderately to steeply dipping faults are the most common geometries seen in outcrops (although there is no clear surface expression of this fault trace). B, Stream exposure of gently dipping fault splays (with fault dips indicated) coinciding with sinuous fault splays at the surface. See for locations.
Less than 0.5 km north of the Stony Creek Anticline, the northwestern limb of a northeast-trending syncline has uplifted fluvial terraces in the field area (, syncline axis shown in ). This fold enhances local drainage incision and coincides with a reentrant on the Fox Peak Fault (). The terrace sequence has likely formed in response to uplift of the syncline and/or the Stony Creek Anticline (i.e. in a west to east directed water gap, see ). The North Opuha River channel narrows when crossing the fold, also suggesting ongoing uplift (e.g. Amos & Burbank Citation2007).
A prominent scarp is present at an elevation of c. 1300 m (‘upper trace’ on ). It is unclear if this scarp, with apparent normal-slip, is an old, range-bounding reverse fault that has since had its fault zone eroded (James Citation1998), a part of an active range front thrust-wedge, or sackung. As this feature cannot be traced for more than 3 km, has a variable scarp height, and remains at an elevation of c. 1300 m, we consider it most likely to be sackung (e.g. McCalpin Citation2009, p. 575–577), but cautiously identify it as a possible fault on the map ().
Alluvial fans, debris-mantled slopes and landslides that grade to the same, prominent base level (a stream cut riser) above the North Opuha River are the most prevalent Quaternary formations in the area (). For mapping purposes, we tentatively assigned the surfaces a late to post-LGM age, similar to the assumed age of the fan at the South Opuha River. Younger landslides and river terraces that grade to below this prominent riser are offset less across the fault. Older surfaces were mapped based on MIS age correlations of Cox and Barrell (Citation2007) and their positions in the landscape relative to age-dated deposits in the area (see below).
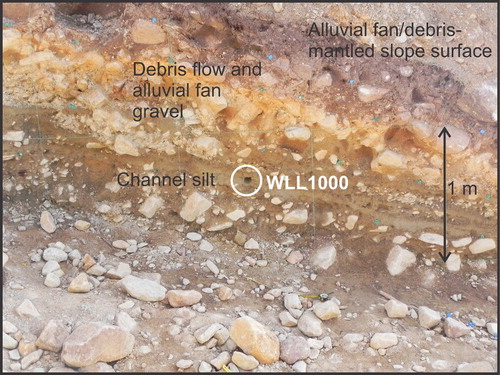
Near Fox’s Peak (location on ), an IRSL sample (sample WLL1000; ) was taken from a channel silt deposit in a paleoseismic trench (). The deposit underlies hillslope deposits and is interpreted to have formed in response to rill wash and erosion in the latest LGM, before abandonment of the surface ().
Figure 12. Locations of infrared stimulated luminescence samples for determination of surface ages. A, At Fox’s Peak ski field road (Bray segment of the Fox Peak Fault). B, At the Cloudy Peaks terraces, T4 (see for location). See for ages.
In the northern part of the field area, the geomorphic expression of faulting rapidly diminishes into a subtle topographic step across a bedrock slope. Clear surface expression of faulting ends near Butler Saddle (), as no definitive evidence of Pleistocene–Holocene faulting could be found in Butlers Creek to the north (Stahl Citation2014). We calculate a total fault length of 36.5 km for the Fox Peak Fault from the three sections above.
Forest Creek Fault
There are two primary mapping regions along the Forest Creek Fault: an east to northeast-striking section along Forest Creek (northern FCF) and a north-striking section that runs from near Mt. Dobson into the upper South Opuha River catchment (southern FCF) (). These two sections are described in detail below.
Northern section at Forest Creek
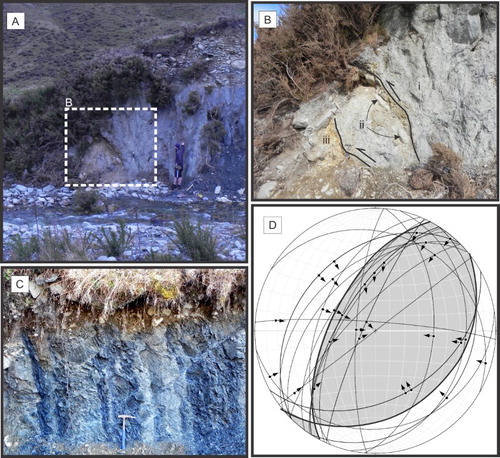
A c. 4 km-long, uphill-facing scarp bounds the Two Thumb Range at Forest and Neutral creeks (). The trace crosses topographic contours, projects along strike to folds near the Rangitata River mapped by Cox and Barrell (Citation2007), and has been imaged dipping deep into the crust (e.g. Wannamaker et al. Citation2002). The scarp has variable height and cuts across apparently youthful hill slopes and channels with no indication of lateral offset (see C caption). Upton et al. (Citation2004) measured west-dipping, high-angle faults and dip-slip striae along strike of the trace. We consider it likely that the normal fault trace seen at the surface is the result of a master reverse fault splaying near the surface in response to the topographic load (e.g. Khajavi et al. Citation2014), as observed with other faults in high relief landscapes.
Figure 13. The Forest Creek Fault (FCF) at Forest Creek. A, Georeferenced aerial photograph (location in ) of fault scarp, which traverses the hillslope for 4 km between the black arrows. The Two Thumb Range is located to the northwest of Forest Creek and the Sherwood Range to the southeast. B, Field photograph looking down onto the FCF scarp and into Forest Creek. C, Field photograph looking along the scarp to the northeast and into a hand-dug exposure of the fault (location of photo shown in B). Relative motion is normal at the surface.
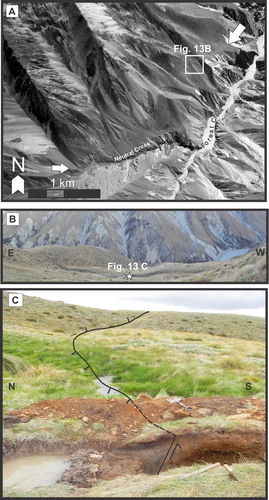
Approximately 2 km southwest of the Neutral Creek–Forest Creek confluence, the trace discontinues (, ). We infer the Forest Creek Fault to follow the Two Thumb Range to the south, following bedrock faults of Cox and Barrell (Citation2007) rather than traces inferred by Upton et al. (Citation2004). Surface expression picks up again in the South Opuha River catchment with a broad uphill-facing scarp.
Southern section at Mt. Dobson
A c. 50 m-high scarp begins 7 km south of the Forest Creek–South Opuha catchment divide and continues until reaching the lower slopes of Mt. Dobson. Here, the scarp trends northeast–southwest and coincides with a fault exposed in outcrop on Mt. Dobson ski field road (, ). The fault does not dip into the slope, as would be expected for a continuation of the Forest Creek Fault from the north. The fault sense is reverse and dips to the southeast (). This might be part of a larger fault zone, of which the exposed plane is only an antithetic splay. However, the juxtaposition of two textural zones of Torlesse greywacke/semischist, presence of cataclasite, and coincidence with the scarp at the surface imply that this is the primary fault zone. In their investigation of the Dunstan Fault in Otago, Beanland et al. (Citation1986) found that uphill facing scarps can be produced by reverse faults dipping out of the slope. They may form as pop-up or positive flower structures linked to range front faults in the foreland that dip into the slope. In this case, we suggest the range front fault may be related to the Fox Peak Fault c. 3 km to the south (, discussion below).
Figure 14. Photograph and sketch interpretation of fault outcrop at Mt. Dobson ski field road (see , for location). Displaced quartz veins and cataclasite indicate predominantly southeast-dipping reverse motion in a zone of complex faulting. The fault juxtaposes TZI (Torlesse greywacke) and TZII (semischist, undifferentiated) rocks.
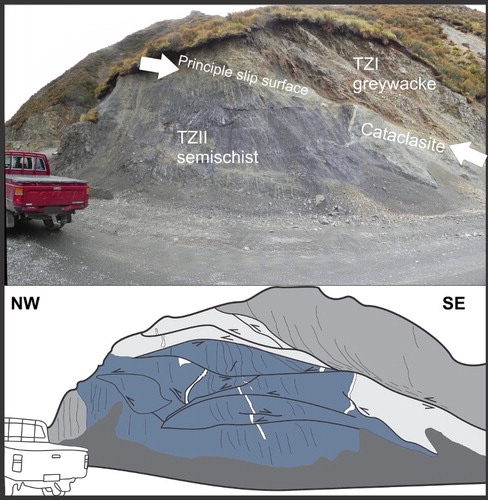
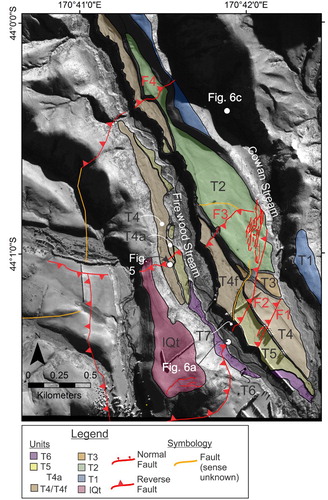
Figure 15. Northward view of the southern Forest Creek and Fox Peak Faults. The surface is a near-infrared band satellite image overlain on a 15 m digital elevation model with no vertical exaggeration. The location of is shown just below Mt. Dobson. Solid white arrows show principal fault traces of the Fox Peak Fault at the Cloudy Peaks terraces () and the South Opuha River (). Inferred thrust front propagation direction shown by dashed white arrows. The Cloudy Peaks traces, which bound the Two Thumb Range, are inferred to be intermediary structures between the foreland propagating Forest Creek Fault to the west and Fox Peak Fault sections bounding the Sherwood Range to the north.
North of Mt. Dobson, this scarp is not evident where it projects through recent landforms in the South Opuha River catchment. It is uncertain whether the fault trace dies out or if this section has not ruptured since deposition of these landforms. However, the prominence of the scarp in quickly eroding, steep terrain to the south points towards recent activity and active uplift. Its proximity to known active fault traces, both along strike of the northern Forest Creek Fault section and the Fox Peak Fault at its down-dip extent, further suggests it should be considered an active structure. A combined length of 40 km is calculated for the northern and southern Forest Creek Fault sections, which have been assigned on geometric criteria.
Surface ages, net slip and slip rates along the Fox Peak Fault
Geochronology data
IRSL sample WLL946 was collected from fluvial silt and sand in a c. 0.5 m-deep hand-dug pit on T4 at the Cloudy Peaks terraces (; , ). The sample yielded an age of 24.8 ± 2.7 kyr BP. This is older than previous estimates for the ages of the terraces at this site (<18 kyr BP) and makes the ages of T1–T3 considerably older than previous estimates (Beanland Citation1987). However, these prior estimates were based primarily on the assumption that the terraces aggraded as LGM outwash, which is not consistent with the sequence of bedrock straths observed in the area. IRSL ages from paleoseismic trenches on T2 (Stahl et al. Citation2016; Stahl Citation2014) post-date 18 kyr BP and place minimum age estimates on the terrace of c. 24 kyr BP. Thus, we consider the IRSL age of T4 in this study to be reasonable and use it as an age constraint in SHD age models.
SHD age estimates for the Cloudy Peaks terraces are listed in . In the model, we assumed an age for T1 of <100 kyr BP and an IRSL age of 24.8 ± 2.7 kyr BP for T4. An a-value of 264 (Equation 1) was used (after Stahl et al. Citation2013). Ages, although refined by terrace order and absolute ages, typically have large uncertainties associated with the many sources of error in R-value distributions (5th and 95th percentiles listed in ).
The a-value (Equation 1) for the South Opuha River site was calculated from the climate and petrographic data for Cloudy Peaks after adjusting for temperature lapse rate (a = 269) (Stahl et al. Citation2013). The topmost degradational terrace was assumed to be younger than 18 kyr, as per field interpretations (Figure S3), but this assumption did not significantly affect the results. Input parameters, age constraints for rejection sampling and age outputs are summarised in . The SHD age distributions for both sites were used as inputs into Monte Carlo simulations of fault slip rates.
IRSL sample WLL1000 from a trench near Fox’s Peak ski field road () yielded an age of 16.4 ± 2.0 kyr BP (). This is consistent with the inference of a late to post-LGM age for this surface based on mapping. As such, we use this age for other landforms (alluvial fans and river terraces) that grade to the same base level along the Bray section and for features mapped as late LGM (MIS2) elsewhere. For other sites, MIS and map correlations (Cox & Barrel Citation2007 and this study) were used as age inputs.
Net slip
A total of 140 fault scarp profiles (inclusive of repeat profiles using different survey techniques) were collected along the length of the Fox Peak Fault (). Examples of survey data are shown in and . At Cloudy Peaks (, ), the listric geometry of the faults seen in outcrop is clearly shown by the back-tilting of T1 and T2 (folding shown with stream gradient removed). Although no attempt was made to calculate fault slip based on this folding (e.g. Amos et al. Citation2007), it is apparent that the radius of curvature is relatively small – the folding dies out over a distance of <500 m at which point the normal terrace gradient is resumed. This is consistent with the fault geometry in outcrop (Figure S2). Fault geometry parameters used in net slip calculations () were selected based on field mapping.
Table 4. Fault geometries used to determine net slips for different fault sections.
Slip rates
In this study, the slip rate distributions range from approximately symmetric about a mean (i.e. normal) to highly asymmetric. To best characterise the central tendency of these varied distribution shapes, medians and associated 5th and 95th percentiles are reported as the representative values (). Reported slip rates are subdivided into the following classes: minimum (e.g. surfaces with younger deposits in the footwall than on the hanging wall; the surface is not offset by all faults in area; or only the maximum age is known), maximum, inferred (surface age inferred), good (based on a high degree of confidence that the mapped surface correlates to a dated one), or best (based on the age of a dated surface) rates.
Table 5. Net slip and slip rates calculated from fault scarp profiles.
Slip rate values vary depending on the location along-strike of the Fox Peak Fault sections. Rates are highest (irrespective of the rate classification above) near the centre of the Cloudy Peaks and Bray sections, where they reach and
mm yr−1, respectively. Excluding minimum and maximum rate classifications, an average slip rate for the entire length of the fault of c. 0.8 mm yr−1 is calculated.
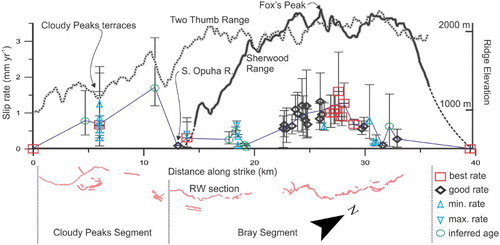
Slip rates were plotted against distance along the Fox Peak Fault () to delineate fault segments. The ‘best-fitting’ line was drawn through the highest quality and/or average slip rate data points and further constrained by slip rate minima and maxima. The fault tips, which are slightly extended to 40 km in the graph, are assumed to have slip rates equal to zero. The semi-parabolic forms of the Cloudy Peaks and Bray segment slip rate profiles show some covariation with the topographic profiles of the Sherwood and southern Two Thumb Ranges, which were constructed by drawing elevation profiles along the ridge crest of each in a 15 m digital elevation model and projecting onto distance along the fault.
Figure 16. Along-strike distribution of slip rates on the Fox Peak Fault and topographic profile of the Sherwood (bold solid line) and Two Thumb Ranges (dashed line) over the same length of the fault. ‘Best’ rates are from dated surfaces; ‘good’ rates are from surfaces correlated to dated features; ‘min’ and ‘max’ rates are from calculations using minimum/maximum slip and/or age; ‘inferred age’ are rates derived from surface of inferred age (lowest confidence) (data in ). Error bars are 5th and 95th percentiles. The ‘best-fitting’ line (thin solid line) is drawn through the highest quality and/or average slip rate data points and further constrained by maxima and minima. A fault trace map is provided below.
It is important to note that temporal slip rate variations are not accounted for in , although they are apparent on at least the Cloudy Peaks segment. Here, the ‘best’ slip rate is calculated from the displacement of T4 (red square), which is offset across all identified faults (). The other rates at this site are considered minima because most of the terraces used in the slip rate calculations are not offset by all of the faults. Most slip rate minima for other terraces fall below the ‘best’ rate for T4; however, two minima are actually higher rates than that for T4. This might suggest a temporal variation of slip rates. For instance, the highest rate at the Cloudy Peaks terraces was calculated for T2, despite not taking into account possible displacement on the frontal fault (i.e. Fault 1 in , A) which does not displace the terrace. This ‘minimum’ slip rate on would only correspond to an actual slip rate if Fault 1 started accommodating displacement after the abandonment of T2. The uncertainty in the data precludes a definitive interpretation of this rate difference as temporal variability at this site. At other sites, the limited number of features outside the c. 10–16 kyr BP age range and overlapping 5th–95th percentiles do not permit an analysis of temporal slip rate variations ().
There is a decrease in slip rates near the geometrically and structurally defined Cloudy Peaks–Ribbonwood section boundary (). This is also the location of the southern termination of the Sherwood Range (, ). It is apparent that slip rates on the Bray section are parabolic and roughly covary with topography over a similar fault length as the Sherwood Range (). Slip rates seem to show a similar relationship between Cloudy Peaks slip rates and the topography of the southern Two Thumb Range ().
The discordance of slip rates and topography between the Ribbonwood section and southern Sherwood Range may be due to ‘missing’ deformation being taken up in distributed folding of fan surfaces (e.g. ); however, there is not enough data on this section to make a clear conclusion. Additionally, it is not clear if the structural section boundary imposed by the Stony Creek Anticline influences the slip rate difference between the Ribbonwood and Bray sections, or if this is an artefact of the changing style of deformation and/or lack of data. Because of this uncertainty, the Ribbonwood section is classified as part of the Bray segment and distinguish it from the Cloudy Peaks segment (). We propose that the Cloudy Peaks segment, at the base of the southern Two Thumb Range, may have formed as an intermediary structure between the Fox Peak Fault to the north and the foreland propagating Forest Creek Fault to the west (e.g. ), and has since been incorporated as a segment of the Fox Peak Fault.
These observations lend evidence towards sustained segmentation of the Fox Peak Fault. That is, various lines of evidence representing different timescales point towards systematic variations in faulting along the length of the fault. Range elevations reflect accrued fault slip over 106–year timescales (e.g. Jackson et al. Citation1996) and generally follow the trend of 103–104–year slip rates (). The Cloudy Peaks–Bray segment boundary () is marked by a cross-fault and a change in structural relief, which would have developed over 104–106–year timescales. An important hypothesis to test is whether these section and segment boundaries represent the locations of systematically variable displacement in previous, full-length fault ruptures, or are barriers to multisegment rupture.
Single event displacements and recurrence interval of the Fox Peak Fault
If the displacements observed across the youngest surface trace of the Fox Peak Fault are representative of single event displacements (SEDs), then net slip calculations range from 1.2–1.8 m across the youngest trace at Cloudy Peaks () to 0.7–4.0 m at the South Opuha River (4.0 m is inclusive of ‘flexural-slip’ faulting which is likely to be multi-event) (), to 1.6–3.7 m on the Bray segment (). These estimates agree with lower limit constraints on SED from trenching studies (Stahl et al. Citation2016). The displacements on the Bray segment are taken from the centre of the segment, and so may be more indicative of maximum displacements. On the Cloudy Peaks segment, it is uncertain if displacement is accommodated across multiple imbricate faults or just one in any given earthquake. We consider the c. 1.5 m SED here (SED on the dominant fault trace, F2, across the youngest terrace) to be a minimum for the segment because additional displacements may occur on other faults with compound scarps.
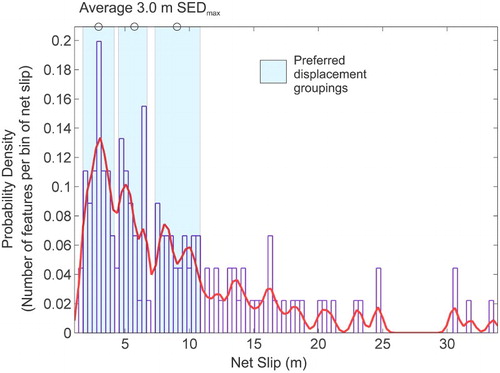
One approach to finding an average or maximum SED for a fault is to bin all net displacements and examine the spacing of ‘peaks’ in the dataset (McGill & Sieh Citation1991). For the Fox Peak Fault, a bin width was chosen to show small variations in the dataset, and closely spaced multimodal peaks are interpreted as being the combined result of variable along-strike displacement and chosen bin width (). Using this method, the last three earthquakes produced a mean of 3.0 m displacement. These are interpreted as being near SED maxima, because smaller displacements are likely to be underrepresented due to poorer preservation in the landscape. It should be noted that interpretation of SED using this method is reliant on the bin width used in , and that this result is only reliable if it can be corroborated independently. An SED of c. 3 m is generally consistent with our field estimates.
Figure 17. Determination of single event displacement (SED) from pooled net slips on the Fox Peak Fault (after McGill & Sieh Citation1991). A bin width of 0.35 m was chosen in order to show small-scale variations below the detection limit of separate events. Three events of 3 m are interpreted from the central values of our preferred displacement groupings (shaded boxes). Multimodal ‘peaks’ (two or more peaks in the histogram encompassed by the same displacement grouping) are interpreted as being the result of along-strike variations in displacement and/or error in calculating net slip.
Using the empirical equations of Moss and Ross (Citation2011) to convert maximum displacement to average displacement for reverse faults, an average SED of 1.3 ± 0.5 m is obtained. Based on the lower limits observed in trenching, the preferred estimate of average SED is c. 2 m (Stahl et al. Citation2016). This estimate agrees with the application of Wesnousky’s (Citation2008) average displacement–fault rupture length scaling to the Fox Peak Fault (calculated 33 km rupture length vs. c. 36.5 km mapped) and is in agreement with the 2–4 m SED for the nearby Ostler Fault (Van Dissen et al. Citation1994).
A surface-derived, apparent recurrence interval (RI, equal to SED divided by slip rate) depends on the location along the fault where the representative slip rate is chosen. Taking a slip rate of 1 mm yr−1 and SED of 2–3 m, which are near the values taken from Cloudy Peaks and the central Bray segment, the average RI would be 2000–3000 years. This value is consistent with RI of nearby faults (Van Dissen et al. Citation1994; Berryman et al. Citation2002; Amos et al. Citation2011).
Discussion
Fault segmentation
Over 106–year timescales (i.e. the period spanning the uplift of the Two Thumb and Sherwood Ranges), there is good evidence that the Fox Peak Fault has operated as a segmented reverse fault. This is apparent in the geometry and structural style of the fault, and its relationship to topography. The Bray segment has been, at least in part, responsible for the uplift of the Sherwood Range. The fault traces at the Cloudy Peaks terraces probably formed as intermediary structures between the foreland-propagating Forest Creek Fault and southward lengthening Bray segment of the Fox Peak Fault (). On the mountain range scale, this style of overlapping fault and fold (range) growth has been described from the pattern of long-term drainage development in Otago (Jackson et al. Citation1996, Citation2002).
The change in topographic and structural relief between the southern Two Thumb Range (Cloudy Peaks segment) and southern Sherwood Range (Ribbonwood section of the Bray segment) is reflected by the net slip of Late Pleistocene surfaces and long-term slip rates (). The Fox Peak Fault slip rate profile () shows a marked decrease at the South Opuha River (i.e. across the segment boundary). This begs the question of whether this slip rate-delineated segment boundary represents a barrier to earthquake rupture propagation, or reflects the lower-end of variable slip distributions in multisegment ruptures.
Potential earthquake magnitudes
We do not consider the Cloudy Peaks–Bray segment boundary at the South Opuha River to represent a co-seismic rupture barrier. If the South Opuha River terraces were located at a barrier that rarely failed in otherwise regular earthquakes, one would expect to see slip maxima at the barrier in less frequent events (Shen et al. Citation2009). Alternatively, if this was a location of consistently smaller displacements from segment-breaching earthquakes, one would expect to see evidence of progressively increasing displacements on older terraces. Neither of these scenarios is consistent with the observation at this site. Instead, the uniform offset of the South Opuha River terraces () points towards a slip minimum on the Fox Peak Fault at this location in a single surface rupture less than c. 13 kyr BP (i.e. the age of T1, ).
If some of slip on the Ribbonwood section is accommodated by distributed folding, then the apparent on-fault slip rate at the South Opuha River underestimates the true slip rate. This is supported by the spatial coincidence of tilted late Quaternary fan surfaces, antithetic (inferred flexural-slip) faults and the main trace of the fault, as well as the discordance between slip rates and topography on the Ribbonwood section (, ). It has long been recognised that distributed faulting and folding complicates the measurement of reverse fault slip (Rockwell Citation1988; Yeats Citation2000; Ishiyama et al. Citation2004; Gold et al. Citation2006; McCalpin Citation2009; Amos et al. Citation2011) and displacement transfer has been observed on slip rate profiles of en echelon fault traces of the Ostler Fault to the south (Amos et al. Citation2010). On the Fox Peak Fault, this would explain the discrepant field observations, mismatch of Ribbonwood section slip rates with Sherwood Range topography, and the large on-fault displacement–length ratios and scaling law-derived magnitudes observed in this study (the ‘short, fat fault problem’ of McCalpin Citation2009, pp. 320–322) (). Therefore, although there is the possibility of rupturing short segments with large displacement–length ratios, the tectonic geomorphology is more suggestive of full-length fault ruptures on the Fox Peak Fault, which is our preferred interpretation.
Table 6. Moment magnitudes (MW) for different fault segments, rupture scenarios and scaling laws.
The Forest Creek Fault may rupture together with the Fox Peak Fault. In the area of , the two faults may form a positive flower structure and could thus be considered a single seismic source. At the northern end of the Two Thumb and Sherwood Ranges (), the distance between the two faults at the surface (c. 10 km) is large enough (i.e. roughly equal to the seismogenic thickness) that they should be considered separate sources. Historical reverse fault earthquakes have involved rupture on antithetic as well as synthetic segments, with some traces >10 km away from the principal fault (c.f. Officers of the Geological Survey Citation1983; Rubin Citation1996; Field et al. Citation2013). Limited geophysical data also suggests that the two faults sole into the same listric fault at depth (e.g. Wannamaker et al. Citation2002; Long et al. Citation2003). As observed in the 2008 Wenchuan earthquake, imbricate reverse faults can rupture in the same earthquake (e.g. Xu et al. Citation2009); Oglesby et al. (Citation2003) and Fukuyama and Hao (Citation2013) showed that stress interactions may actually favour this scenario. Here, we consider the faults to be separate seismic sources, but recognise that the potential for coeval rupture of the two is significant (e.g. Stahl et al. Citation2016).
Several empirical regressions exist for estimating MW from geologic data. The most recent regression is that of Moss and Ross (Citation2011) for a global dataset of displacement-MW scaling for reverse faults. For the Fox Peak Fault, a maximum displacement of 3.0 m equates to MW 7.2 ± 0.3 (). Berryman et al. (Citation2002) (using previously collected data) obtained the same value and it is included in the national seismic hazard model (NSHM, Stirling et al. Citation2012). Using Wesnousky’s (Citation2008) length scaling, MW 7.0 ± 0.2 is obtained. Both of these estimates only take into account full-length rupture of the Fox Peak Fault.
The Forest Creek Fault is not currently included in the NSHM, but is included in the active faulting database of Litchfield et al. (Citation2014). The MW for full-length Forest Creek Fault rupture is 7.1 ± 0.2 (Wesnousky Citation2008), or MW 6.6 and 6.5 ± 0.2 on the northern and southern segments, respectively (). As there is no paleoseismic data on the southern segment, and no clear indication of whether the fault is continuous at the surface across the two geomorphic segments, we posit that full-length rupture should be considered as equally likely as segmented rupture for the purposes of seismic hazard analysis.
Because the Fox Peak and Forest Creek Faults are structurally related and in close proximity to each other, characterisation of the maximum magnitude potential of the system requires a consideration of the probability that rupture on one fault jumps to the other. This scenario, involving full-length rupture of both faults, may reach >MW 7.4 based on combined fault lengths (Stahl et al. Citation2016).
Comparison of geodetic and geologic slip rates
As with most other central South Island reverse faults, the geologic slip rates presented for the Fox Peak Fault in this study are exceeded by slip rates predicted by geodetic modelling (Berryman et al. Citation2002; Amos et al. Citation2007; Wallace et al. Citation2007). The c. 1–2 m scarp height of the Forest Creek trace with a maximum age of post-LGM (after c. 18 kyr BP) yields an average slip rate of 0.05–0.1 mm yr−1. These rates are subject to considerable uncertainty and are likely to be higher given the youthful appearance of the scarp within the quickly eroding landscape and the ages of events found in trenches (Stahl et al. Citation2016). Preferred average slip rates summed across the two faults amount to c. 1–1.5 mm yr−1. These rates generally agree with the range of rates estimated by Litchfield et al. (Citation2014), although their ‘best’ estimates are likely to be skewed towards higher values due to the inclusion of a dextral slip component on these faults, for which we do not find any evidence. Accounting for conversion of surface slip to subsurface slip, our geologically derived rates are significantly slower than geodetic rates for this zone of faults (2.5–7 mm yr−1; Wallace et al. Citation2007). Three possible reasons for this are (a) the under-prediction of actual slip rates because the faults are late in their seismic cycles or are in a relatively quiescent phase of a long-term temporal clustering cycle; (b) unmeasured distributed deformation on the hanging walls of the faults; and/or (c) strain partitioning onto other unrecognised faults in the eastern Southern Alps. We consider it likely that the ‘missing’ dip-slip and strike-slip components are taken up on either unidentified faults in the Southern Alps (e.g. Cox et al. Citation2012) or many small faults and folds surrounding the geodetic block boundary defined by Wallace et al. (Citation2007).
Conclusions
The major findings of the study are as follows:
Three geometrically and structural distinct sections of the Fox Peak Fault comprise two slip-rate delineated fault segments: the Cloudy Peaks segment in the south and the Bray segment in the north. Repeated displacements on these segments have, at least in part, resulted in the uplift of the southern Two Thumb and Sherwood Ranges, respectively.
The Cloudy Peaks segment of the Fox Peak Fault is an imbricate thrust wedge that has formed in response to the foreland propagating Forest Creek Fault and/or lengthening of the Bray segment of the Fox Peak Fault, and has since been incorporated as a segment of the Fox Peak Fault. This is reflected in the overlap of the southern Two Thumb and Sherwood Ranges.
A maximum slip rate of between c. 1.6 and 1.7 mm yr−1 is estimated for the Fox Peak Fault on the basis of new mapping, surveying and dating of faulted geomorphic features. Preferred average slip rates across the Fox Peak and Forest Creek faults are between 1 and 1.5 mm yr−1, collectively.
The apparent recurrence interval of the Fox Peak Fault is c. 2000–3000 yr, based on an estimated 2–3 m SED and average slip rates.
The MW values derived from segment-specific SEDs are much larger than those derived from the individual segment lengths. This suggests full-length, multisegment Fox Peak Fault earthquakes.
The best estimate MW for full-length rupture of the Fox Peak Fault is c. 7.0–7.2, which is in agreement with previous estimates used in the NSHM. The Forest Creek Fault is capable of MW 7.1 earthquakes in a full-length rupture scenario, or c. 6.5 if the two identified fault sections rupture separately.
Supplementary data
Figure S1. Simplified geologic map of the area around the Fox Peak and Forest Creek Faults (modified after Cox and Barrell 2007).
Figure S2. A listric fault in Firewood Stream. (A) Over a distance and depth of ∼20 m, the fault dip changes from ∼45 to 0°. (B) Normal displacement of a quartz vein and a lack of a modern surface trace suggest that this fault has been inherited from past extension, and is not a bending-moment fault related to the modern deformation. Hammer for scale.
Figure S3. Outcrop of fan gravels underlying fluvial boulder lag at the South Opuha River. The fan gravels are assumed to be of late to post-LGM age, though further dating may be required to constrain this estimate. The strath surface cuts evenly across brecciated Torlesse greywacke and the fan gravels. Faults exposed in the Torlesse have no surface expression and do not offset the fluvial gravels, indicating they have not slipped since deposition of the fluvial gravels.
Acknowledgements
We would like to thank Sam McColl, Tom Brookman, Stefan Winkler, David Nobes, Narges Khajavi, Duncan Noble, Sharon Hornblow, David Barrell, David Jacobson, Jarg Pettinga, Thomas Gardner, Brendan Duffy, Eric Bilderback, Uwe Ring, Travis Horton, David McConnell and Marion Gadsby for their assistance in the field and useful discussions in the office. Satellite imagery was provided by the GeoEye Foundation. We thank Colin Amos and Rob Langridge for reviews of Stahl’s PhD thesis. Detailed reviews by Mark Hemphill-Haley, Pilar Villamor and an anonymous reviewer greatly improved this manuscript. Finally, we are grateful to the Aubreys of Ben McLeod Station, the Brays of Lilydale Station, and the Murdochs of Cloudy Peaks Station for allowing access to their land over the course of this work.
Associate Editor: Dr Pilar Villamor.
Disclosure statement
No potential conflict of interest was reported by the authors.
ORCiD
Additional information
Funding
Related Research Data
References
- Alloway BV, Lowe DJ, Barrell DJA, Newnham RM, Almond PC, Augustinus PC, Bertler NAN, Carter L, Litchfield NJ, McGlone MS, et al. 2007. Towards a climate event stratigraphy for New Zealand over the past 30 000 years (NZ-INTIMATE project). J Quaternary Sci. 22(1):9–35. doi: 10.1002/jqs.1079
- Amos CB, Burbank DW. 2007. Channel width response to differential uplift. J. Geophys. Res.: Earth Surf. 112(F2). doi:10.1029/2006JF000672
- Amos CB, Burbank DW, Nobes DC, Read SAL. 2007. Geomorphic constraints on listric thrust faulting: implications for active deformation in the Mackenzie Basin, South Island, New Zealand. J. Geophys Res. 112(B3). doi:10.1029/2006JB004291
- Amos CB, Burbank DW, Read SAL. 2010. Along-strike growth of the Ostler fault, New Zealand: consequences for drainage deflection above active thrusts. Tectonics. 29(4). doi:10.1029/2009TC002613
- Amos CB, Lapwood JJ, Nobes DC, Burbank DW, Rieser U, Wade A. 2011. Palaeoseismic constraints on Holocene surface ruptures along the Ostler Fault, southern New Zealand. New Zeal J Geol Geophys. 54(4):367–378. doi: 10.1080/00288306.2011.601746
- Arrowsmith JR, Strecker MR. 1999. Seismotectonic range-front segmentation and mountain-belt growth in the Pamir-Alai region, Kyrgyzstan (India-Eurasia collision zone). Geol Soc Ama Bull. 111(11):1665–1683. doi: 10.1130/0016-7606(1999)111<1665:SRFSAM>2.3.CO;2
- Barrell DJA, Strong DT. 2012. Geological contours for groundwater modelling, South Canterbury. GNS Science Consultancy Report. 2012/245. 11 p.
- Beanland S. 1987. Field guide to sites of active earth deformation: South Island, New Zealand. NZ Geological Survey Record. 19.
- Beanland S, Berryman KR, Hull AG, Wood PR. 1986. late quaternary deformation at the Dunstan Fault, Central Otago, New Zealand. Bull R Soc New Zeal. 24:293–306.
- Beavan J, Ellis S, Wallace L. 2007. Kinematic constraints from GPS on oblique convergence of the Pacific and Australian plates, central South Island, New Zealand. In: Okaya DA, Stern TA, Davey FJ, editors. A Continental plate boundary: tectonics at South Island, New Zealand. Washington, DC: American Geophysical Union. Pp. 75–94.
- Beavan J, Haines J. 2001. Contemporary horizontal velocity and strain rate fields of the Pacific-Australian plate boundary zone through New Zealand. J Geophys Res: Solid Earth. 106(B1):741–770. doi: 10.1029/2000JB900302
- Berryman KR, Webb T, Hill N, Stirling M, Rhoades DJ, Beavan J, Darby D. 2002. Seismic loads on Dams, Waitaki system: earthquake source characterisation. GNS Client report. 2001/129. 80 p.
- Bull WB. 1990. Stream-terrace genesis: implications for soil development. Geomorphology. 3(3):351–367. doi: 10.1016/0169-555X(90)90011-E
- Campbell JK, Pettinga JR, Jongens R. 2012. The tectonic and structural setting of the 4 September 2010 Darfield (Canterbury) earthquake sequence, New Zealand. New Zeal J Geol Geophys. 55(3):155–168. doi: 10.1080/00288306.2012.690768
- Cox SC, Barrell DJA. 2007. Geology of the Aoraki area: scale 1:250,000. Lower Hutt: GNS Science. Institute of Geological & Nuclear Sciences 1:250,000 Geological map 15. 71 p. + 1 folded map.
- Cox SC, Stirling MW, Herman F, Gerstenberger M, Ristau J. 2012. Potentially active faults in the rapidly eroding landscape adjacent to the Alpine Fault, central Southern Alps, New Zealand. Tectonics. 31(2). doi:10.1029/2011TC003038
- Cutten H. 1990. Reconnaissance of faulting in the Fairlie Basin, Burke Pass, Lake Tekapo area. NZ Geological Survey Earth Deformation Section unpublished Immediate Report 90/2.
- Davis K, Burbank DW, Fisher D, Wallace S, Nobes D. 2005. Thrust-fault growth and segment linkage in the active Ostler fault zone, New Zealand. J Struct Geol. 27(8):1528–1546. doi: 10.1016/j.jsg.2005.04.011
- DeMets C, Gordon RG, Argus DF. 2010. Geologically current plate motions. Geophys J Int. 181(1):1–80. doi: 10.1111/j.1365-246X.2009.04491.x
- Densmore AL, Ellis MA, Li Y, Zhou R, Hancock GS, Richardson N. 2007. Active tectonics of the Beichuan and Pengguan faults at the eastern margin of the Tibetan Plateau. Tectonics. 26(4):TC4005. doi:10.1029/2006TC001987
- Densmore AL, Li Y, Richardson NJ, Zhou RJ, Ellis M, Zhang Y. 2010. The role of late quaternary upper-crustal faults in the 12 May 2008 Wenchuan earthquake. Bull Seismol Soc Am. 100(5B):2700–2712. doi: 10.1785/0120090294
- DePolo CM, Clark DG, Slemmons DB, Ramelli AR. 1991. Historical surface faulting in the Basin and Range province, western North America: implications for fault segmentation. J Struct Geol. 13:123–136. doi: 10.1016/0191-8141(91)90061-M
- Field EH, Biasi GP, Bird P, Dawson TE, Felzer KR, Jackson DD, Johnson KM, Jordan TH, Madden C, Michael AJ, et al. 2013. Uniform California earthquake rupture forecast, version 3 (UCERF3)—The time-independent model. U.S. Geological Survey Open-File Report 2013–1165, California Geological Survey Special Report 228, and Southern California Earthquake Center Publication 1792. 97 p.
- Fox AN. 1987. The Neotectonic History of the Lake Tekapo region, Mackenzie Basin. New Zealand: University of Canterbury unpublished MSc Thesis: 444 p.
- Fukuyama E, Hao KX. 2013. Subparallel dipping faults that ruptured during the 2008 Wenchuan earthquake. Bull Seismol Soc Am. 103(3):2128–2134. doi: 10.1785/0120120231
- Ghisetti FC, Gorman AR, Sibson RH. 2007. Surface breakthrough of a basement fault by repeated seismic slip episodes: The Ostler fault, South Island, New Zealand. Tectonics. 26(6):TC6004. doi:10.1029/2007TC002146
- Gold RD, Cowgill E, Wang X-F, Chen XH. 2006. Application of trishear fault-propagation folding to active reverse faults: examples from the Dalong Fault, Gansu Province, NW China. J Struct Geol. 28(2):200–219. doi: 10.1016/j.jsg.2005.10.006
- Hubbard J, Shaw JH, Dolan J, Pratt TL, McAuliffe L, Rockwell TK. 2014. Structure and seismic hazard of the Ventura avenue anticline and Ventura fault, California: prospect for large, multisegment ruptures in the Western transverse ranges. Bull Seismol Soc Am. 104:1070–1087. doi: 10.1785/0120130125
- Ishiyama T, Mueller K, Togo M, Okada A, Takemura K. 2004. Geomorphology, kinematic history, and earthquake behavior of the active Kuwana wedge thrust anticline, central Japan. J Geophys Res. 109(B12). doi:10.1029/2003JB002547
- Jackson J, Norris R, Youngson J. 1996. The structural evolution of active fault and fold systems in central Otago, New Zealand: evidence revealed by drainage patterns. J Struct Geol. 18(2):217–234. doi: 10.1016/S0191-8141(96)80046-0
- Jackson J, Ritz J-F, Siame L, Raisbeck G, Yiou F, Norris R, Youngson J, Bennett E. 2002. Fault growth and landscape development rates in Otago, New Zealand, using in situ cosmogenic 10Be. Earth Planet Sci Lett. 195(3–4):185–193. doi: 10.1016/S0012-821X(01)00583-0
- James ZE. 1998. Geology, Quaternary structure, fault rocks and fluid flow, Fox Peak Range, Eastern Southern Alps. University of Otago unpublished MSc Thesis: 134 p.
- Khajavi N, Quigley M, Langridge R. 2014. Influence of topography and basement depth on surface rupture morphology revealed from LiDAR and field mapping, Hope Fault, New Zealand. Tectonophysics. 630:265–284. doi: 10.1016/j.tecto.2014.05.032
- Knuepfer PLK. 1988. Estimating ages of late Quaternary stream terraces from analysis of weathering rinds and soils. Geol Soc Am Bull. 100(8):1224–1236. doi: 10.1130/0016-7606(1988)100<1224:EAOLQS>2.3.CO;2
- Knuepfer PLK. 1989. Implications of the characteristics of endpoints of historical surface fault ruptures for the nature of fault segmentation. In: Schwartz DP, Sibson RH, editors. Fault Segmentation and Controls of Rupture Initiation and Termination, Palm Springs California USGS Open File report 89–315. 458 p.
- Langridge RM, Ries WF, Litchfield NJ, Villamor P, Van Dissen RJ, Rattenbury MS, Barrell DJA, Heron DW, Haubrock S, Townsend DB, et al. 2016. The New Zealand active faults database: NZAFD250. New Zeal J Geol Geophys. 59(1):86–96. doi: 10.1080/00288306.2015.1112818
- Leitner B, Eberhart-Phillips D, Anderson H, Nabelek JH. 2001. A focused look at the Alpine fault, New Zealand: seismicity, focal mechanisms, and stress observations. J Geophys Res. 106:2193–2220. doi: 10.1029/2000JB900303
- Litchfield NJ, Van Dissen R, Sutherland R, Barnes PM, Cox SC, Norris R, Beavan RJ, Langridge R, Villamor P, Berryman K, et al. 2014. A model of active faulting in New Zealand. New Zeal J Geol Geophys. 57(1):32–56. doi: 10.1080/00288306.2013.854256
- Long DT, Cox SC, Bannister S, Gerstenberger MC, Okaya D. 2003. Upper crustal structure beneath the eastern Southern Alps and the Mackenzie Basin, New Zealand, derived from seismic reflection data. New Zeal J Geol Geophys. 46(1):21–39. doi: 10.1080/00288306.2003.9514993
- McCalpin J. 2009. Paleoseismology. Burlington, MA: Academic Press. 629 p.
- McGill SF, Sieh K. 1991. Surficial offsets on the Central and Eastern Garlock Fault associated with prehistoric earthquakes. J Geophys Res: Solid Earth. 96:21597–21621. doi: 10.1029/91JB02030
- Merritts DJ, Vincent KR, Wohl EE. 1994. Long river profiles, tectonism, and eustasy: a guide to interpreting fluvial terraces. J Geophys Res. 99(B7):14031–14050. doi: 10.1029/94JB00857
- Moss RES, Ross ZE. 2011. Probabilistic fault displacement hazard analysis for reverse faults. Bull Seismol Soc Am. 101(4):1542–1553. doi: 10.1785/0120100248
- Nicol A. 1993. Conical folds produced by dome and basin fold interference and their application to determining strain: examples from North Canterbury, New Zealand. J Struct Geol. 15(6):785–792. doi: 10.1016/0191-8141(93)90062-F
- Norris RJ, Cooper AF. 2001. Late Quaternary slip rates and slip partitioning on the Alpine Fault, New Zealand. J Struct Geol. 23:507–520. doi: 10.1016/S0191-8141(00)00122-X
- Officers of the Geological Survey. 1983. Seismotectonic hazard evaluation of the Clyde Dam site. New Zealand Geological Survey /EG Report 375.
- Oglesby DD, Day SM, O’Connell DRH. 2003. Dynamic and static interaction of two thrust faults: a case study with general implications. J Geophys Res: Solid Earth. 108(B10). doi:10.1029/2002JB002228
- Quigley MC, Sandiford M, Cupper ML. 2007. Distinguishing tectonic from climatic controls on range-front sedimentation. Basin Res. 19:491–505. doi: 10.1111/j.1365-2117.2007.00336.x
- Rockwell T. 1988. Neotectonics of the San Cayetano fault, transverse ranges, California. Geol Soc Am Bull. 100(4):500–513. doi: 10.1130/0016-7606(1988)100<0500:NOTSCF>2.3.CO;2
- Rood DH, Burbank DW, Finkel RC. 2011. Spatiotemporal patterns of fault slip rates across the Central Sierra Nevada frontal fault zone. Earth Planet Sci Lett. 301:457–468. doi: 10.1016/j.epsl.2010.11.006
- Rubin CM. 1996. Systematic underestimation of earthquake magnitudes from large intracontinental reverse faults: Historical ruptures break across segment boundaries. Geology. 24(11):989–992. doi: 10.1130/0091-7613(1996)024<0989:SUOEMF>2.3.CO;2
- Shen ZK, Sun J, Zhang P, Wan Y, Wang M, Burgmann R, Zeng Y, Gan W, Liao H, Wang Q. 2009. Slip maxima at fault junctions and rupturing of barriers during the 2008 Wenchuan earthquake. Nat Geosci. 2(10):718–724. doi: 10.1038/ngeo636
- Stahl T. 2014. Active Tectonics and Geomorphology of Central South Island, New Zealand: Earthquake Hazards of Reverse Faults: University of Cantebrury unpublished PhD Thesis: 247 p.
- Stahl T, Quigley MC, McGill A, Bebbington M. 2016. Modeling earthquake moment magnitudes on imbricate reverse faults from paleoseismic data, Fox Peak and Forest Creek faults, South Island, New Zealand. Bull Seismol Soc Am. 106(5). doi:10.1785/0120150215
- Stahl T, Winkler S, Quigley M, Bebbington M, Duffy B, Duke D. 2013. Schmidt hammer exposure-age dating (SHD) of late Quaternary fluvial terraces in New Zealand. Earth Surf Proc Land. 38(15):1838–1850. doi: 10.1002/esp.3427
- Stirling M, McVerry G, Gerstenberger M, Litchfield N, Van Dissen R, Berryman K, Barnes P, Wallace L, Villamor P, Langridge R, et al. 2012. National seismic hazard model for New Zealand: 2010 update. Bull Seismol Soc Am. 102(4):1514–1542. doi: 10.1785/0120110170
- Sutherland R, Berryman KR, Norris RJ. 2006. Quaternary slip rate and geomorphology of the Alpine fault: implications for kinematics and seismic hazard in southwest New Zealand. Geol Soc Am Bull. 118:464–474. doi: 10.1130/B25627.1
- Thompson SC, Weldon RJ, Rubin CM, Abdrakhmatov K, Molnar P, Berge GW. 2002. Late Quaternary slip rates across the central Tien Shan, Kyrgyzstan, central Asia. J Geophys Res: Solid Earth. 107:ETG 7-1–ETG 7-32. doi:10.1029/2001JB000596
- Upton P, Craw D, James Z, Koons PO. 2004. Structure and late Cenozoic tectonics of the southern two thumb range, mid Canterbury, New Zealand. New Zeal J Geol Geophys. 47(1):141–153. doi: 10.1080/00288306.2004.9515043
- Upton P, Koons PO, Craw D, Henderson CM, Enlow R. 2009. Along-strike differences in the Southern Alps of New Zealand: consequences of inherited variation in rheology. Tectonics. 28(2). doi:10.1029/2008TC002353
- Van Dissen, RJ, Hull AG, Read SAL. 1994. Timing of some large Holocene earthquakes on the Ostler Fault, New Zealand. In: Proceedings of the Eighth International Symposium on Recent Crustal Movements (CRCM ‘93), Kobe, 1993 Dec 6–11; Japan: Geodetic Society of Japan; p. 381–386.
- Walcott RI. 1998. Modes of obliques compression: late Cenozoic tectonics of the South Island of New Zealand. Rev Geophys. 36(1):1–26. doi: 10.1029/97RG03084
- Wallace LM, Beavan J, McCaffrey R, Berryman K, Denys P. 2007. Balancing the plate motion budget in the South Island, New Zealand using GPS, geological and seismological data. Geophys J Int. 168(1):332–352. doi: 10.1111/j.1365-246X.2006.03183.x
- Wannamaker PE, Jiracek GR, Stodt JA, Caldwell TG, Gonzalez VM, McKnight JD, Porter AD. 2002. Fluid generation and pathways beneath an active compressional orogen, the New Zealand Southern Alps, inferred from magnetotelluric data. J Geophys Res: Solid Earth. 107(B6). doi:10.1029/2001JB000186
- Wesnousky SG. 2006. Predicting the endpoints of earthquake ruptures. Nature. 444(7117):358–360. doi: 10.1038/nature05275
- Wesnousky SG. 2008. Displacement and geometrical characteristics of earthquake surface ruptures: issues and implications for seismic-hazard analysis and the process of earthquake rupture. Bull Seismol Soc Am. 98(4):1609–1632. doi: 10.1785/0120070111
- Xu X, Wen X, Yu G, Chen G, Klinger Y, Hubbard J, Shaw J. 2009. Coseismic reverse- and oblique-slip surface faulting generated by the 2008 Mw 7.9 Wenchuan earthquake, China. Geology. 37(6):515–518. doi: 10.1130/G25462A.1
- Yeats RS. 2000. The 1968 Inangahua, New Zealand, and 1994 Northridge, California, earthquakes: implications for northwest Nelson. New Zeal J Geol Geophys. 43:587–599. doi: 10.1080/00288306.2000.9514911