
ABSTRACT
Submarine currents are a principal factor in controlling seafloor geomorphology. Herein, we investigate the role of dynamic current systems associated with the Subtropical Front in the formation and modification of seafloor depressions off the east coast of New Zealand’s South Island. Seafloor depressions are widespread in this region, with a diverse range of morphologies and sizes. We focus on two ‘end-member’ classes of depressions; densely spaced decametre-scale structures and more isolated ‘giant’ depressions of up to 12 km in diameter. Our results reveal a direct correlation between the dominant current flow direction, and the modification and alignment of depressions. We present a model to illustrate the role of submarine currents in shaping the morphology of these enigmatic seafloor depressions. This model demonstrates how contour currents, and potentially eddy currents, have extensively modified seafloor structures, resulting in elongate, asymmetrical depressions, partially infilled by sediment drift deposits.
Introduction
Seafloor depressions and their ancient equivalents are widespread on the continental shelf surrounding New Zealand () (Davy et al. Citation2010; Collins et al. Citation2011; Bialas et al. Citation2013; Hillman et al. Citation2015; Chenrai and Huuse Citation2017; Waghorn et al. Citation2017). East of the South Island, depressions are common and their geomorphology varies significantly, from numerous 10–100 m-scale, densely packed depressions along the Otago and Canterbury shelves, to small groups of kilometre-scale depressions on the Chatham Rise, which are among the largest depressions identified worldwide (Davy et al. Citation2010; Bialas et al. Citation2013; Hillman et al. Citation2015; Waghorn et al. Citation2017). These structures are observed in diverse continental margin settings, and their existence is generally attributed to the erosive power of focused fluid or gas venting at the seafloor from underlying overpressured reservoirs of biogenic or thermogenic gas, interstitial water or a combination of all three; however, the exact mechanisms responsible for their formation and maintenance are poorly understood (Judd and Hovland Citation2007; Sultan et al. Citation2010; Riboulot et al. Citation2016; Chenrai and Huuse Citation2017; Wenau et al. Citation2017).
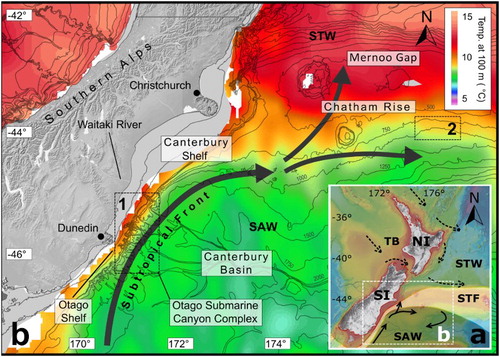
Figure 1. A, Location of the study area (B) off the South Island of New Zealand. The Subtropical Front (STF) separates Subantarctic Water (SAW) to the south (black arrows), from the Subtropical Water (STW) to the north (dashed arrows). Adapted from Cobianchi et al. (Citation2015). NI = North Island, SI = South Island, TB = Taranaki Basin. Bathymetry image source: Mitchell et al. (Citation2012). B, Regional current systems along the east coast of the South Island. Seawater temperature at a depth of 100 m, from the World Ocean Database (WOD) shows the location of the STF, separating cooler (green) SAW from the warmer (red) STW (Hadfield et al. Citation2007). The STF is deflected east along the Chatham Rise, but the associated regional current, the Southland Current splits, with a small sub-branch flowing north over the Chatham Rise through the Mernoo Gap (Weaver et al. Citation1998; Sutton Citation2003). The locations of Areas 1 and 2 are marked by the dashed-line boxes. WOD temperature data are averaged over the period 1955–2012 (Locarnini et al. Citation2013).
In addition to the widely discussed hypothesis of gas and/or fluid venting (Mienert et al. Citation2000, Citation2005; Davy et al. Citation2010), many other models for seafloor depression formation have been proposed, e.g. tectonic and/or diagenetic faulting, groundwater flux, overpressure, current scouring, glacial processes, carbonate dissolution and salt tectonics (Hardage et al. Citation1996; Stewart Citation1999; Fildani et al. Citation2006; Hübscher and Borowski Citation2006; Best et al. Citation2009; Heiniö and Davies Citation2009; Andresen and Huuse Citation2011; Collins et al. Citation2011; Hillman et al. Citation2015; Chenrai and Huuse Citation2017). In this study, rather than investigating formation of the depressions, we focus primarily on modification and alteration of the structures after their initial formation. The role of submarine current systems has long been recognised as a significant control on the geomorphology and distribution of oceanic sediments, as evidenced by mappable erosional features on the seafloor (Faugères and Stow Citation1993; Joseph Citation2014; Chen et al. Citation2014; Rebesco et al. Citation2014).
Building on the work of previous studies in this region (Hillman et al. Citation2015; Chenrai and Huuse Citation2017; Waghorn et al. Citation2017) – which focused on the formation of the depressions – we discuss the role that current systems play in the formation and alteration of seafloor depressions. In addition, we discuss an adaptation of the model for the formation of asymmetrical depressions in the North Sea proposed by Andresen et al. (Citation2008). They describe seven stages of depression formation, through which initially circular structures are elongated due to the action of regional contour and localised eddy currents within the depressions.
This paper focuses on two contrasting groups of seafloor depressions; those located in the vicinity of the submarine canyons on the Otago Shelf (Area 1) and on the central Chatham Rise (Area 2). The depressions in Area 1 are small, densely spaced structures (Hillman et al. Citation2015), whereas those in Area 2 are far greater in size, with a long axis diameter of 6–12 km. Our aim is to examine and compare the contrasting morphologies of these two groups of features and investigate the impact of the region’s dynamic submarine currents in re-shaping and modifying these structures. Based on our observations from sub-bottom profiler, boomer seismic and multibeam bathymetry data, and comparison to similar features in other localities, we propose that erosional and depositional processes associated with submarine currents shape and modify seafloor depressions.
Geological background
The continent of Zealandia consists primarily of a series of submarine plateaux, such as the Chatham Rise, separated by troughs and basins () (Mortimer et al. Citation2017). The majority of the submerged portion of Zealandia is mantled by a drape of terrigenous mud and coarser sand or biogenic gravel, sand and ooze (Carter et al. Citation1990, Citation2000). This terrigenous material consists mostly of sediments derived from the uplift of the Southern Alps and volcaniclastic contributions from intermittent large eruptions in the Central Volcanic Region of the North Island (Carter et al. Citation2000; Uruski Citation2010). The Chatham Rise predominantly lies in water depths of < 1000 m with a crest located at 400–600 m below sea level (Cook et al. Citation1989). The rise is underlain by 1500–2500 m of Late Cretaceous and Cenozoic sedimentary units that show increasing marine influence and carbonate content over time (Cook et al. Citation1989).
The crest of the Chatham Rise is predominately composed of Paleogene and Miocene chalk deposits (Wood et al. Citation1989). These units have been exposed locally by episodic current winnowing, and draped by thin, impersistent deposits of authigenic and biogenic silty sand, and localised biogenic gravel and sand deposits with some terrigenous cobbles and pebbles (McDougall Citation1982; Cullen Citation1987; Leduc et al. Citation2015). Pelagic carbonate and hemipelagic sediment mantles both the northern and southern flanks of the Chatham Rise; where sediment cover occurs on steep flanks it is patchy and coarse-grained due to erosion and winnowing by associated deep currents, with mass failure also playing a role (Barnes Citation1992; Bialas et al. Citation2013). Numerous km-scale depressions are found on the central Chatham Rise (Davy et al. Citation2010; Waghorn et al. Citation2017), with smaller depressions (tens to hundreds of metres in diameter) found on the western section of the rise, to the south of the Mernoo Gap (Bialas et al. Citation2013).
To the south of Chatham Rise lies the Bounty Trough and the Canterbury Basin, bordered by the Canterbury Shelf that extends along the southeast coast of South Island (). Cretaceous and Tertiary sediments infilled the Canterbury Basin and covered the shelf; these were deposited during a single, tectonically driven transgressive–regressive cycle (Field et al. Citation1989; Carter et al. Citation1996; Lu et al. Citation2003; Marsaglia et al. Citation2017). Off the coast of Otago, the shelf is incised by seven major submarine canyons in the Otago Submarine Canyon Complex ( and ), which have periodically channelled terrigenous sediment offshore since the early Miocene (Herzer Citation1979; Carter and Mitchell Citation1987; Osterberg Citation2006; Gorman et al. Citation2013). Near-seafloor sediments generally consist of muddy sand with associated calcareous and terrigenous gravel and gravelly sand (Herzer Citation1981; McDougall Citation1982). Numerous small seafloor depressions are found in the vicinity of these canyons, indicating a possible relationship between formation of the depressions and fluid flow dynamics in the canyons (Hillman et al. Citation2015).
Figure 2. Area 1: multibeam bathymetry data. A, Location of Area 1. Bathymetry image source: Mitchell et al. (2012). B, Multibeam bathymetry data acquired during cruises TAN1209, SO168, SO169 and 12PL015. The location of sub-bottom profiler lines and data sets discussed in this paper are shown.
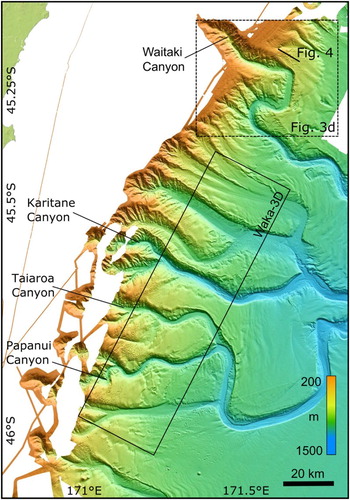
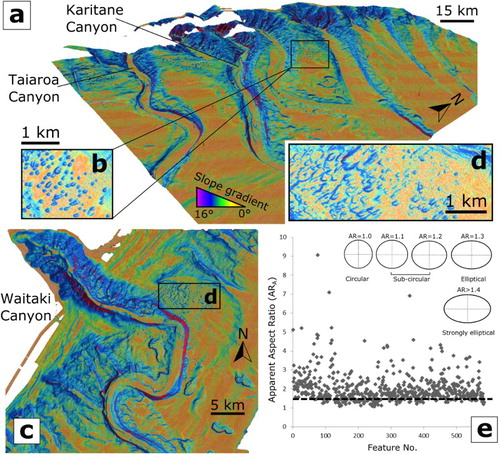
Figure 3. Slope shaded multibeam bathymetry of Area 1. A, Oblique view (from southeast towards northwest) of the Otago Shelf canyon complex showing multibeam bathymetry shaded by slope gradient. B, Sub-section of (A) showing a cluster of seafloor depressions to the north of the Karitane Canyon. The depressions are elongate along a northeast–southwest axis, and are asymmetrical in cross section, shallowing to the northeast. C, Multibeam bathymetry shaded by slope gradient of the Waitaki Canyon – map view (see for location). D, Sub-section of (C) showing elongate, asymmetrical seafloor depressions to the north of the Waitaki Canyon. E, Apparent aspect ratio (ARA) plot of the depressions along the Otago Shelf – 586 features in total – mapped across the extent of the data in . Features with an ARA of > 1.4 (above the black dashed line) are considered strongly elliptical (after Maestrelli et al. Citation2017).
From bathymetric data, it is apparent that not all of the canyons are actively eroding; the majority of them have been abandoned as flow pathways and their thalwegs have migrated over time (Hillman et al. Citation2015). Evidence that these features represent relict channels is provided in cases where the modern flow path has migrated away from the old thalweg (Obelcz et al. Citation2014). It is likely that the formation of these canyons was closely related to highstand/lowstand cycles with increased rates of shelf incision due to mass wasting during lowstand phases resulting in deepening of the canyons (Osterberg Citation2006; Mitchell and Neil Citation2012). Channel infill deposits are likely to have accumulated during lowstand to early transgressive periods, with terrigenous sediment sourced from major river systems being distributed offshore (Carter and Mitchell Citation1987; Osterberg Citation2006; Mitchell and Neil Citation2012). The submarine canyons in the study area are bordered by prominent levees and associated sediment wave fields up to 400 m thick; these formed as a result of channel overspill of coarse sand to silt turbidity currents during glacial periods of wave growth (Carter et al. Citation1990; Lu et al. Citation2003; Lu and Fulthorpe Citation2004).
Oceanography
There are two surface water masses off the east coast of South Island, Subtropical Water (STW) and Subantarctic Water (SAW), separated by the Subtropical Front (STF) () (Heath Citation1985; Chiswell and Rickard Citation2006; Collins et al. Citation2011). The STF is a complex and irregular frontal zone of enhanced meridional temperature and salinity gradients comprising large meanders and eddies (Chiswell Citation1994; Sutton Citation2003). It is geographically constrained and controlled by regional bathymetry, encircling the globe at approximately 45°S (Sutton Citation2001; Hadfield et al. Citation2007). The STW is characterised by highly saline, nutrient-depleted, warm surface water, in contrast to the less saline, nutrient-rich, cool SAW sourced from waters to the south of New Zealand (Heath Citation1972; Sutton Citation2003). In the vicinity of the STF southeast of New Zealand, these surface waters flow northeast along the continental margin before being deflected to the east by the Chatham Rise at approximately 43°S, with the strongest thermal gradients occurring at c. 500 m water depth (Chiswell Citation1994; Uddstrom and Oien Citation1999; Sutton Citation2003; Chiswell and Rickard Citation2006). The major surface currents originate from two arms of the eastward flowing Tasman Inflow, sourced from the South Pacific Deep Western Boundary Current (DWBC) () (Stanton Citation1981; Carter et al. Citation1996; McCave et al. Citation2008). The path of this deep flow is constrained by regional bathymetry, resulting in the current passing around the eastern end of the Chatham Rise.
Underlying the SAW, at depths of 600–1450 m, is the major northward-spreading Antarctic Intermediate Water (AAIW). AAIW is sourced from the south, taking the shortest route from the Antarctic Convergence, and is characterised by salinities of 34.3–34.5 and temperatures of 3–7 °C (Sutton Citation2001; Hadfield et al. Citation2007). As with the overlying water masses, the distribution of AAIW is strongly influenced by bathymetry. In addition to AAIW there are two other subsurface water masses in this region: Subantarctic Mode Water (SAMW) and Circumpolar Deep Water (CPDW). SAMW is often considered a component of AAIW, lying to the north of the surface position of the STF at depths of 300–700 m as an isothermal subsurface layer. The remainder of the water column, underlying the AAIW below depths of c. 1450 m in this region, consists of CPDW.
Previous work on seafloor depressions offshore New Zealand
The seafloor depressions off the east coast of South Island have been the focus of several research groups over the last few years; here we provide a brief summary of previous work that has been published. Davy et al. (Citation2010) proposed that the large seafloor depressions on the Chatham Rise may have formed as a result of gas hydrate dissociation triggered by sea level fall during glacial–interglacial cycles. Hillman et al. (Citation2015) used multibeam bathymetry and industry 3D seismic data to investigate hundreds of small, densely clustered seafloor depressions, near the Otago Submarine Canyon Complex. These depressions have long axis diameters of 20–700 m and seafloor reliefs of 10–20 m, are elongate in a northeast–southwest orientation, and ovoid to elliptical in shape (Hillman et al. Citation2015). The depressions are constrained to water depths of 550–1100 m. Although seafloor depressions are present along the full extent of the multibeam bathymetry data on the Otago continental slope, the largest concentrations of depressions are adjacent to actively eroding canyons with significant intra-canyon features, notably the Karitane and Waitaki canyons (Hillman et al. Citation2015). Chenrai and Huuse (Citation2017) studied paleo-depressions, of a similar size to those on the Otago Shelf, imaged in 3D seismic data in the Taranaki Basin, off the west coast of the North Island (A). Both studies propose that groundwater flux, or overpressured sediment-bound fluids, may have played a role in the formation of these depressions (Hillman et al. Citation2015; Chenrai and Huuse Citation2017). Waghorn et al. (Citation2017) focused on larger, irregular depressions and paleo-depressions on the Chatham Rise, to the west of our study area. They conclude that these depressions are the result of re-worked contourite sediment deposition above an underlying polygonal fault system that is related to fluid expulsion (Waghorn et al. Citation2017). In addition to these studies, further work focusing on seafloor depressions around New Zealand is currently ongoing. In this study we refer to these previous studies and, in particular, expand upon the work by Hillman et al. (Citation2015) on the Otago Shelf depressions.
Materials and methods
Here, we present multibeam bathymetry, sub-bottom profiler and boomer seismic data acquired during the 2012 TAN1209 cruise on the R/V Tangaroa, the 2013 SO226 cruise on the R/V Sonne and the 2013 13PL235 cruise on the R/V Polaris II (Mitchell and Neil Citation2012; Bialas et al. Citation2013). A hull-mounted Kongsberg EM120 multibeam echosounder (MBES) was used to acquire multibeam bathymetry data during cruise SO226, generating 191 beams with operational frequencies ranging from 11.25 to 12.60 kHz (Bialas et al. Citation2013). During cruise TAN1209, a hull-mounted Kongsberg Simrad EM302 was used, with an operational frequency of 30 kHz and a swath width of 130°. Multibeam bathymetry data were first calibrated for roll-offset, and then processed using MBSystem® software to remove spikes and other anomalous soundings. Grids of bathymetric data across the survey area were created with a resolution of 25 × 25 m. Using these grids, seafloor depressions were mapped in ArcGIS® to calculate the apparent aspect ratio (ARA) of the depressions.
Sub-bottom profiler data were collected during SO226 using a hull-mounted parametric sub-bottom profiler, Atlas Hydrographic Parasound P70. This provides a signal penetration of up to 150 m and vertical resolution of c. 0.17 m. Boomer data were collected during cruise 13PL235 using a Ferranti Ocean Research Equipment (ORE) Geopulse sub-bottom profiling system, combined with a 75 m long Geometrics MicroEel 24-channel streamer, with 24 groups of three hydrophones and a channel spacing of 3.125 m, deployed c. 27 m off the stern of the vessel. The multichannel boomer data were processed with GLOBE Claritas® software. Non-live traces were removed, geometry information was added to the files and the traces were sorted by common depth point (CDP). A stack of the data was then produced using a simple normal move-out (NMO) velocity model based on assumed sound speed velocities in the ocean and shallow seafloor and seafloor reflection travel times. Interval velocity files were generated for each line, based on the NMO velocities, which were then used to migrate the stack.
Results
Area 1: Otago Shelf
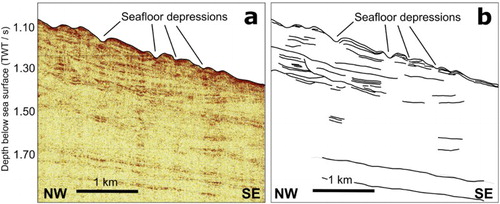
As discussed previously, the depressions in Area 1 are small (tens to hundreds of metres in diameter) and densely spaced (). Slope shaded bathymetry and the calculated apparent aspect ratios show that the depressions are highly elliptical (). Owing to the small size of the depressions in Area 1 it is not possible to resolve structures within these features in the high-resolution boomer data (); however bathymetric data clearly show that individual depressions consistently shallow out towards the northeast. The upper section of the seafloor underlying the depressions consists of chaotic facies that are typical of sediment wave field deposits ().
Figure 4. A,B, Interpreted boomer seismic line. This line crosses the field of seafloor depressions to the north of the Waitaki Canyon (see for line location). The seafloor depressions are underlain by turbulent strata characteristic of a sediment wave field. There is evidence of truncated sediment layers along the walls of the depressions; however, due to the small size of the structures this is difficult to resolve.
Area 2: Chatham Rise
The depressions on the central Chatham Rise are far greater in size than those on the Otago margin, with a long-axis diameter of 6–12 km. Multibeam bathymetry data show that the depressions occur in a depth range of 500–900 m and have reliefs of 50–150 m. Bathymetric data and subsurface profiles show that, as in Area 1, the seafloor depressions in Area 2 are asymmetric in cross section. Bathymetric data also reveal similarities in the geomorphology of the seafloor depressions; the ‘giant’ depressions (A–C) in Area 2 are similarly elongated in one axis and oval in shape, as shown by the apparent aspect ratios of > 1.4 (). However, unlike those in Area 1, two are elongated along an north–south trend, with the other trending northwest–southeast (). These features are defined by a steep scarp to the east, and a gentler slope to the west, resulting in sub-rounded to crescent-shaped geomorphologies. Sub-bottom profiler data show that the scarps truncate several well-defined horizons to the east, indicating that these are erosional features (). Through correlation to core samples and underwater video tows, these horizons are interpreted as calcareous oozes (Hillman et al. Citation2017). Subsurface profiles from Area 2, crossing the southernmost structure (depression A in ), clearly show that the seafloor depressions are partially infilled by a series of finely layered, coherent units that overlap a distinctive wavy horizon, creating an overall sigmoidal geometry in cross section (). The internal fill of the depressions is interpreted as sediment drift deposits, characterised by a mounded, asymmetrical geometry with subparallel internal reflectors (Marani et al. Citation1993; Masson et al. Citation2002; Hillman et al. Citation2017). The wavy horizon underlying the sediment drift deposits is interpreted as an erosional unconformity at the base of the depression. Beneath depression A there is some evidence of minor faulting across a c. 100 m zone, which may be interpreted as being associated with a vent structure (C,D). These faults do not extend into the sediment drift deposit infilling the depression.
Figure 5. A, Multibeam bathymetry map of the giant seafloor depressions (depressions A–C) on the Chatham Rise surveyed during cruise SO226. Locations of subsurface profile lines are marked with thin black lines. The present-day location of the Subtropical Front (STF) is indicated by the dark grey arrow. Inset, Calculated apparent aspect ratios (ARA) for depressions A–C (Maestrelli et al. Citation2017), these values show that the depressions are strongly elliptical. B, Slope shaded image of the giant seafloor depressions. Data source: GEOMAR, 2013.
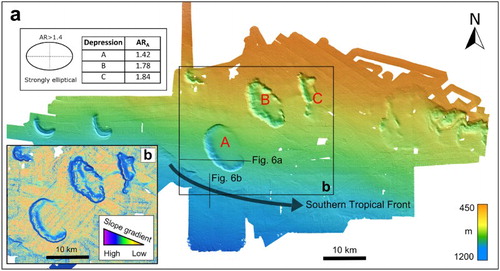
Figure 6. Sub-bottom profiler data from the Chatham Rise. A, Profile showing a cross section of seafloor depression A. B, Line drawing interpretation of A. The western edge of the depression is characterised by an erosional scarp truncating a high amplitude reflection at a depth of c. 30 m below the seafloor. The depression has been filled by sediment drift deposits overlying an erosional unconformity at the base of the depression. C, North–south transect across the erosional ledge to the south of the survey area. D, Line drawing interpretation C.
Unlike depression A (), depression B is infilled by numerous sediment drift deposits that result in an irregular geomorphology. The depression is deepest along the western periphery, as in depression A; however, there are also small indentations along the eastern side of the depression. Depression C, to the northeast, is significantly smaller than depression A and depression B and is more linear in a roughly north–south orientation; however, in cross section the structure is very similar to that of the larger depressions. The depression is irregular in shape and, similar to depression A, is infilled to the northeast by sediment drift deposits creating an asymmetric cross section ().
In contrast to Area 1, the seafloor depressions in Area 2 lie on the southern flank of the central Chatham Rise, where the seafloor is relatively uniform in morphology. There are other depression structures in the area to the west of Area 2; however, these are more irregular in shape and smaller in size (Bialas et al. Citation2013; Waghorn et al. Citation2017). The two crescent-shaped features to the west of depressions A–C were not examined further in this study due to the limited availability of seismic data in this area (). To the south of depressions A–C, a distinct ledge is observed at a water depth of c. 970 m (C). South of this ledge, several overlapping sediment drift deposits are underlain by an erosional unconformity (D). This ledge is interpreted to have formed as a result of scouring by currents associated with the STF along the southern edge of the Chatham Rise (B) (Bialas et al. Citation2013).
Discussion
In this study, we focus on the role that submarine currents associated with the STF have played in shaping seafloor depressions. The initial formation of the depressions will, of course, have played a role in determining the morphology of the final structures, particularly with the large depressions in Area 2. As discussed by Hillman et al. (Citation2015), currents associated with the STF may have been a key factor during formation of the seafloor depressions on the Otago Shelf (Area 1). This mechanism of formation cannot, however, fully explain formation of the larger seafloor depressions on the Chatham Rise (Area 2). The depressions in Area 2 are several orders of magnitude larger; the two largest features are c. 12 km in diameter, making them among the largest seafloor depressions found worldwide (Andresen et al. Citation2008). Formation of these structures required the removal of significant volumes of sediment, in particular, the erosion of carbonate-rich, calcareous ooze units, as observed in the sub-bottom profiler data (). It is feasible for gradual, continuous fluid flux to displace large volumes of sediment over a prolonged period (Wenau et al. Citation2017); however, it is improbable that this mechanism could be wholly responsible for the formation of such kilometre-scale features, requiring the erosion of units such as the lithified calcareous oozes. Several other factors have been proposed for the formation of these depressions, including links to underlying polygonal fault systems, dissociation of gas hydrates, dewatering related to opal-A to opal-CT phase conversion, and groundwater flux in the vicinity of submarine canyons (Davy et al. Citation2010; Hillman et al. Citation2015; Waghorn et al. Citation2017). There is evidence of a possible minor vent structure beneath depression A (C), which might suggest that gas venting has played a role in its formation; however, geochemical data from cruise SO226 does not support this hypothesis (Bialas et al. Citation2013; Coffin et al. Citation2013). In addition, faulting and vent structures are not observed beneath depressions A and C. At this stage, however, the precise mechanisms responsible for formation of the initial structures remain enigmatic.
Submarine currents are efficient agents of particle transport and redistribution and play a major role in shaping seafloor geomorphology (Faugères and Stow Citation1993; Marani et al. Citation1993). In both study areas (Areas 1 and 2), the seafloor depressions are elongated and asymmetric in cross section due to the action of oceanic currents in the region. As discussed by Hillman et al. (Citation2015), the continental shelf in this region is strongly affected by the shore-parallel STF and associated current systems () (Sutton Citation2001; IODP317 Expedition Scientists Citation2010). Previous studies (e.g. Andresen et al. Citation2008; Schattner et al. Citation2016) have shown that processes that are active in the sedimentary environment in which seafloor depressions form, such as current scour erosion, gravity sliding, tidal flow and storm waves, may significantly affect depression geomorphology.
Contour currents
The consistent northeast-southwest alignment of depressions in Area 1 correlates with the dominant flow direction of the contour currents associated with the STF in this area toward the northeast ( and ), a concept that was previously discussed by Hillman et al. (Citation2015). It is therefore probable that these depressions have been substantially modified by along-slope currents following their initial formation, which is consistent with observations of similar structures worldwide (e.g. Bøe et al. Citation1998; Hovland et al. Citation2002; Hübscher and Borowski Citation2006; Andresen et al. Citation2008; Hammer et al. Citation2009). The trend of partially infilled depressions in Area 1, indicates that current flow over depressions facilitates focused erosion at the downstream edge of the structures and deposition of sediment in the upstream direction (Hammer et al. Citation2009). In contrast, the general trend in alignment of the large features in Area 2 (north–south) is not consistent with the dominant eastward flow direction of the STF along the Chatham Rise. This suggests that, although current activity has played an active role in the modification of these structures, other factors were likely involved in initial formation of the depressions. There is no evidence in the data of structures underlying the depressions, such as faults or submerged channels that could explain their alignment. The area surrounding the depressions is characterised by uniformly layered sediments. The slope gradient along the southern flank of the Chatham Rise is relatively low (1–3°), with the depressions aligned perpendicular to the slope. This indicates that the slope may influence the alignment of the depressions; however, with such a minimal gradient it is difficult to say whether this is the primary controlling factor. As with Area 1, the pattern of asymmetric drift deposits infilling the depressions is consistent with the current flow direction, because the depressions are deepest to the west, shallowing to the east.
The action of contour currents can be associated with the development of ‘drift and moat’ structures, a phenomenon that could help to explain the asymmetric shape of the seafloor depressions in study Area 2 (Chen et al. Citation2014; Schattner et al. Citation2016). Lu et al. (Citation2003) describe this process in the Canterbury Basin, and Marani et al. (Citation1993) also document similar features in the Mediterranean, where the action of contour currents resulted in the formation of mounded drift deposits bounded by an erosional moat that indicates the location of focused or accelerated current activity. Although the features described by Lu et al. (Citation2003) and Marani et al. (Citation1993) are regional in nature, a similar interpretation may be applied at a more localised scale to the moat-bounded sediment drift deposits found in Area 2 depressions. Using the Hjülstrom–Sundborg curve, we can draw some general conclusions regarding the possibility that the current systems in this region would have sufficient force to move large volumes of near seafloor sediment ().
Figure 7. Hjülstrom–Sundborg curve (after Hjulstrom Citation1939; Sundborg Citation1956) showing typical grain size values for the two study areas. Grain size data from Hillman et al. (Citation2017) and Marsaglia et al. (Citation2017).
Hillman et al. (Citation2017) and Marsaglia et al. (Citation2017) show that the grain size of near seafloor sediments on the Canterbury Slope, Chatham Rise and Otago Shelf is in the range of 0.006–0.3 mm. Determining the current velocities in the region is more problematic because the currents experience seasonal variability and have shifted over glacial–interglacial cycles; in addition, during glacial periods when sea level was c. 120 m lower, the currents would have had a greater potential to mobilise sediment (Davy et al. Citation2010; Miller et al. Citation2011). Based on published studies such as Chiswell (Citation2003) and Hadfield et al. (Citation2007) it is likely that current velocities in the region at present day are c. 0.2 m/s. The Hjülstrom–Sundborg curve () indicates that the expected current velocities would be able to mobilise unconsolidated sediment in the expected grain size range, and thereby could have contributed to the present-day seafloor geomorphology. This is consistent with the observations of similar studies off Brazil by Schattner et al. (Citation2016) and de Mahiques et al. (Citation2017).
Eddy currents
In addition to the primary flow direction of currents associated with the STF, eddy currents may also have played a role in the modification of the seafloor depressions. Studies in the South China Sea have shown that meso- and sub-mesoscale eddies may be active on a regional basin scale, acting in combination with meandering submarine currents (Joseph Citation2014; Zhang et al. Citation2015). Mesoscale eddy currents may be induced by the meandering pattern of currents flowing along the shelf-break and slope or as a result of topographic irregularities such as seamounts interrupting current flow (Sumida et al. Citation2004; Stow et al. Citation2008; Rebesco et al. Citation2014). Such eddy currents may play a significant role in the transportation of fine-grained suspended sediments, perhaps explaining the accumulation of fine-grained sediment drift deposits infilling the depressions in Area 2 ( and ) (Sumida et al. Citation2004; Zhang et al. Citation2015). The presence of eddy currents around New Zealand has been well established; however, the scarcity of data in the vicinity of the Chatham Rise makes understanding the distribution of these phenomena problematic (Fenner et al. Citation1992; Chiswell Citation2003; Sutton Citation2003; Chiswell and Rickard Citation2006; Gorman et al. Citation2018). It has been proposed that eddy current formation is favoured at the contact between laterally variable water masses; in this case, the STF provides the ideal conditions for eddy formation to occur along the Chatham Rise at the boundary between the STW and SAW (Serra et al. Citation2009; Rebesco et al. Citation2014).
Model of current modification of depressions
Previous studies by Andresen et al. (Citation2008) and Schattner et al. (Citation2016) have demonstrated that eddy currents can modify initially circular seafloor depressions into asymmetrical structures, such as those seen on the Chatham Rise. We propose that, although other factors were responsible for the initial formation of these depressions, resulting in the development of potentially smaller structures, it is possible to adapt the model for pockmark formation proposed by Andresen et al. (Citation2008) to illustrate the role of submarine currents in the formation of the depressions in Area 2 (). Initial formation of an irregularity on the seafloor could occur due to enhanced erosion by a temporarily stationary eddy current (Chiswell Citation2003; Chiswell and Rickard Citation2006; Condie and Condie Citation2016), a slight adjustment to the path of the currents associated with the STF, or the localised interaction of the eastward flowing current and a locally westward flowing current (Carter and Wilkin Citation1999; Schattner et al. Citation2016). Alternatively, an irregularity may form as a result of gas venting or fluid expulsion, as discussed earlier (Davy et al. Citation2010; Hillman et al. Citation2017; Waghorn et al. Citation2017). Once an initial irregularity is formed, it could be exploited and eroded by the STF, forming larger depressions. However, it is unlikely that this would be sufficient to form depressions of up to 12 km in diameter.
Figure 8. Modification of seafloor depressions by eddy currents (adapted from Andresen et al., Citation2008). A, Initial depression in plan view. B, Initial depression in cross section, position of erosional currents and direction of regional current flow (STF) marked. C, Area 1 – erosion by regional currents resulting in formation of asymmetrical, elongate depressions as sediment drift deposits (SDD) accumulate. D, Area 2 – peripheral erosion by regional and eddy currents resulting in formation of a crescent-shaped depression as sediment drift deposits (SDD) accumulate. E, Cross sections of depressions at areas 1 and 2 derived from bathymetric data, illustrating the action of current modification.
One contradictory feature that does not agree with the model presented by Andresen et al. (Citation2008), is that the depressions in this study have been eroded out to form initially relatively uniform ‘bowl-shaped’ depressions. These structures have subsequently been infilled by sediment drift deposits. If current activity was the primary formation mechanism for the depressions, something in the hydrological regime must have changed to cause the switch from erosional to depositional currents. This change could be explained by variability in the current systems over glacial–interglacial cycles, combined with the decrease in sea level during the last glacial period that resulted in enhanced basal scouring. As discussed earlier, the variable sedimentation along the Otago Shelf indicates that the current systems migrated up and down slope during glacial–interglacial cycles (IODP317 Expedition Scientists Citation2010; Fulthorpe et al. Citation2011). During glacial periods when currents are strengthened by glacial wind systems and sea levels were c. 120 m lower, erosion of the depressions would be enhanced as currents would have a higher velocity than their highstand equivalents (Bostock et al. Citation2006; Böning et al. Citation2008; Miller et al. Citation2011; Browne et al. Citation2017). Then, as currents weaken during the subsequent interglacial period, deposition would be favoured. Another phenomena that could explain the episodic strengthening of current velocities is that of benthic or abyssal storms, events which may result in the periodic intensification of flow by two to five times that of normal velocities (Hollister and McCave Citation1984; Hollister Citation1993; Rebesco et al. Citation2014). However, these processes are not well understood and have not been documented in this region.
The model described by Andresen et al. (Citation2008) predicts deposition of authigenic carbonate at the centre of the depressions and current winnowing of sediments around their peripheries. However, no evidence for this process is observed in Area 2 and no authigenic carbonate deposits are observed infilling the depressions. Although calcareous ooze or chalk units are observed in core samples and underwater video tows from the area, these are probably of Miocene age and pre-date depression formation (Bialas et al. Citation2013; Coffin et al. Citation2013). This is evidenced by the sharp truncation of these chalk units along the western edge of depressions A and C (). The concept of current action resulting in preferential winnowing of sediments around the periphery of the depressions may explain the asymmetric, crescent-shaped geomorphology of the depressions. Regional currents associated with the path of the STF flow eastward along the Chatham Rise are consistent with the model of erosion and deposition adapted from Andresen et al. (Citation2008), as shown in . Miocene chalk outcrops along the western edge of the depressions have not been blanketed by fine grained sediments such as those seen infilling the depressions, indicating that current action is ongoing (Hillman et al. (Citation2017, figure 12).
Conclusions
In this study we have presented data from the two areas (Otago Shelf and Chatham Rise) of contrasting seafloor geomorphology that are variably influenced by submarine currents of the STF. The hydrodynamic processes acting on the seafloor in this area are the result of the complex interaction of deep sea circulation and surface current activity. Data from this study reveal the importance of these powerful current systems in altering and modifying the geomorphology of the seafloor in dramatically different oceanographic settings.
Although other processes are likely to have been involved in the formation of the initial depressions in this region, we demonstrate that scale-independent processes related to submarine currents subsequently acting on the structures in both study areas have dramatically modified and altered their geomorphology and seafloor expression. We propose a model that illustrates how bathymetrically constrained unidirectional current flow across the seafloor depressions has reshaped these structures, resulting in similar depression geometries at both sites, irrespective of the size of the features. In Area 1, the action of submarine currents may have played a role in the formation of the decametre-scale seafloor depressions, and unidirectional current flow has subsequently resulted in the enlargement and alignment of the depressions with the dominant flow direction. In Area 2 we propose that eddy currents may have been present and might have been a significant factor in the enlargement and shaping of the depressions; however, other factors are likely to have been responsible for the initial depression formation. The complex relationship between unidirectional and eddy current flow could explain the formation of these kilometre-scale elliptical depressions, aligned across the dominant current flow direction.
Acknowledgements
We gratefully acknowledge Anadarko NZ Ltd, Origin Energy, the National Institute of Water and Atmospheric Research (NIWA), the Oceans 2020 Survey, Land Information New Zealand (LINZ), the University of Otago, the United States Naval Research Laboratory (USNRL) and the Helmholtz Centre for Ocean Research (GEOMAR) for the provision of data presented in this paper. Thanks to the captains and crews of the R/V Tangaroa, R/V Polaris II, R/V Sonne and M/V Nordic Explorer. Thanks also to Esri ArcGIS®, GLOBE Claritas® and IHS Kingdom® for access to academic software licences used in data analysis. This work was supported by the New Zealand Marsden Fund, Grant GNS1005. Funding for the SO226 cruise was provided by the German Federal Ministry of Education and Research Grant 03G0226A issued to GEOMAR. Thanks to Hamish Bowman at the University of Otago for his help with data processing. The manuscript was greatly improved following revisions and comments by Dr Greg Browne, Dr Nick Mortimer and an anonymous reviewer. We also thank the associate editor Dr Brent Alloway for his assistance.
Disclosure statement
No potential conflict of interest was reported by the authors.
ORCID
Jess I. T. Hillman http://orcid.org/0000-0002-3798-0597
Ingo Klaucke http://orcid.org/0000-0002-2631-6615
Ingo A. Pecher http://orcid.org/0000-0001-7397-5069
Andrew R. Gorman http://orcid.org/0000-0002-8581-0197
Jens Schneider von Deimling http://orcid.org/0000-0002-9889-1408
Joerg Bialas http://orcid.org/0000-0001-8802-5277
Additional information
Funding
References
- Andresen KJ, Huuse M. 2011. “Bulls-eye” pockmarks and polygonal faulting in the Lower Congo Basin: relative timing and implications for fluid expulsion during shallow burial. Mar Geol. 279:111–127. doi: 10.1016/j.margeo.2010.10.016
- Andresen KJ, Huuse M, Clausen OR. 2008. Morphology and distribution of Oligocene and Miocene pockmarks in the Danish North Sea – implications for bottom current activity and fluid migration. Basin Res. 20:445–466. doi: 10.1111/j.1365-2117.2008.00362.x
- Barnes PM. 1992. Mid-bathyal current scours and sediment drifts adjacent to the Hikurangi deep-sea turbidite channel, eastern New Zealand: evidence from echo character mapping. Mar Geol. 106:169–187. doi: 10.1016/0025-3227(92)90128-5
- Best JL, Fielding CR, Jarvis I, Mozley P. 2009. Sedimentology: millenium reviews – The journal of the international association of sedimentologists. London, UK: John Wiley & Sons.
- Bialas J, Klaucke I, Mögeltönder J, editors. 2013. RV SONNE Fahrtbericht/Cruise Report SO226 - CHRIMP CHatham RIse Methane Pockmarks GEOMAR Report, N. Ser. 007. GEOMAR Helmholtz-Zentrum für Ozeanforschung, Kiel, Germany, Kiel, Germany.
- Bøe R, Rise L, Ottesen D. 1998. Elongate depressions on the southern slope of the Norwegian Trench (Skagerrak): morphology and evolution. Mar Geol. 146:191–203. doi: 10.1016/S0025-3227(97)00133-3
- Böning CW, Dispert A, Visbeck M, Rintoul SR, Schwarzkopf FU. 2008. The response of the Antarctic circumpolar current to recent climate change. Nat Geosci. 1:864–869. doi: 10.1038/ngeo362
- Bostock HC, Opdyke BN, Gagan MK, Kiss AE, Fifield LK. 2006. Glacial/interglacial changes in the East Australian current. Clim Dyn. 26:645–659. doi: 10.1007/s00382-005-0103-7
- Browne IM, Moy CM, Riesselman CR, Neil HL, Curtin LG, Gorman AR, Wilson GS. 2017. Late Holocene intensification of the westerly winds at the subantarctic Auckland Islands (51° S), New Zealand. Clim Past Discuss. 13:1–37. doi: 10.5194/CP-2017-52
- Carter L, Carter RM, Nelson CS, Fulthorpe CS, Neil HL. 1990. Evolution of pliocene to recent abyssal sediment waves on Bounty channel levees, New Zealand. Mar Geol. 95:97–109. doi: 10.1016/0025-3227(90)90043-J
- Carter L, Mitchell JS. 1987. Late Quaternary sediment pathways through the deep ocean, east of New Zealand. Paleoceanography. 2:409–422. doi: 10.1029/PA002i004p00409
- Carter L, Neil HL, McCave IN. 2000. Glacial to interglacial changes in non-carbonate and carbonate accummulation in the SW Pacific Ocean, New Zealand. Palaeogeogr Palaeoclimatol Palaeoecol. 162:333–356. doi: 10.1016/S0031-0182(00)00137-1
- Carter L, Wilkin J. 1999. Abyssal circulation around New Zealand—a comparison between observations and a global circulation model. Mar Geol. 159:221–239. doi: 10.1016/S0025-3227(98)00205-9
- Carter RM, Carter L, McCave IN. 1996. Current controlled sediment deposition from the shelf to the deep ocean: the Cenozoic evolution of circulation through the SW Pacific gateway. Geol Rundschau. 85:438–451. doi: 10.1007/Bf02369001
- Chen H, Xie X, Van Rooij D, Vandorpe T, Su M, Wang D. 2014. Depositional characteristics and processes of alongslope currents related to a seamount on the northwestern margin of the Northwest Sub-Basin, South China Sea. Mar Geol. 355:36–53. doi: 10.1016/j.margeo.2014.05.008
- Chenrai P, Huuse M. 2017. Pockmark formation by porewater expulsion during rapid progradation in the offshore Taranaki Basin, New Zealand. Mar Pet Geol. 82:399–413. doi: 10.1016/j.marpetgeo.2017.02.017
- Chiswell SM. 1994. Acoustic Doppler current profiler measurements over the Chatham Rise. New Zeal J Mar Freshw Res. 28:167–178. doi: 10.1080/00288330.1994.9516605
- Chiswell SM. 2003. Circulation within the Wairarapa Eddy, New Zealand. New Zeal J Mar Freshw Res. 37:691–704. doi: 10.1080/00288330.2003.9517199
- Chiswell SM, Rickard GJ. 2006. Comparison of model and observational ocean circulation climatologies for the New Zealand region. J Geophys Res. 111:1–22. doi: 10.1029/2006JC003489
- Cobianchi M, Mancin N, Lupi C, Bordiga M, Bostock HC. 2015. Effects of oceanic circulation and volcanic ash-fall on calcite dissolution in bathyal sediments from the SW Pacific Ocean over the last 550ka. Palaeogeogr Palaeoclimatol Palaeoecol. 429:72–82. doi: 10.1016/j.palaeo.2015.03.045
- Coffin RB, Boyd TJ, Rose PS, Yoza B, Milholland LC, Downer R, Woods S. 2013. Geochemical cruise report: SO226/2 RV sonne Chatham Rise expedition. Washington, DC, USA: US Naval Research Laboratory.
- Collins JA, Molnar P, Sheehan AF. 2011. Multibeam bathymetric surveys of submarine volcanoes and mega-pockmarks on the Chatham Rise, New Zealand. New Zeal J Geol Geophys. 54:329–339. doi: 10.1080/00288306.2011.589860
- Condie S, Condie R. 2016. Retention of plankton within ocean eddies. Glob Ecol Biogeogr. 25:1264–1277. doi: 10.1111/geb.12485
- Cook RA, Wood RA, Campbell HJ. 1989. The Chatham Rise: an exploration frontier. 1989 petroleum conference; Ministry of Economic Development, New Zealand Petroleum and Minerals, New Zealand. p. 35–41.
- Cullen DJ. 1987. The submarine phosphate resource on central Chatham Rise. Wellington, New Zealand: National Institute of Water and Atmospheric Research (NIWA).
- Davy B, Pecher I, Wood R, Carter L, Gohl K. 2010. Gas escape features off New Zealand: evidence of massive release of methane from hydrates. Geophys Res Lett. 37:1–5. doi: 10.1029/2010GL045184
- Faugères J-C, Stow DAV. 1993. Bottom-current-controlled sedimentation: a synthesis of the contourite problem. Sediment Geol. 82:287–297. doi: 10.1016/0037-0738(93)90127-Q
- Fenner J, Carter L, Stewart R. 1992. Late Quaternary paleoclimatic and paleoceanographic change over northern Chatham Rise, New Zealand. Mar Geol. 108:383–404. doi: 10.1016/0025-3227(92)90206-W
- Field BD, Browne GH, Davy B, Herzer RH, Hoskins RH, Raine JI, Wilson GJ, Sewell RJ, Smale D, Watters WA. 1989. Creteaceous and Cenozoic sedimentary basins and geological evolution of the Canterbury region, South Island, New Zealand. Wellington, New Zealand: New Zealand Geological Survey.
- Fildani A, Normark WR, Kostic S, Parker G. 2006. Channel formation by flow stripping: large-scale scour features along the Monterey East channel and their relation to sediment waves. Sedimentology. 53:1265–1287. doi: 10.1111/j.1365-3091.2006.00812.x
- Fulthorpe CS, Hoyanagi K, Blum P, IODP Expedition 317 Scientists. 2011. IODP expedition 317: exploring the record of Sea-Level change Off New Zealand. Sci Drill. 12:4–14. doi: 10.5194/sd-12-4-2011
- Gorman AR, Hill MG, Orpin AR, Koons PR, Landis CA, Allan TMH, Johnstone T, Gray FL, Wilson D, Osterberg E. 2013. Quaternary shelf structures SE of the South Island, imaged by high-resolution seismic profiling. New Zeal J Geol Geophys. 56:68–82. doi: 10.1080/00288306.2013.772906
- Gorman AR, Smillie MW, Cooper JK, Bowman MH, Vennell R, Holbrook WS, Frew R. 2018. Seismic characterization of oceanic water masses, water mass boundaries and Mesoscale Eddies SE of New Zealand. J Geophys Res Ocean. doi: 10.1002/2017JC013459
- Hadfield MG, Rickard GJ, Uddstrom MJ. 2007. A hydrodynamic model of the Chatham Rise, New Zealand. New Zeal J Mar Freshw Res. 41:239–264. doi: 10.1080/00288330709509912
- Hammer O, Webb KE, Depreiter D. 2009. Numerical simulation of upwelling currents in pockmarks, and data from the Inner Oslofjord, Norway. Geo-Marine Lett. 29:269–275. doi: 10.1007/s00367-009-0140-z
- Hardage BA, Carr DL, Lancaster DE, Simmons JL, Elphick RY, Pendelton VM, Johns RA. 1996. 3-D seismic evidence of the effects of carbonate karst collapse on overlying clastic startigraphy and reservoir compartmentalisation. Geophysics. 61:1336–1350. doi: 10.1190/1.1444057
- Heath RA. 1972. The Southland current. New Zeal J Mar Freshw Res. 6:497–533. doi: 10.1080/00288330.1972.9515444
- Heath RA. 1985. A review of the physical oceanography of the seas around New Zealand — 1982. New Zeal J Mar Freshw Res. 19:79–124. doi: 10.1080/00288330.1985.9516077
- Heiniö P, Davies RJ. 2009. Trails of depressions and sediment waves along submarine channels on the continental margin of Espirito Santo Basin, Brazil. GSA Bull. 121:698–711. doi: 10.1130/B26190.1
- Herzer RH. 1979. Submarine landslides and submarine canyons on the continental slope off Canterbury, New Zealand. New Zeal J Geol Geophys. 22:391–406. doi: 10.1080/00288306.1979.10424107
- Herzer RH. 1981. Ellesmere sediments. New Zealand Oceanographic Institute Coastal Chart Series 1:200 000 sediments.
- Hillman JIT, Gorman AR, Pecher I. 2015. Geostatistical analysis of seafloor depressions on the southeast margin of New Zealand’s South Island — Investigating the impact of dynamic near seafloor processes on geomorphology. Mar Geol. 360:70–83. doi: 10.1016/j.margeo.2014.11.016
- Hillman JIT, Lamarche G, Pallentin A, Pecher IA, Gorman AR, von Deimling JS. 2017. Validation of automated supervised segmentation of multibeam backscatter data from the Chatham Rise, New Zealand. Mar Geophys Res. 1–23. doi: 10.1007/s11001-016-9297-9
- Hjulstrom F. 1939. Transportation of detritus by moving water: Part 1. Transportation. In: Trask PD, editor. Recent mar sediments. Vol. 142. AAPG Special Volumes, Tulsa, OK; p. 5–31.
- Hollister CD. 1993. The concept of deep-sea contourites. Sediment Geol. 82:5–11. doi: 10.1016/0037-0738(93)90109-I
- Hollister CD, McCave IN. 1984. Sedimentation under deep-sea storms. Nature. 309:220–225. doi: 10.1038/309220a0
- Hovland M, Gardner JV, Judd AG. 2002. The significance of pockmarks to understanding fluid flow processes and geohazards. Geofluids. 2:127–136. doi: 10.1046/j.1468-8123.2002.00028.x
- Hübscher C, Borowski C. 2006. Seismic evidence for fluid escape from Mesozoic cuesta type topography in the Skagerrak. Mar Pet Geol. 23:17–28. doi: 10.1016/j.marpetgeo.2005.07.004
- IODP317 Expedition Scientists. 2010. Integrated ocean drilling program expedition 317 preliminary report: Canterbury Basin sea level – global and local controls on continental margin stratigraphy. Integrated Ocean Drilling Program. 317:1–133.
- Joseph A. 2014. Measuring ocean currents: tools, technologies, and data. Waltham, MA: Elsevier. doi: 10.1016/B978-0-12-415990-7.01001-2
- Judd A, Hovland M. 2007. Seabed fluid flow: the impact on geology, biology and the marine environment. Cambridge, UK: Cambridge University Press.
- Leduc D, Rowden AA, Torres LG, Nodder SD, Pallentin A. 2015. Distribution of macro-infaunal communities in phosphorite nodule deposits on Chatham Rise, Southwest Pacific: implications for management of seabed mining. Deep Sea Res Part I Oceanogr Res Pap. 99:105–118. doi: 10.1016/j.dsr.2015.01.006
- Locarnini RA, Mishonov A V., Antonov JI, Boyer TP, Garcia HE, Baranova OK, Zweng MM, Paver CR, Reagan JR, Johnson DR, Hamilton M, Seidov D. 2013. World Ocean Atlas 2013, volume 1: temperature, NOAA Atlas NESDIS 73. In: Levitus S, Mishonov A, editor(s). Silver Spring, MD: NOAA; 1–33.
- Lu HB, Fulthorpe CS. 2004. Controls on sequence stratigraphy of a middle Miocene-Holocene current-swept, passive margin: Offshore Canterbury Basin, New Zealand. GSA Bull. 116:1345–1366. doi: 10.1130/B2525401.1
- Lu HB, Fulthorpe CS, Mann P. 2003. Three-dimensional architecture of shelf-building sediment drifts in the offshore Canterbury Basin, New Zealand. Mar Geol. 193:19–47. doi: 10.1016/S0025-3227(02)00612-6
- Maestrelli D, Iacopini D, Jihad A, Bond CE, Bonini M. 2017. Seismic and structural characterization of fluid escape pipes using 3D and partial stack seismic from the Loyal Field (Scotland, UK): a multiphase and repeated intrusive mechanism. Mar Pet Geol. 88:489–510. doi: 10.1016/j.marpetgeo.2017.08.016
- de Mahiques MM, Schattner U, Lazar M, Sumida PYG, de Souza LAP. 2017. An extensive pockmark field on the upper Atlantic margin of Southeast Brazil: spatial analysis and its relationship with salt diapirism. Heliyon. 3:1–21. doi: 10.1016/j.heliyon.2017.e00257
- Marani M, Argnani A, Roveri M, Trincardi F. 1993. Sediment drifts and erosional surfaces in the central Mediterranean: seismic evidence of bottom-current activity. Sediment Geol. 82:207–220. doi: 10.1016/0037-0738(93)90122-L
- Marsaglia KM, Browne GH, George SC, Kemp DB, Jaeger JM, Carson D, Richaud M. 2017. The transformation of sediment into rock: insights from IODP site U1352, Canterbury Basin, New Zealand. J Sediment Res. 87:272–287. doi: 10.2110/jsr.2017.15
- Masson D., Howe J., Stoker M. 2002. Bottom-current sediment waves, sediment drifts and contourites in the northern Rockall Trough. Mar Geol. 192:215–237. doi: 10.1016/S0025-3227(02)00556-X
- McCave IN, Carter L, Hall IR. 2008. Glacial-interglacial changes in water mass structure and flow in the SW Pacific Ocean. Quat Sci Rev. 27:1886–1908. doi: 10.1016/j.quascirev.2008.07.010
- McDougall JC. 1982. Bounty Sediments. New Zealand Oceanographic Institute Chart, Oceanic Series, 1:1 000 000.
- Mienert J, Andreassen K, Posewang J, Lukas D. 2000. Changes of the hydrate stability zone of the Norwegian margin from glacial to interglacial times. Gas Hydrates Challenges Futur. 912:200–210.
- Mienert J, Vanneste M, Bunz S, Andreassen K, Haflidason H, Sejrup HP. 2005. Ocean warming and gas hydrate stability on the mid-Norwegian margin at the Storegga slide. Mar Pet Geol. 22:233–244. doi: 10.1016/j.marpetgeo.2004.10.018
- Miller KG, Mountain GS, Wright JD, Browning JV. 2011. A 180-million-year record of sea level and ice volume variations from continental margin and deep-sea records. Oceanography. 24:40–53. doi: 10.5670/oceanog.2011.26
- Mitchell J, Mackay K, Neil HL, Mackay EJ, Pallentin A, Notman P. 2012. Undersea New Zealand. NIWA Chart MSN 92.
- Mitchell J, Neil HL. 2012. OS20/20 Canterbury – Great South Basin: TAN1209 Voyage Report. National Institute of Water and Atmospheric Research Ltd (NIWA).
- Mortimer N, Sutherland R, Seton M. 2017. Zealandia: Earth’s hidden continent. GSA Today. 27(3):27–35. doi: 10.1130/GSATG321A.1
- Obelcz J, Brothers DS, Chaytor JD, ten Brink US, Ross SW, Brooke S. 2014. Geomorphic characterization of four shelf-sourced submarine canyons along the U.S. Mid-Atlantic continental margin. Deep Sea Research Part II: Topical Studies in Oceanography. 104:106–119. doi: 10.1016/j.dsr2.2013.09.013
- Osterberg E. 2006. Late Quaternary (marine isotope stages 6-1) seismic sequence stratigraphic evolution of the otago continental shelf, New Zealand. Mar Geol. 229:159–178. doi: 10.1016/j.margeo.2006.03.005
- Rebesco M, Hernández-Molina FJ, Van Rooij D, Wåhlin A. 2014. Contourites and associated sediments controlled by deep-water circulation processes: state-of-the-art and future considerations. Mar Geol. 352:111–154. doi: 10.1016/j.margeo.2014.03.011
- Riboulot V, Sultan N, Imbert P, Ker S. 2016. Initiation of gas-hydrate pockmark in deep-water Nigeria: Geo-mechanical analysis and modelling. Earth Planet Sci Lett. 434:252–263. doi: 10.1016/j.epsl.2015.11.047
- Schattner U, Lazar M, Souza LAP, ten Brink U, Mahiques MM. 2016. Pockmark asymmetry and seafloor currents in the Santos Basin offshore Brazil. Geo-Marine Lett. 36:457–464. doi: 10.1007/s00367-016-0468-0
- Serra N, Ambar I, Boutov D. 2009. Surface expression of Mediterranean water dipoles and their contribution to the shelf/slope – open ocean exchange. Ocean Sci Discuss. 6:2579–2623. doi: 10.5194/osd-6-2579-2009
- Stanton BR. 1981. An oceanographic survey of the tasman front. New Zeal J Mar Freshw Res. 15:289–297. doi: 10.1080/00288330.1981.9515924
- Stewart SA. 1999. Seismic interpretation of circular geological structures. Pet Geosci. 5:273–285. doi: 10.1144/petgeo.5.3.273
- Stow DAV, Hunter S, Wilkinson D, Hernández-Molina FJ. 2008. Chapter 9: the nature of contourite deposition. Dev Sedimentol. 60:143–156. doi: 10.1016/S0070-4571(08)10009-7
- Sultan N, Marsset B, Ker S, Marsset T, Voisset M, Vernant AM, Bayon G, Cauquil E, Adamy J, Colliat JL, Drapeau D. 2010. Hydrate dissolution as a potential mechanism for pockmark formation in the Niger delta. J Geophys Res. 115:1–33. doi: 10.1029/2010JB007453
- Sumida PYG, Yoshinaga MY, Madureira LA.-P, Hovland M. 2004. Seabed pockmarks associated with deepwater corals off SE Brazilian continental slope, Santos Basin. Mar Geol. 207:159–167. doi: 10.1016/j.margeo.2004.03.006
- Sundborg A. 1956. The River Klaralven: a study of fluvial processes. Geogr Ann. 38(2):125–237.
- Sutton P. 2001. Detailed structure of the Subtropical Front over Chatham Rise, east of New Zealand. J Geophys Res. 106:31045–31056. doi: 10.1029/2000JC000562
- Sutton P. 2003. The Subtropical Front: a subantarctic current. New Zeal J Mar Freshw Res. 37:645–652. doi: 10.1080/00288330.2003.9517195
- Uddstrom MJ, Oien NA. 1999. On the use of high-resolution satellite data to describe the spatial and temporal variability of sea surface temperatures in the New Zealand region. J Geophys Res Ocean. 104:20729–20751. doi: 10.1029/1999JC900167
- Uruski CI. 2010. New Zealand’s deepwater frontier. Mar Pet Geol. 27:2005–2026. doi: 10.1016/j.marpetgeo.2010.05.010
- Waghorn KA, Pecher IA, Strachan L, Crutchley G, Bialas J, Coffin R, Davy B, Koch S, Kroeger KF, Papenberg C, Sarkar S. 2017. Paleo-Fluid expulsion influencing contouritic drift formation on the Chatham Rise, New Zealand. Basin Res. 30(1):5–19. doi: 10.1111/bre.12237
- Weaver PE, Carter L, Neil HL. 1998. Response of surface water masses and circulation to late Quaternary climate change east of New Zealand. Paleoceanography. 13:70–83. doi: 10.1029/97PA02982
- Wenau S, Spieß V, Pape T, Fekete N. 2017. Controlling mechanisms of giant deep water pockmarks in the Lower Congo Basin. Mar Pet Geol. 83:140–157. doi: 10.1016/j.marpetgeo.2017.02.030
- Wood RA, Andrews PB, Herzer RH. 1989. Cretaceous and Cenozoic geology of the Chatham Rise region, South Island, New Zealand. Lower Hutt, New Zealand: New Zealand Geological Survey.
- Zhang Y, Liu Z, Zhao Y, Wang W, Li J, Xu J. 2015. Mesoscale eddies transport deep-sea sediments. Sci Rep. 4:1–7. doi: 10.1038/srep05937