
ABSTRACT
Whole rock lithogeochemical data from the andesite rocks which host low-sulfidation epithermal gold veins in the Waihi district, New Zealand have been used to interpret hydrothermal alteration processes that variably altered the andesite rocks. The andesite host rocks are interpreted to have similar primary chemical compositions throughout the Waihi area, as reflected in similar ratios of immobile elements (eg Zr, Ti and other high field strength elements). The geochemical data reveal that elevated K/Al ratios occur in rocks proximal to low-Au–Ag deposits, reflecting adularia alteration in the host rocks associated with the upflowing hydrothermal fluids. Silicification of host rocks is achieved both by the addition of SiO2, as well as the destruction of plagioclase (reflected in the loss of CaO and Na2O). The rocks have been variably altered, with calcite and pyrite abundance reflecting the addition of carbon and sulphur. Pathfinder element (eg As, Sb) concentrations are variable across the district, with high pathfinder element concentrations interpreted to reflect proximity to hydrothermal fluid flow. Together, the results provide a district-scale overview of hydrothermal alteration at Waihi, and emphasise the utility of lithogeochemistry for classifying and quantifying hydrothermal alteration that can then be used to interpret hydrothermal processes and assist mineral exploration.
Introduction
The Hauraki Goldfield in the North Island of New Zealand () contains more than 50 low and intermediate-sulfidation epithermal veins (Christie et al. Citation2007). Epithermal veins continue to be of significant interest for mineral explorers both in New Zealand and globally. In this contribution, we review the alteration typically associated with low-sulfidation epithermal systems, and present new lithogeochemical data to interpret hydrothermal alteration which surrounds epithermal veins in the Waihi district in New Zealand. This study focusses on how geochemical data be used to interpret alteration mineralogy and identify pathfinders to gold mineralisation in an exploration context. For additional information on alteration mineralogy and paragenesis in the Waihi area, and nearby Golden Cross and Karangahake deposits, readers are referred to Mauk and Simpson (Citation2007), Simpson and Mauk (Citation2007, Citation2011), Simpson et al. (Citation2019) and Simpson and Christie (Citation2019).
Figure 1. Maps of the Hauraki goldfield showing A, the geology and fault pattern (Skinner Citation1986, Brathwaite Citation1989; Edbrooke Citation2001; Christie et al. Citation2007) and B, alteration zones and epithermal centres (veins). The inset maps indicates the location of the Hauraki goldfield and the Taupo Volcanic Zone in the North Island of New Zealand. From Simpson et al. Citation2019 (this issue).
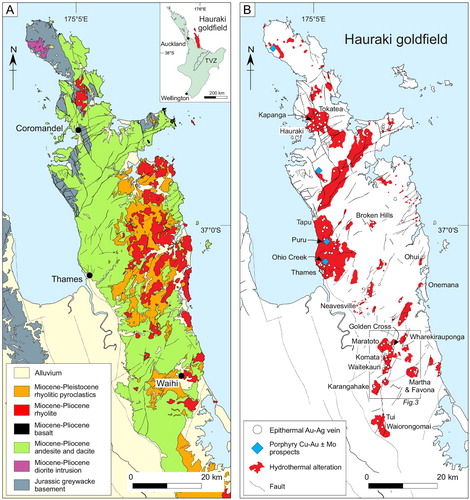
Low and intermediate-sulfidation epithermal gold deposits in New Zealand are primarily found in the Coromandel Volcanic Zone (CVZ) but are also found at Ohakuri in the Taupo Volcanic Zone. Ohakuri is a ∼100,000-year-old deposit containing more than 2 MOz of gold at an average grade of < 1 gram per ton (Grieve et al. Citation2006). Waihi hosts multiple Au–Ag epithermal deposits including the large (> 7 Moz Au) Martha deposit (Christie et al. Citation2007; ). The Waihi area is an ideal study site for assessing the mineralogical and geochemical alteration footprints of epithermal vein systems, and associated Au–Ag deposits, as the lithological host for mineralisation is an andesite that is essentially chemically homogeneous on the scale of sampling.
Low-sulfidation epithermal Au–Ag deposits are typically found in magmatic arcs undergoing extension, and are associated with near-neutral pH fluids at depth, which usually form a gangue mineral assemblage of quartz-adularia ± illite ± calcite (Simmons et al. Citation2005). Near surface, fluids cool and can evolve CO2, H2S and SO2 gases, which dissolve into water, generating acidic fluids in shallow parts of the hydrothermal systems. Gold is precipitated through predominantly boiling processes, although fluid mixing may be a cause of metal precipitation (Weisberg Citation1969). Boiling promotes the separation of H2, H2S and CO2 as gas species which lowers metal solubility, promoting the deposition of precious and base metals, and is a highly efficient process for metal precipitation. Mixing may cause changes in oxidation state and pH, as well as cooling and dilution of fluids, which can also drive metal precipitation (Simmons et al. Citation2005). Thus, targeting veins prospective for mineralisation is assisted by recognising the mineralogical and associated geochemical changes that are predicted to occur during boiling and/or mixing, and in areas of hydrothermal outflow above boiling zones.
Characterising the mineralogical changes and mineral textures associated with hydrothermal fluid flow related to epithermal gold mineralisation can be detected using a variety of approaches. These include logging of drill core for alteration features such as abundance of veins, sulphide minerals or changes in hardness (ie silicification), recognition of textures associated with boiling (such as bladed calcite or quartz), and staining for adularia (a variety of potassium feldspar which is associated with upflowing and boiling hydrothermal fluids) by cobaltinitrite. In the last ten years, high sensitivity, relatively inexpensive inductively coupled plasma-mass spectroscopy (ICP-MS) data collected from whole-rock samples using a near-total ‘4 acid’ digest (a mixture of HF, HCl, HNO3 and HClO4 acids) has become widely available, and is a powerful tool for interpreting mineralogical changes, and identifying trace concentrations of pathfinder elements, associated with mineralisation (eg Halley et al. Citation2016). In addition, recent developments in portable x-ray fluorescence (pXRF) technology mean that, with some care, accurate and precise concentration data for some elements can be collected in ‘real time’ during mineral exploration (eg Gazley et al. Citation2014).
The principal concern with using lithogeochemical data alone to assess alteration is that the chemical composition of the rock reflects the overall history of alteration that has affected the sample, including original lithological variation, pre-mineralising hydrothermal events, the ore-forming hydrothermal system, and any later overprinting events. While these influences must always be considered and lithogeochemical data interpreted with overprinting in mind, it is possible that later hydrothermal alteration could cause significant mineralogical changes without causing significant metasomatism and consequent change in chemical composition.
Review of alteration in low-sulfidation epithermal systems
The general alteration footprint of low-sulfidation epithermal quartz veins is well documented by numerous case studies, and excellent summaries are provided in Cooke and Simmons (Citation2000) and Hedenquist et al. (Citation2000). Typically, epithermal quartz veins are found within broad (regional) zones of propylytic alteration consisting of chlorite, illite, illite-smectite and calcite, which at shallow levels transitions to clay, carbonate and zeolite minerals. Proximal to the quartz veins (which are typically <20 m width, and usually a few metres wide), there are alteration zones containing quartz, adularia (which can occur both in veins and surrounding wall rocks), and pyrite (Cooke and Simmons Citation2000; Hedenquist et al. Citation2000; Simmons et al. Citation2005). Thus, there is a desire to identify and quantify distal to proximal alteration features associated with epithermal veins.
Much of our understanding of the patterns and controls on alteration in epithermal systems is based on alteration recognised within active geothermal systems which have been explored for energy production. The distribution of alteration minerals in active geothermal fields is controlled by temperature and fluid composition (see summary of Browne Citation1978). In the deepest parts of active geothermal fields accessed by geothermal wells, fluids are ∼ 300°C, generally reduced, near-neutral pH, contain ∼ 0.1 to greater than 1 wt% chloride, up to several weight percent carbon dioxide, and up to hundreds of ppm H2S. These fluids are broadly in equilibrium with a mineral assemblage represented by quartz ± albite ± adularia ± chlorite ± pyrite ± calcite ± epidote. As the fluid rises, it begins to boil, and quartz, adularia and calcite typically deposit in high permeability pathways (eg fractures and voids). In places, the neutral chloride waters can rise to the surface directly and deposit silica sinter, or may mix with surface groundwaters in an outflow zone. As the fluid boils, the dissolved gases will separate into the vapour and rise along discrete pathways. The water vapour and gases may penetrate low permeability rocks more easily than the fluid, and near surface can dissolve into cool ground waters to form either CO2-rich or acid-sulfate steam-heated waters. Carbon dioxide rich steam-heated waters contain high levels of dissolved carbon dioxide and are weakly acidic. They can cause clay-mineral dominated alteration (eg smectite, kaolinite, illite-smectite, illite), as well as form calcite and siderite (Simmons and Browne Citation2000). Acid-sulfate steam-heated waters form near surface, have lower pH (pH∼ 2), and form alteration assemblages of opal, alunite, kaolinite and pyrite (Simmons et al. Citation2005).
Geological setting
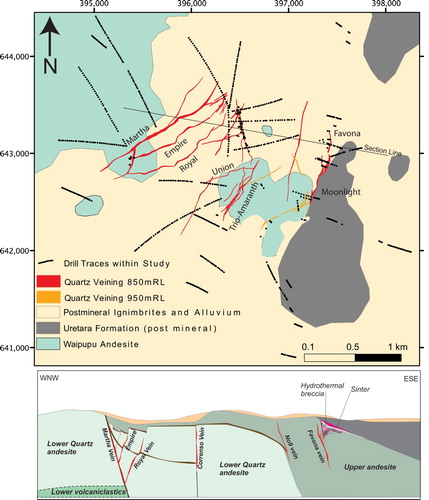
This case study focusses on alteration surrounding several Au–Ag vein deposits in the Waihi area, including the well-known Martha, Favona, and Correnso deposits (Braithwaite and Faure Citation2002; Simpson and Mauk Citation2007; Mauk et al. Citation2013). These deposits are all hosted in the Waipupu Formation, an andesite-dominant formation within the Late Miocene Waiwawa subgroup of the Coromandel Group (Brathwaite and Christie Citation1996). The andesite consists of a plagioclase-phyric two-pyroxene andesite with minor quartz phenocrysts in the lower section (Braithwaite and Faure Citation2002; Christie et al. Citation2007). Informally, within the mine, these are often referred to as the quartz andesite and feldspar andesite. Unaltered andesite contains phenocrysts of plagioclase, augite, hypersthene, minor quartz and local hornblende, with accessory magnetite, apatite and zircon. Rocks occur predominantly as flows, with tuffs and thin carbonaceous lake beds in some parts of the sequence which dip ∼40o to the east, suggesting the sequence has been tilted towards the east (Sporli and Cargill Citation2011). Thus, the western side of Waihi is inferred to expose rocks from greater paleodepths than rocks to the east. The andesites are unconformably overlain by hornblende dacite to the east (Uretara Formation), and then covered by various ignimbrites of late Pliocene to early Quaternary age (Brathwaite and Christie Citation1996). The samples analysed are mainly from the lower part of the andesite sequence ().
Figure 2. Map and cross section of the Waihi area showing the approximate position of veins at different relative levels (red and orange lines, projected to surface) and the distribution of whole rock sample points (black dots) along individual drill hole traces(projected to surface). Economically important veins are named, and referred to in the text. Note the location of drill hole UW292 (see ).
Methods
The data assessed during this study were obtained from rocks collected during a systematic lithogeochemical campaign by Waihi Gold Mine. Samples were collected over an area of ∼ 14 km2 (), with 691 samples collected from ∼1 m split core of altered host rock free from large visible veins (ie representing hydrothermally altered host rock with components of veins less than 1 cm thick; ) by Waihi Gold Mine staff. Sample locations are given on the ‘Mount Eden Old Cadastral’ (MEO) grid, which is a Waihi local grid used for exploration within 3 km of the Waihi Mine. The MEO grid is offset from New Zealand Transverse Mercator (NZTM Grid) by 5215389.166 (shift m N) and 1456198.997 (shift m E). The relative levels given in are used in the mine, and are calculated as sea level+1000 m.
Figure 3. Photographs showing examples of individual trays of drill core from which lithogeochemical data were collected, along with calculated mineral abundances for those intervals for the most abundant minerals within each sample. The red boxes show the interval from which core was split for geochemical analysis (see supplementary data table).
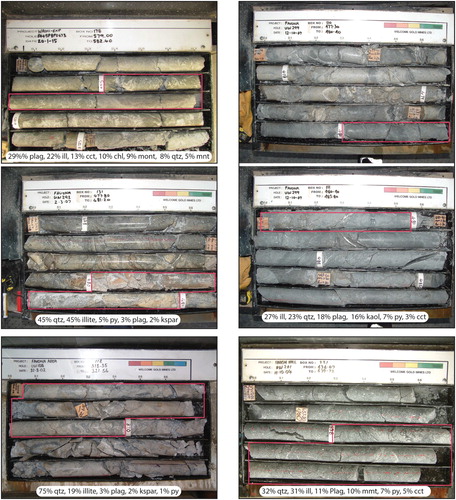
Samples were crushed and split at the SGS laboratories in Westport, New Zealand, prior to be being shipped to either the ALS Minerals laboratory in Brisbane, Australia or the Ultratrace laboratory in Perth For samples sent to ALS, samples were analysed by a combination of methods as part of the CCP-PKG03 analytical package. Major element chemistry was determined by XRF analysis of lithium borate fused beads, trace and rare earth elements were carried out by ICP-MS on lithium borate fused samples dissolved in a ‘four acid’ mixture of HF–HNO3–HCl–HClO4 acid, volatile elements were measured by aqua regia digestion on rock powders, and total carbon and sulphur were measured by infrared combustion (LECO) analysis. Data quality was assessed via analysis of several reference materials, including OREAS120, SARM-3 and SARM-45. Major element XRF results for SARM-3 and SARM-45 were within 3% (relative) of the accepted values. Trace and rare earth element values on the OREAS120 reference materials were within 10% of the accepted value for all elements, except for Sn (average reported value of 1.4 ppm, accepted value of 0.67 ppm), which is below the reported detection limit of the method (1 ppm), and Ta (reported value = 0.68 ppm, accepted value = 0.55 ppm). The samples were submitted and analysed as two separate batches to ALS. In order to check for potential systematic chemical variation between batches indicating problems with the analytical data, the two batches of ALS samples were assessed using split probability plots in IoGAS®. All elements show very similar distributions excepting Sc, which shows a significant distribution difference between the two sample batches. Therefore, Sc data were not considered further during this study. For samples sent to Ultratrace, only the major element data (measured by x-ray fluorescence on lithium borate fused samples), and total carbon and sulphur data (measured by infrared combustion) were considered in this study as the analytical differences between the methods used for trace element determinations were significantly different. The major element and total carbon and sulphur data were used only for calculated mineralogy determinations (see below), and not for any mass transfer calculations or assessment of trace element metasomatism. Assessment of split probability plots in IoGAS® for the three sample batches show very similar distributions for all major elements, carbon and sulphur. Thus the combined batches of geochemical data are considered fit for purpose for determining mineral proportions in samples.
Data were visually assessed and plotted using IoGAS® geochemical analysis software (Imdex Limited). Ratios subsequently reported in this contribution are reported as molar ratios, unless stated otherwise. Estimates of the proportion of minerals within samples were made using the weighted least squares method outlined in Berry et al. (Citation2011) and Escolme et al. (Citation2019). In brief, this approach finds a modal mineralogy that most closely matches the major element geochemical data, including C, S and H2O (estimated from the loss on ignition component not explained by total C and S). The minerals chosen were based upon the most abundant minerals present in weakly to strongly altered lithologies based upon previous studies (Simpson and Mauk Citation2007; Booden et al. Citation2012) and unpublished quantitative scanning electron microscopy data collected from Waihi by Hughes et al (in preparation). The minerals chosen were plagioclase (composition An = 93), albite, quartz, potassium feldspar (adularia), calcite, Mg-rich chlorite, illite, augite, magnetite, apatite, pyrite and montmorillonite. Using this approach, variations in the solid solution of plagioclase will be reported as mixtures of anorthite-rich plagioclase and albite. The validity of the assumed mineral assemblage can be assessed using the residuals (representing major element content which cannot be accounted for from the minerals used). Only 21 samples have residuals large enough that a mixture of minerals from the list above cannot explain the major element chemistry of the rock samples.
Mass transfer calculation methodology
Geochemical data reported as compositions are closed (Aitchison Citation1982; Citation1986). This poses a problem when looking for statistical correlation in compositional data because values are relative, rather than absolute. The log-ratio transform (Aitchison Citation1982; Citation1986; Egozcue et al. Citation2003) is a solution to the constraints of closed data. This method converts the compositional data into real-number space, allowing the application of standard statistical methods. The Centred Log-Ratio (CLR) transform was performed on a subset of elements: Ag, Al2O3, As, BaO, Bi, CaO, C, Cd, Ce, Co, Cr, Cs, Cu, Dy, Er, Eu, Fe2O3, Ga, Gd, Ge, Hf, Hg, Ho, In, K2O, La, Li, LOI, Lu, MgO, MnO, Mo, Na2O, Nb, Nd, Ni, P2O5, Pb, Pr, Rb, Re, Sb, Sc, S, Se, SiO2, Sm, Sn, Sr, Ta, Tb, Te, Th, TiO2, Tl, Tm, U, V, W, Yb, Y, Zn, and Zr.
Principal Components Analysis (PCA) is an effective way to identify groups of altered samples in ore deposits (Gazley et al. Citation2015). Benefits of PCA are that the dimensions of data are reduced, and elements that are correlated can be grouped according to membership with resulting principal components (PC). Both aspects improve clustering algorithm performance. Ten principal components were produced using CLR transformed data for cluster analysis.
Samples were clustered using k-means (Ripley Citation1996), a technique that involves partitioning n observations into k clusters such that each sample is associated to the cluster belonging to the nearest mean. The k-means algorithm was initialised with parameters set to 50 re-runs and 300 maximal iterations. The optimal number of clusters was identified using the Silhouette scoring method available in the K-Means++ algorithm provided in Biolabs Orange (Demšar et al. Citation2013), a freely available machine learning multiplatform software toolkit. The number of clusters k, to score, was set to between two and ten. This K-Means++ approach identifies an optimal number of clusters by combining metrics of cluster dispersion and distance, where the distance between clusters is maximised and the dispersion of samples associated with one cluster is minimised (Kaufman and Rousseeuw Citation2005), and results are scored using silhouette scores. The silhouette value for each point is a measure of how similar that point is to points in its own cluster, varying from −1 to +1, when compared to points in other clusters. If most points in a cluster have a high silhouette values, then the clustering solution can be considered appropriate (Kaufman and Rousseeuw Citation2005).
Mass-balance calculations have been used for decades to investigate bulk changes in geochemistry between altered and unaltered rock pairs from the same lithology (eg Grant Citation1986; MacLean and Barrett Citation1993; van Dongen et al. Citation2010; Carrasco and Girty Citation2015; Uvarova et al. Citation2017). Classical mass balance calculations rely on sample vs sample comparisons, in which two samples (one altered and the other being an unaltered equivalent) are assumed to represent entire alteration domains. Unfortunately, this approach leads to inaccurate mass change elements, as the variability of rocks in an area is not accounted for. Mass balance results in this study were calculated as per Ague and van Harden (Citation1996), as adapted by Hood et al. (Citation2019). This statistically-robust approach produces averaged estimates of mass change for entire geological domains, using samples from within the domains to produce element concentration matrices.
Quantification of mass changes of an open-system requires that one or more immobile reference species be identified (Gresens Citation1967; Pearce and Cann Citation1973; Grant Citation1986). To select which elements are immobile, we opted to use a mathematical constraint, as described by Woronow and Love (Citation1990) and Ague and van Harden (Citation1996). In this approach, elements behaving as immobile during alteration produce similar ratio values when element concentrations in representative protolith samples are divided by element concentrations in altered samples. Elements conforming to this relationship included Al2O3, Ce, Cr, Dy, Er, Eu, Ga, Gd, Hf, Ho, La, Nb, Nd, Pr, Sm, Ta, Tb, Th, TiO2, Tm, V, Y, Yb, and Zr.
Results and discussion
Evidence for chemical homogeneity of host andesites
The andesites at Waihi all have very similar rare earth element patterns. Samples show light rare earth enrichment and a flat MREE to HREE distribution (), characteristic of many andesites in the Coromandel Zone (Booden et al. Citation2012). The Ce and Eu anomalies are very similar for all samples. Ratios of Zr/Ti are similar for the andesitic rocks analysed (), varying between 0.03 and 0.05, similar to values previously reported from the Waipupu Formation of 0.02–0.035 (Booden et al. Citation2012). A graph of Zr vs Al2O3 () has a generally linear trend, with some outlying samples (<10) having either significantly elevated or significantly depleted Al2O3. Therefore, we consider that Al is also relatively immobile at Waihi for most samples (cf ). Overall, the host rocks appear to have a very similar composition for elements that would be relatively immobile during hydrothermal alteration and therefore we consider that the andesites are essentially chemically homogeneous at a scale that is fit for purpose for considering the metasomatic changes that accompanied hydrothermal alteration. As discussed below, Waipupu andesite geochemical values defined in the literature (Booden et al. Citation2012) are not identical to those for the andesite that host the Waihi epithermal veins.
Figure 4. Chondrite normalised rare earth element values for the rocks sampled in this study (normalised using values of McDonough and Sun Citation1995). Shown in black are the mean ± one sigma values, with individual samples plotted in grey. Note that almost all the samples have a very similar REE composition, with varying REE concentration a function of variable dilution/enrichment by hydrothermal processes (eg SiO2 addition).
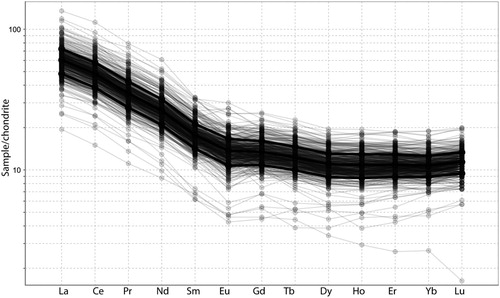
Figure 5. Scatter plots of Zr vs TiO2 and Al2O3. Note that the bulk of samples follow an approximately linear trend, consistent with relative immobility of Zr, Ti and Al during hydrothermal alteration.
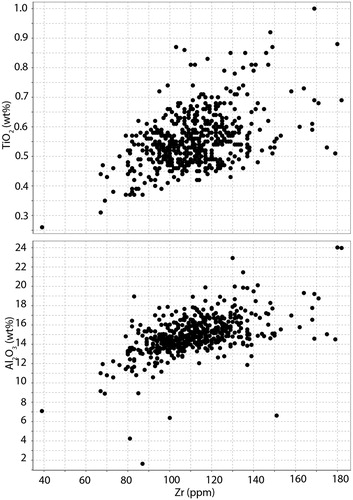
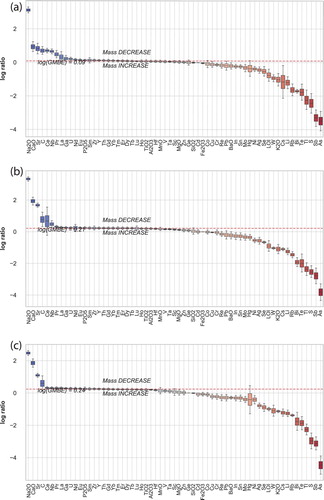
Figure 6. (a) Plots illustrating the mass transfer that has occurred for different alteration styles of (a) smectite, (b) illite and (c) adularia (see and text for alteration definitions). Twenty-four elements (Al2O3, Ce, Cr, Dy, Er, Eu, Ga, Gd, Hf, Ho, La, Nb, Nd, Pr, Sm, Ta, Tb, Th, TiO2, Tm, V, Y, Yb, and Zr) were selected to produce an immobile reference frame for mass balance calculations (GMBE). A GMBE above 1 indicates overall mass loss during alteration (cf Hood et al. Citation2019).
Alteration classification and quantification
Classifying alteration assemblages can be achieved via several mechanisms, including identifying minerals using x-ray diffraction, petrography or infrared techniques. Mineral alteration assemblages can also be inferred from whole-rock chemical data. At Waihi, as discussed above, the Waipupu andesite appears to have very consistent chemical composition. Alteration minerals most common to epithermal systems, including Waihi and the nearby Karangahake deposit, include (Mauk and Simpson Citation2007; Simpson et al. Citation2019; Hughes et al., unpublished data):
Illite: (K,H3O)(Al,Mg,Fe)2(Si,Al)4O10[(OH)2,(H2O)]
Adularia: KAlSi3O8
Kaolinite: Al2Si2O5(OH)2
Chlorite (clinochlore): (Mg,Fe)5Al(Si3Al)O10(OH)8
Montmorillonite: (0.5Ca,Na)(Al,Mg,Fe)4(Si,Al)8O20(OH)4.nH2O
Pyrite: FeS2
Calcite: CaCO3
Alunite KAl3(SO4)2(OH)6
Quartz/chalcedony/opal: SiO2
Warren et al. (Citation2007) presented a whole-rock geochemical approach to characterise epithermal mineralisation-associated alteration, using molar element ratios (MER). This approach is used to identify altered rocks containing adularia, illite, smectite, kaolinite, and calcite. Classified samples can then be understood in an alteration framework (), and alteration zones can be mapped spatially (). Use of MER alteration classification overcomes problems associated with closure, for example, the inaccurate appearance of element concentration increase or decrease, related to alteration, which is actually caused by the mobility of other elements in the system.
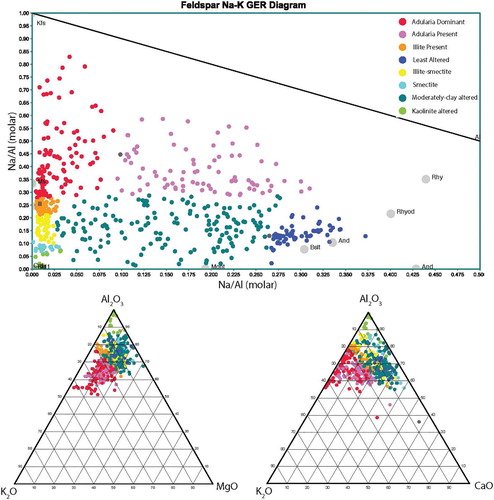
Figure 7. Na/Al (molar) vs K/Al molar element ratio scatter plot. Note that representative values for typical igneous rocks, along with the composition of key alteration minerals are plotted (Ms, muscovite; Il, illite; Mont, montmorillonite; Kfs, potassium feldspar; Kln, kaolinite). Also shown are ternary diagrams which were used to classify kaolinite alteration from smectite clays.
The transition from smectite (montmorillonite) to illite-smectite to illite (reflecting an increase in temperature) is accompanied by increase in K/Al ratio. Thus, the molar ratio of K to Al in a rock containing illite only can be no greater than 0.33; any rock at Waihi with a molar K/Al ratio greater than 0.33 must therefore contain a proportion of hydrothermal potassium feldspar (adularia), as there is no potassium feldspar in the igneous protolith. Kaolinite and smectite forming due to cation removal during acidic alteration will have low ratios of K/Al and Na/Al.
To classify alteration at Waihi, a Na/Al vs K/Al plot was used (; Madeisky and Stanley Citation1993). Waipupu Formation andesites analysed by Booden et al contain Na/Al ratios of 0.17–0.35, and K/Al ratios of 0.04–0.15. In contrast, altered andesite at Waihi shows a range in values from Na/Al = 0–0.375, with K/Al ranging from 0 to 0.825. Hughes and Barker (Citation2017) demonstrated that samples at Waihi with a K/Al molar ratio greater than 0.275 contained adularia, using a combination of portable XRF to measure K/Al ratios and x-ray diffraction to identify samples containing adularia. Rocks at Waihi that contain Na/Al values of <0.25 are interpreted to have had primary plagioclase broken down via hydrolysis (ie addition of H+) to form clay minerals and thus a loss of Na to the hydrothermal fluid. Therefore, samples with low K/Al and Na/Al ratios are interpreted to have an alteration assemblage dominated by kaolinite and/or smectite, with near complete destruction of primary plagioclase and removal of Na and K by hydrothermal fluids. Using the K/Al and Na/Al ratios, rocks at Waihi have therefore been geochemically classified into (1) adularia dominated, where Na/Al ratios are < 0.1 and K/Al ratios are greater than 0.275, (2) adularia present samples with K/Al > 0.275 and Na/Al > 0.025; illite dominated samples with Na/Al < 0.1 and K/Al between 0.225 and 0.275; illite-smectite samples with Na/Al <0.0.025 and K/Al between 0.1 and 0.225 and smectite dominated samples where Na/Al <0.0.025 and K/Al is < 0.1. Moderately clay altered samples are defined as having K/Al ratios of <0.275 and Na/Al between 0.025 and 0.25. Least altered samples have K/Al < 0.275 and Na/Al > 0.25, comparable to unaltered values for Waipupu andesite (Booden et al. Citation2012), and typical values for andesites globally (Cox et al. Citation1979; see ).
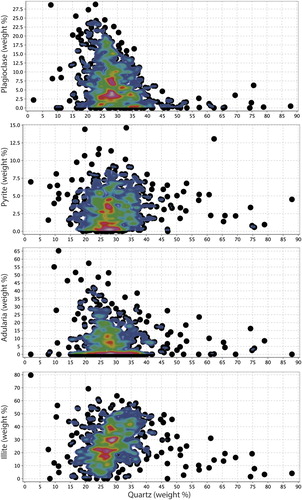
This simple classification scheme outlined above was compared to the calculated mineralogy approach. The results of the weighted least squares calculated mineralogy approach suggest that the modelled mineralogy closely matches the chemical data, with low residuals (eg left over elements that cannot fit the data), excepting 21 samples that have particularly low Na/Al ratios (see supplementary data). These samples likely contain kaolinite (in addition to or instead of smectite), which was not included in the minerals list because otherwise the list of minerals would be greater than the number of chemical components used. The calculated mineralogy approach reveals similar trends in the distribution of adularia, illite and smectite (here modelled as montmorillonite) as that evaluated from the alteration diagrams (compare and ), with the advantage that the calculated mineralogy approach allows the proportion of minerals within each sample to be estimated. For example, the calculated mineralogy results indicate that quartz abundance has a positive correlation with illite abundance, but no clear correlation with adularia or pyrite ().
Figure 8. Map showing the distribution of alteration styles at Waihi as defined on the basis of the lithogeochemical alteration classification (see ).
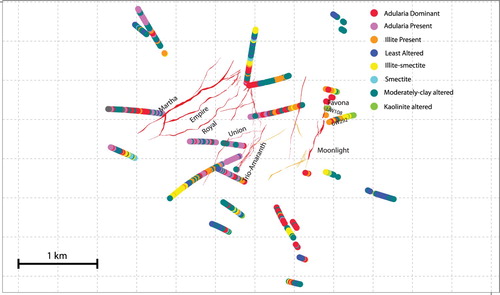
Figure 9. Ranked variable maps for Waihi produced in IoGAS showing the relative abundances of quartz, potassium feldspar (adularia), calcite, illite, montmorillonite and pyrite calculated from the geochemical data (see text for discussion). Symbols with cool colours and small sizes are least abundant, warm colours and large symbol sizes are most abundant.
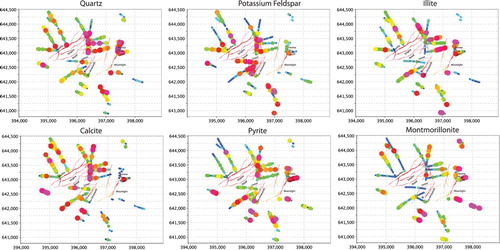
Figure 10. Abundance of quartz against plagioclase, pyrite, adularia and illite as determined from the calculated mineralogy approach produced in IoGAS. Shown on each graph is a density contour, highlighting where the bulk of the samples plot.
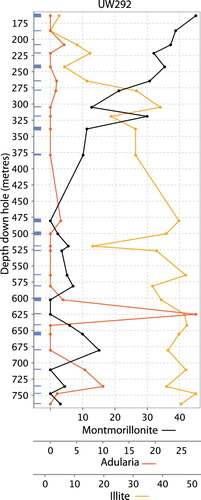
At shallow levels, illite-smectite and smectite alteration has been identified above and around the Favona vein using x-ray diffraction (XRD) techniques (Simpson and Mauk Citation2007). Alteration classification and mapping (see , and ) at Favona suggest smectite alteration at shallow levels, transitioning to illite-adularia alteration at depth (see downhole mineral abundance plot in ), consistent with the XRD-based alteration distribution at Favona described by Simpson and Mauk (Citation2007). This suggests that the alteration classification at the ∼1 m scale at Waihi determined by lithogeochemistry is valid for assessing alteration mineralogy. More broadly across the Waihi area, our study has identified adularia alteration adjacent to the northeastern end of the Martha vein system, surrounding Favona, and in several other locations ( and ). Samples with significantly adularia concentrations are most abundant around the Martha, Favona and Correnso veins deposits.
Figure 11. Downhole plot of the calculated abundance of montmorillonite (black line), illite (orange line) and adularia (red line) in drill hole UW292 adjacent to the Favona deposit.
Mass transfer calculations
The results of the mass transfer calculations are compared to elemental concentrations, and demonstrate that the amount of mass added (or removed) from the andesite is approximately linearly correlated for most elements. This indicates that the host andesite has a highly homogeneous starting chemical composition, and that the effects of closure are minimal for most element studied. However, the advantage of calculating mass transfer changes is that it allows for the quantification of dilution effects (eg the apparent decrease of element concentrations due to the addition of SiO2) or potential mass loss via destructive hydrothermal alteration. One constraint on the calculated addition and depletion values for elements relates to the selection of an immobile element reference frame, which in turn is related to the selection of representative least-altered protolith rocks in a system. Initial mass balance calculations using published andesite composition (Booden et al. Citation2012) produced spurious results. Waipupu andesite values reported in Booden et al. (Citation2012), as compared to values for the Waipupu andesite measured at Waihi in this study are not interchangeable because elements considered to be generally immobile show systematic fractionation. Therefore, to assess mass change at Waihi, we choose to define a set of least altered samples (n = 14), based on K/Al and Na/Al ratios that mostly closely resemble ratios of typical andesitic rocks and the values for the Waipupu formation defined by Booden et al. (Citation2012), and have low concentrations of elements considered as hallmarks of hydrothermal alteration. The samples chosen have K/Al ratios of 0.07–0.17, and Na/Al ratios of 0.26–0.35. These samples have As concentrations of 0.1–9.4 ppm, S between 200 and 5400 ppm, and C between 400 and 3900 ppm, indicating that they have undergone minor propylitic alteration. The samples have a SiO2 concentration range between 58 and 66 wt%, somewhat higher than the SiO2 range defined for the Waipupu formation by Booden et al. Therefore, these samples represent a least altered (not unaltered) set of samples, and the chemical changes that are then calculated are relative to that least altered reference frame. Overall, the elements most added during illite and adularia alteration determined from the mass transfer calculations include As, Sb, S, Tl, Te, Bi, Rb, Li, Cs, K2O, W, Se, Ag, Hg, Mo, Sn (see ), with varying proportions and degrees of addition depending on the style of alteration.
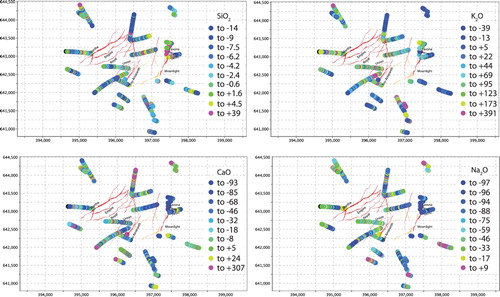
The least altered sample definition chosen includes some samples with elevated carbon (presumably contained within calcite) and higher SiO2 than typical andesite. This results in some samples having apparent carbon depletion, which given the low starting carbon for primary magmatic andesite seems unlikely. Our results and chosen approach highlights the challenge of defining least altered domains to accurately calculate mass change, and suggests that rather than focussing on the absolute values calculated, that the trends obtained (relative mass loss/gain) across a hydrothermal system are the most valuable for assessing processes that are relevant, such as silica addition associated with hydrothermal upflow zones, or potassium addition associated with adularia formation. Examples of mass change are shown in . We note that the regions with the highest SiO2 gain are associated with samples classified as being adularia dominated or adularia added (compare and ). This is consistent with the observation that the core upflow regions of geothermal and low-sulfidation epithermal systems is associated with adularia and quartz mineralisation (eg Simmons and Browne Citation2000).
Figure 12. Maps showing the calculated mass change (in %) for SiO2, K2O, CaO and Na2O across Waihi relative to the least-altered samples (see text for details).
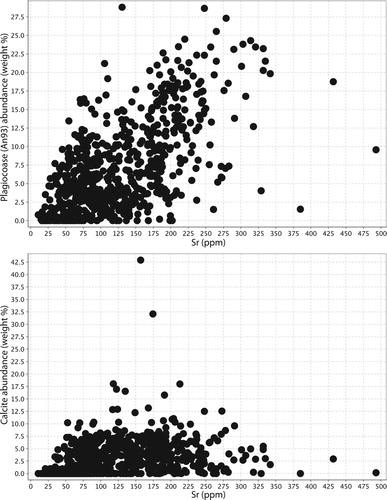
Feldspar destruction appears to be accompanied by a release of Sr, with samples that contain abundant calcite containing lower Sr concentrations than samples with abundant plagioclase (). This can also be seen when assessing Sr mass transfer, with Na mass loss associated with Sr mass loss (). Therefore, it is possible that elevated Sr (perhaps in distal carbonate minerals) could be seen in the outflow zones of the Waihi epithermal system, and may form a far-field pathfinder signature of feldspar destruction.
Figure 13. Sr concentration plotted against (a) the calculated abundance of plagioclase (An93 composition) and (b) the calculated abundance of calcite. Note the lack of correlation between calcite and Sr abundance.
Carbonate and pyrite alteration
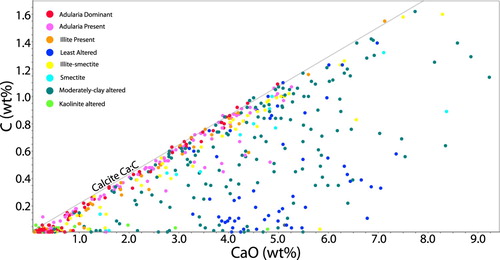
A plot of Ca against total C reveals that many of the rocks analysed are close to a molar Ca:C ratio of 1:1, indicating that most or all the calcium in the rock (originally predominantly in plagioclase) is now present as calcite, and the rocks are thus fully carbonate altered (). Generally, rocks in the western part of Waihi have more carbon added to them than rocks in the eastern part of Waihi (see calcite abundance map in ), indicating that carbonate was primarily added at deeper levels in the paleohydrothermal system. In general, the highest calcite abundances are associated with illite-smectite and moderate-clay alteration and are lowest in adularia dominated samples ( and ). This is consistent with the observation made at Broadlands-Ohaaki, that calcite is minor to absent in the main upflow zone associated with adularia development and silicification (Simmons and Browne Citation2000). An assessment of the relationship between Si and Ca mass addition or removal demonstrates that, as Si is added to the rock mass, Ca is removed. Thus, silicification (eg formation of quartz) in the rock mass is achieved partly by the dissolution of feldspar, not just by the addition of quartz ().
Figure 14. Graph of Ca (weight percent) vs C (weight percent) concentrations in rocks from Waihi. Note that a significant number of samples have very low Ca concentrations, which reflect Ca removal via feldspar destruction. Many samples sit close to a molar Ca:C ratio of 1:1, meaning that all Ca in the rock occurs as calcite. The colour codes used for alteration are the same as defined in .
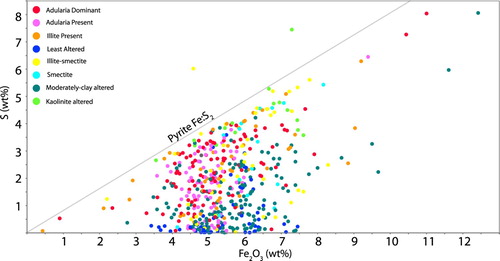
A graph of Fe vs S () demonstrates that many samples are close to or immediately below a molar Fe:S of 1:2. High carbon, low sulphur samples sit on the fringes of the system outboard from Martha, whereas samples high in sulphur relative to carbon sit towards the middle of the system and are associated with adularia dominated samples (). Generally, the highest pyrite concentrations are found around Favona, Correnso and south of the Martha vein system ().
Figure 15. Graph of Fe (weight percent) vs S (weight percent). Note that samples containing adularia typically have relatively high S contents reflecting increased abundance of pyrite, while samples classified as least altered or moderately clay altered contain relatively lower proportions of pyrite (eg further from the 1:2 molar ratio of Fe:S). The colour codes used for alteration are the same as defined in .
Pathfinder elements
Pathfinder elements are those that indicate proximity to an ore body. More broadly, we can consider pathfinder elements to be those elements which are added to rocks by hydrothermal fluids. Therefore the pathfinder element concentrations and will reflect the concentration of those elements in the fluid, and the physical and chemical structure of the hydrothermal system which control the transport and precipitation of those elements in solution. Thus, pathfinder elements may be used to make predictions about where ore may occur.
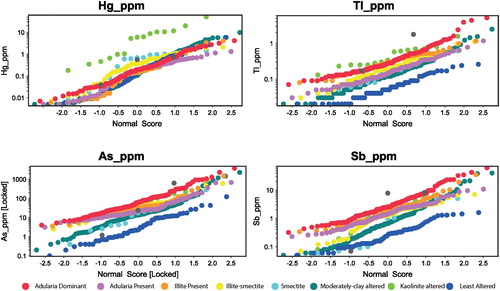
Concentrations of pathfinder elements can be controlled by the solubility of the elements in hydrothermal solutions (and processes that change solubility) as well as the growth of alteration minerals which are able to take up those elements. Arsenic, Sb and Tl are most enriched in rocks classified as adularia dominant, with smectite and illite-smectite altered rocks also having significantly elevated As (and to a lesser extent Sb; ). Mercury is most elevated in samples classified as kaolinite, smectite and moderately clay altered, reflecting the precipitation of mercury at relatively low temperatures ().
Figure 16. Split probability plots for Hg, Tl, As and Sb showing the distribution of these elements within various alteration styles (using the alteration classification shown in ).
District scale interpretation
The broad patterns evaluated in this study highlight areas of:
smectite to illite-smectite alteration with abundant pyrite;
potassic and adularia with abundant pyrite alteration in the Martha and Favona areas, as well as an area SE of the Martha-Empire-Royal veins;
carbonate alteration without smectite.
We interpret these different distributions to reflect the distribution of (1) lower temperature fluids (2) upwelling, higher temperature alkali chloride waters and (3) bicarbonate waters (cf Simmons and Browne Citation2000). It is important to note that the whole rock lithogeochemistry reflects an integrated signal of all alteration that has affected the rocks and that overprinting by carbonate alteration (eg Mauk and Simpson Citation2007) may have occurred in some areas.
The veins at Favona, Correnso and the broader Martha system are surrounded by regions of potassic alteration. Regions dominated by adularia are most proximal to Favona, Correnso, and immediately west of the Martha Pit, as well as in the southeastern area (which is not near any recognised mineralised veins). Strongly adularia altered rocks indicate more vigorous hydrothermal fluid flow and boiling, which are most likely to host gold mineralisation.
Conclusions and recommendations for explorers
The results of this study demonstrate the utility of near-total analytical digestion for inferring the alteration mineralogy of samples using whole-rock geochemistry. Analytical results from four acid dissolution can be interpreted with more confidence than those from aqua regia digest (which will not digest, or will only partially digest, many silicate minerals), and can be used to map pathfinder minerals. In addition, four-acid digestion will more completely dissolve resistate minerals that host immobile elements, which are particularly valuable for mass balance calculations. Adularia and clay minerals in particular provide well-established proxies for distance to mineralisation-related epithermal features. Exploration companies should consider routinely acquiring four-acid ICP-MS data. If this is not possible, a combination of portable x-ray fluorescence, bench top x-ray fluorescence analysers (which place samples under vacuum and can measure sodium, enabling evaluation of plagioclase destruction by measuring Na/Al ratios) and portable x-ray diffraction analysers (which can be coupled to XRF analyses to provide robust quantitative mineralogy) could be utilised on site in order to rapidly and consistently determine and quantify alteration mineralogy, without the health and safety issues associated with hydrofluoric-acid sample staining for adularia. In addition, arsenic, a useful pathfinder element, is easily measured by portable x-ray fluorescence with detection limits appropriate for mineral exploration.
S8 Assay calcmin mass transfer data
Download Comma-Separated Values File (537.2 KB)S5 Andesite-Illite 20190630-141331 ELEM MASSCHANGE
Download MS Excel (6.5 KB)S7 Andesite-Potassic adularia 0190630-151615 ELEM MASSCHANGE
Download MS Excel (6.5 KB)S6 Andesite-Potassic alteration 20190630-151900 ELEM MASSCHANGE
Download MS Excel (6.5 KB)S4 Andesite-Moderate Illite 20190630-142845 ELEM MASSCHANGE
Download MS Excel (6.5 KB)S3 Andesite-Illite-smectite 20190630-142234 ELEM MASSCHANGE
Download MS Excel (6.5 KB)S2 Andesite-Moderate clay 20190630-151243 ELEM MASSCHANGE
Download MS Excel (6.5 KB)S1 Andesite-Smectite 20190630-152140 ELEM MASSCHANGE
Download MS Excel (6.5 KB)Acknowledgements
The authors thank Tony Christie for encouraging this submission, and the staff at Waihi from Newmont and OceanaGold who supported and enabled this research, and provided the analytical data. The authors particularly thank Lorrance Torckler from OceanaGold for providing support throughout this study and permission to publish this paper and the data contained within, and Michael Belperio and Jeff Bigelow from Newmont Mining Corporation. Stuart Simmons and Scott Halley provided stimulating discussion on alteration in epithermal systems. Ron Berry is thanked for providing weighted least squares mineral abundance estimates. Bob Braithwaite and Jeff Mauk provided reviews that helped improve this manuscript. The Ministry for Business, Innovation and Employment of the New Zealand Government provided financial support through the Gold Exploration Models Programme.
Disclosure statement
No potential conflict of interest was reported by the authors.
ORCID
Shaun L.L. Barker http://orcid.org/0000-0002-4383-8861
Shawn Hood http://orcid.org/0000-0002-5680-7597
Additional information
Funding
Related Research Data
References
- Ague JJ, van Harden JLM. 1996. Assessing metasomatic mass and volume changes using the bootstrap, with application to deep crustal hydrothermal alteration of marble. Economic Geology. 91:1169–1182. doi: 10.2113/gsecongeo.91.7.1169
- Aitchison J. 1982. The statistical analysis of compositional data. Journal of the Royal Statistical Society, Series B 44:139–177.
- Aitchison J. 1986. The statistical analysis of compositional data. London, UK: Chapman & Hall Ltd. p. 416.
- Berry R, Hunt J, McKnight S. 2011. Estimating mineralogy in bulk samples: AUSIMM International Geometallurgy Conference, 1st, Brisbane, Australia, 2011, Proceedings. p. 153–156.
- Booden MA, Smith IEM, Mauk JL, Black PM. 2012. Geochemical and isotopic development of the Coromandel Volcanic Zone, northern New Zealand, since 18 Ma. Journal of Volcanology and Geothermal Research. 219-220:15–32. doi: 10.1016/j.jvolgeores.2012.01.005
- Braithwaite R, Faure K. 2002. The Waihi epithermal gold-silver-base metal sulphide-quartz vein system, New Zealand: temperature and salinity controls on electrum and sulphide deposition. Economic Geology. 97:269–290. doi: 10.2113/gsecongeo.97.2.269
- Brathwaite R. 1989. Geology and exploration of the Karangahake gold silver deposit. AUSIMM Monograph. 13:73–78.
- Brathwaite R, Christie A. 1996. Geology of the Waihi area: part sheets T13 and U13. Scale 1:50 000. Institute of Geological & Nuclear Sciences geological map 21. 64 p.
- Browne PRL. 1978. Hydrothermal alteration in active geothermal fields. Annual Review of Earth and Planetary Sciences. 6:229–248. doi: 10.1146/annurev.ea.06.050178.001305
- Carrasco T, Girty G. 2015. Identifying a reference frame for calculating mass change during weathering: A review and case study utilizing the C# program assessing element immobility and critical ratio methodology. Catena. 125:146–161. doi: 10.1016/j.catena.2014.10.009
- Christie AB, Simpson MP, Brathwaite RL, Mauk JL. 2007. Epithermal Au–Ag and related deposits of the Hauraki goldfield, Coromandel volcanic zone, New Zealand. Economic Geology. 102:785–816. doi: 10.2113/gsecongeo.102.5.785
- Cooke D, Simmons S. 2000. Characteristics and genesis of epithermal gold deposits. Economic Geology Special Publication. 13:221–244.
- Cox K, Bell J, Pankhurst R. 1979. The interpretation of igneous rocks. London: George Allen and Unwin. p. 450.
- Demšar J, Curk T, Erjavec A, Gorup C, Hocevar T, Milutinovic M, Mozina M, Toplak M, Staric A, et al. 2013. Orange: data mining toolbox in Python. Journal of Machine Learning Research. 14:2349–2353.
- Edbrooke SW (compiler). 2001. Geology of the Auckland area, Institute of Geological and Nuclear Sciences 1:250 000 geological map 3. Lower Hutt, New Zealand: Institute of Geological and Nuclear Sciences Ltd. 1 sheet + 74 p.
- Egozcue JJ, Pawlowsky-Glahn V, Mateu-Figueras G, Barcelo-Vidal C. 2003. Isometric log ratio transformations for compositional data analysis. Mathematical Geology. 35:279–300. doi: 10.1023/A:1023818214614
- Escolme A, Berry R, Hunt J, Halley S, Potma W. 2019. Predictive models of mineralogy from whole-rock assay data: case study from Productora Cu-Au-Mo deposit, Chile. Economic Geology. doi:10.5382/econgeo.2019.4650.
- Gazley MF, Collins KS, Robertson J, Hines BR, Fisher LA, McFarlane A. 2015. Application of principal component analysis and cluster analysis to mineral exploration and mine geology. AusIMM New Zealand Branch Annual Conference Proceedings. p. 131–139.
- Gazley M, Tutt C, Fisher L, Latham A, Duclaux G, Taylor M, de Beer S. 2014. Objective geological logging using portable XRF geochemical multi-element data at Plutonic gold mine, Marymia Inlier. Journal of Geochemical Exploration. 143:74–83. doi: 10.1016/j.gexplo.2014.03.019
- Grant JA. 1986. The Isocon Diagram — a simple solution to Gresens Equation for metasomatic alteration. Economic Geology. 81:1976–1982. doi: 10.2113/gsecongeo.81.8.1976
- Gresens RL. 1967. Composition-volume relationships of metasomatism. Chemical Geology. 2:47–65. doi: 10.1016/0009-2541(67)90004-6
- Grieve PL, Corbett GJ, Leach TM. 2006. Exploration at Ohakuri North epithermal Au–Ag prospect. Taupo Volcanic Zone: AusIMM Monograph. 25:197–202.
- Halley S, Wood D, Stolze A, Godfroid J, Goswell H, Jack D. 2016. Using multielement geochemistry to map multiple components of a mineral system: case study from a sediment-shoted Cu–Ni camp, NW Province. Zambia. SEG Newsletter. 104(1):15–21.
- Hedenquist JW, Ar A, Gonzalez-Urien E. 2000. Exploration for epithermal gold deposits. Society of Economic Geologists Review. 13:245–277.
- Hood S, Cracknell M, Gazley M, Reading A. 2019. Element mobility and spatial zonation associated with the Archean Hamlet orogenic Au deposit, western Australia: implications for fluid pathways in shear zones. Chemical Geology. 514:10–26. doi: 10.1016/j.chemgeo.2019.03.022
- Hughes R, Barker SLL. 2017. Using portable XRF to infer adularia halos within the Waihi Au–Ag system, New Zealand. Geochemistry: Exploration, Environment, Analysis 18:97–108.
- Kaufman L, Rousseeuw PJ. 2005. Finding groups in data: an introduction to cluster analysis. New York: Wiley.
- MacLean W, Barrett T. 1993. Lithogeochemical techniques using immobile elements. Journal of Geochemical Exploration. 48:109–133. doi: 10.1016/0375-6742(93)90002-4
- Madeisky H, Stanley C. 1993. Lithogeochemical exploration of metasomatic zones associated with Volcanic-hosted Massive sulfide deposits using Pearce element ratio analysis. International Geology Review. 35:1121–1148. doi: 10.1080/00206819309465580
- Mauk JL, Simpson MP. 2007. Geochemistry and stable isotope composition of altered rocks at the Golden cross epithermal Au–Ag deposit, New Zealand. Economic Geology. 102:841–871. doi: 10.2113/gsecongeo.102.5.841
- Mauk JL, Skinner EG, Fyfe SJ, Menzie AH, Lowers HA, Koenig AE. 2013. Ore mineralogy and textural zonation in the world-class epithermal Waihi vein system. Hauraki Goldfield. AusIMM Monograph. 31:293–301.
- McDonough W, Sun W. 1995. The composition of the earth. Chemical Geology. 120:223–253. doi: 10.1016/0009-2541(94)00140-4
- Pearce JA, Cann JR. 1973. Tectonic setting of basic volcanic rocks determined using trace element analyses. Earth and Planetary Science Letters. 19:290–300. doi: 10.1016/0012-821X(73)90129-5
- Ripley BD. 1996. Pattern recognition and neural networks. Cambridge: Cambridge University Press.
- Simmons SF, Browne PRL. 2000. Hydrothermal minerals and precious metals in the Broadlands-Ohaaki geothermal system: implications for understanding low-sulfidation epithermal environments. Economic Geology. 95:971–999. doi: 10.2113/gsecongeo.95.5.971
- Simmons SF, White NC, John DA. 2005. Geological characteristics of epithermal precious and base metal deposits. Economic Geology 100th Anniversary Volume, p. 495–522.
- Simpson MP, Christie AB. 2019. Hydrothermal alteration mineralogical footprints for New Zealand epithermal Au–Ag deposits. New Zealand Journal of Geology and Geophysics. doi:10.1080/00288306.2019.1577278.
- Simpson MP, Gazley MF, Stuart AGJ, Pearce MA, Birchall R, Chappell D, Christie AB, Stevens MR. 2019. Hydrothermal alteration at the Karangahake epithermal Au–Ag deposit, Hauraki goldfield, New Zealand. Economic Geology. 114:243–273. doi: 10.5382/econgeo.2019.4630
- Simpson MP, Mauk JL. 2007. The Favona epithermal gold-silver deposit, Waihi, New Zealand. Economic Geology. 102:817–839. doi: 10.2113/gsecongeo.102.5.817
- Simpson MP, Mauk JL. 2011. Hydrothermal alteration and veins at the epithermal Au–Ag deposits and Prospects of the Waitekauri area, Hauraki goldfield, New Zealand. Economic Geology. 106:945–973. doi: 10.2113/econgeo.106.6.945
- Skinner D. 1986. Neogene volcanism of the Hauraki volcanic region. Royal Society of New Zealand Bulletin. 23:20–47.
- Sporli K, Cargill H. 2011. Structural Evolution of a world-class epithermal orebody: The Martha Hill deposit, Waihi, New Zealand. Economic Geology. 106:975–998. doi: 10.2113/econgeo.106.6.975
- Uvarova YA, Pearce MA, Liu W, Cleverley JS, Hough RM. 2017. Geochemical signatures of copper redistribution in IOCG-type mineralisation, Gawler Craton, south Australia. Mineralium Deposita. 53:477–492. doi: 10.1007/s00126-017-0749-1
- van Dongen M, Weinberg RF, Tomkins AG. 2010. REE-Y, Ti, and P remobilization in magmatic rocks by hydrothermal alteration during Cu–Au deposit formation. Economic Geology. 105:763–776. doi: 10.2113/gsecongeo.105.4.763
- Warren I, Simmons SF, Mauk JL. 2007. Whole-rock geochemical techniques for evaluating hydrothermal alteration, mass changes, and compositional gradients associated with epithermal Au–Ag mineralization. Economic Geology. 102:923–948. doi: 10.2113/gsecongeo.102.5.923
- Weisberg B. 1969. Gold-silver ore grade precipitates from New Zealand geothermal waters. Economic Geology. 64:95–108. doi: 10.2113/gsecongeo.64.1.95
- Woronow A, Love KM. 1990. Quantifying and testing differences among means of compositional data suites. Mathematical Geology. 22:837–852. doi: 10.1007/BF00890666