Article title: Cretaceous tectonostratigraphy of ‘the Great Coverham section’ and adjacent areas, northeastern Waiau Toa/Clarence valley, New Zealand
Authors: James S. Crampton
Journal: New Zealand Journal of Geology and Geophysics
Bibliometrics: Volume 66, Number 3, pages 495–527
DOI: http://doi.org/10.1080/00288306.2023.2193415
In the printed and online version of this article, measured dip directions on faults were shown incorrectly in the geological maps in figures 3 (Part 1), 4 and 5 (Part 1). These dip directions are shown correctly here.
Figure 3. Geological map and cross-sections of the Coverham area (polygon ‘A’ on Figure 1). Also shown are paleocurrent and paleoslope plots for Champagne Formation and Wharf Sandstone Member (Split Rock Formation). The locations of all geological observations and fossil records are shown in Figure S1, and the locations of measured sections are shown in Figure S2 (figures with prefix ‘S’ refer to Supplementary Material). On the cross-sections, form-lines are arbitrary and serve only to illustrate intraformational structures.
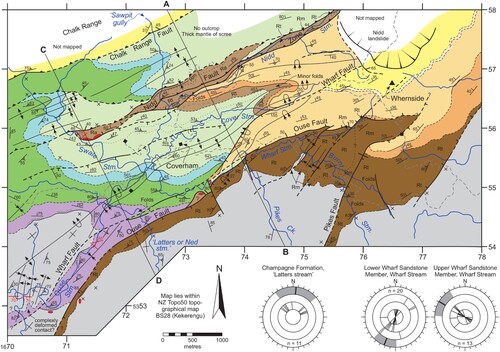
Figure 4. Geological map of the Kekerengu area (polygon ‘B’ on Figure 1). Geological symbols are explained in Figure 3. The locations of measured sections are shown in Figure S2.
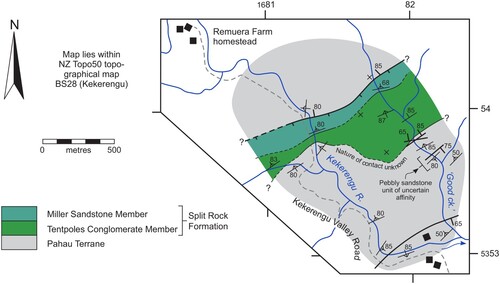
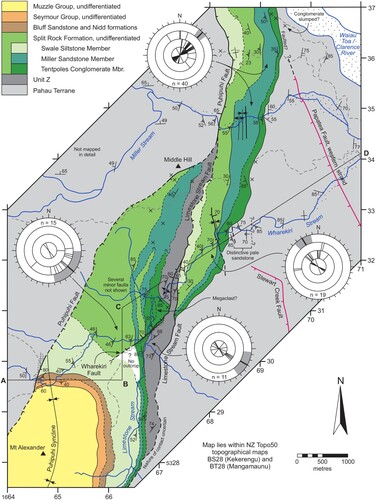
Figure 5. Geological map and cross-section of the Wharekiri area (polygon ‘C’ on Figure 1). Also shown are paleocurrent and paleoslope plots for Split Rock Formation in different sections and the informal ‘Unit Z’. Geological symbols are explained in Figure 3. The locations of measured sections are shown in Figure S2. The line of the cross-section is constrained, in part, by availability of useful outcrop control. On the cross-section, form-lines are arbitrary and serve only to illustrate intraformational structures. Affinities of strata mapped as Unit Z are unclear (see text).