
ABSTRACT
Using data collected from 4329 students in the 2015 iteration of the Trends in Mathematics and Science Study (TIMSS), we explore two mediators for the relationship between socioeconomic status (SES) and TIMSS-results in mathematics among Norwegian fifth graders. First, we explore how the students’ motivation and self-concept mediate the relationship between SES and test results. Second, by using parent reported SES resources and the parents’ attitudes to school and the tested subjects, we examine how these may constitute a path through which their children’s motivation and family SES are related to mathematics achievement. We found that students’ self-concept accounted for a small but statistically significant portion of SES effects on achievement. Intrinsic motivation did not mediate any of the SES effects on achievement, nor did parental attitudes account for any of the association between SES and motivation or achievement.
1. Introduction
Equity in education – that regardless of social background, students should have a fair chance to achieve their individual academic potential – is an explicit goal for education policies, both internationally (e.g., OECD, Citation2018), and in the Nordic countries, like Norway (e.g., Ministry of Education, Citation2007). However admirable that goal is, the reality of the territory does not match the ideals of the map. Decades of research have confirmed a robust association between socioeconomic status (SES) and academic achievement (White, Citation1982; Sirin, Citation2005; Chmielewski, Citation2019). Socioeconomic background is substantially associated with lower school achievement across all rich countries (Chmielewski & Reardon, Citation2016), and achievement is predictive of outcomes such as future income (Watts, Citation2020), future education attainment (Watkins & Howard, Citation2015) and adult socioeconomic status (Braun & Stuhler, Citation2018; Vosters & Nybom, Citation2017).
In Norway, inequalities persist to the extent that a social gradient is observed in school achievement, with parental tertiary education predicting skills in reading, mathematics and English on nationwide standardized tests (Salvanes, Citation2017; Statistics Norway, Citation2020). Among Norwegian students, Chmielewski and Reardon (2016) found those in the highest income decile to score .70 [.51-.76] standard deviations above those in the lowest decile in the 2001 PIRLS study. Since the 2001 PIRLS data were collected, inequalities in Norway have increased; in 2018, 11.3% of Norwegian children lived in low-income households, an increase from about 4% in 2000 (Epland & Normann, Citation2020).
While achievement across subjects tend to be correlated, the average effect size for the SES gap is larger in analysis of mathematics (.35) achievement outcomes than in science (.27) or verbal ability (.32) (Sirin, 2005). Socioeconomic gaps in mathematics achievement may be particularly important for children’s life chances in a world where such skills are becoming increasingly consequential (Jang, Citation2016). Math skills acquired during childhood are building blocks upon which future skills rest, and lagging behind during the earliest school years will have consequences for future skill development (Ginsburg et al., Citation2008). Moreover, early math skills, prior to school entry, has been found to be predictive of later achievement across academic domains (Duncan et al., Citation2007). For example, across five large datasets, these authors found early math skills to be more predictive of later reading skills, than early reading skills themselves. Knowing the importance of early mathematics skills and those skills’ association with socioeconomic background, we aim to identify possible pathways through which the effects of SES travel.
1.1. Pathways of Family Effects
Despite robust evidence for associations, mechanisms through which effects are transmitted are not entirely clear, neither when family socioeconomic pathways exacerbate difficulties nor when they amplify advantages. One theoretical approach to such pathways is described in terms of stress and investment, with the family stress model suggesting that economic distress negatively impacts family well-being, which in turn explain developmental lag in children (Duncan et al., Citation2015). The family investment model proposes that there are less available resources (books, computers) and/or that less time is invested in children’s learning and school success among economically disadvantaged families (Duncan et al., Citation2015). Investment and spending of both resources and time may be partly captured through parental involvement, functioning as a pathway from parental SES to school achievement (White, Citation1982; Lerner & Grolnick, Citation2020). Autonomy, as in the opportunity to discuss and participate in decision-making at home, is associated with heightened academic motivation (Schunk et al., Citation2008; Rowell & Hong, Citation2013; Lerner & Grolnick, Citation2020). This type of autonomy is associated with authoritative parenting styles, where boundaries are clearly communicated but children’s voices are heard and encouraged.
Another theory is that low family SES is associated with low motivation through the factors that “frequently accompany low SES” (Schunk et al., Citation2008). These include lack of resources and investment priorities within families, but also how socialization in lower-SES homes sometimes can be mismatched to the cultural expectations of middle-class oriented schools and classrooms. At preschool and early elementary age, despite achievement scores being lower among low-SES children, motivation at this early time is nearly equal among different SES-groups (Stipek & Ryan, Citation1997). This could suggest that differences in motivation may partly arise through alignment of home- and school experiences through the school years. For example, Evans et al. (Citation2010) demonstrate strong effects of the amounts of books at home, independent of parental education. The authors attribute this to a scholarly culture in the families, which can exist independent of parental education. In a distinctly sociological point of view, Evans et al consider books a form of cultural marker, a distinctive form of social capital – as well as cultural toolkit that support cognitive skill building, and argue that this has a major causal effect on children’s educational attainment. The difference between a large home library and no books at home is, according to Evans et al, “as great as the difference between having parents who are barely literate (…) and having university educated parents” (Citation2010, p. 179).
1.2. Motivation and Mathematics Achievement
1.2.1. Motivation Typologies
Educational motivation has been conceptualized as two separate psychological drives: an intrinsic drive to pursue topics of interest, and as an extrinsic drive to achieve positive reactions from the social environment (Diseth, 2019; Ryan & Deci, Citation2000). Within the Eccles and Wigfield model of expectancy-value, the social world precedes cognitive processes and individual motivational beliefs in the process toward achievement behavior (Eccles & Wigfield, Citation2002; Schunk et al., Citation2008). The cognitive processes may also revolve around perceptions of the social environment as well as a self-concept of one’s own abilities. In this way, when motivational beliefs are formed and in turn shape goals and expectancies, social experiences of task value and task difficulty are part of the process. Whether formed at home or at school, these motivational beliefs influence the educational behaviors that lead to differing levels of achievement. We utilize the typology of intrinsic and extrinsic motivation in the present study based on available data: intrinsic motivation, and self-concept as an alternative drive to extrinsic motivation (Eccles, Citation1993). While the children in our subset of the data (Norwegian fifth graders) are young, which makes data collection on subjective experiences challenging, stable and reliable measurements of motivation levels have been recorded in TIMSS since 2003 (Kaarstein, Radišić & Nilsen, Citation2018; Mullis, Martin and Hooper, Citation2017).
1.2.2. Academic Acheivement
Mega, Ronconi and De Beni propose a theory that links emotion and motivation to academic achievement, in which “positive emotional experiences play an important role in academic achievement” (Citation2014, p. 121). Yet, students experience the same type of situations very differently – some react to challenges with a mixture of positive and negative emotion, while others experience only negative emotions. In understanding this discrepancy in emotional reaction to challenges, possible mediators include cognitive resources, self-regulation, mental strategies and motivation. For motivation to increase performance or achievement, students must believe that intelligence can be increased and skills acquired (Mega et al., Citation2014). In other words, they inherently believe that investing time and effort into a task will yield positive results.
1.2.3. Mathematics Motivation
TIMSS data from the 2007 iteration show that Norwegian students report low levels of motivation for mathematics overall (Eklöf et al., Citation2014). Yet, despite a baseline of low motivation, studies of trends over time paint a more optimistic picture. While Norwegian fifth graders’ intrinsic motivation for mathematics decreased between 1995 and 2007, it increased from 2007 to 2015 (Kaarstein et al., Citation2018). The same study found that students’ self-concept in mathematics steadily increased in the years from 2003 to 2011. Among these fifth-grade Norwegian students, results show that boys are more individually interested, while girls invest more effort in learning mathematics (Høgheim & Reber, Citation2019). The question remains what the possible drivers are for increasing student motivation and self-concept. Findings from a sample of students from lower-SES families in Malaysia showed teacher’s affective support to be more predictive than perceived the parental influence, but the parental influence remained a significant predictor of the students’ attitude toward mathematics, as was their attitude a significant predictor of achievement (Davadas & Lay, Citation2018). Another study found mathematics homework motivation to be associated with parental involvement, which may support both the Davadas and Lay claim of parental influence as well as our hypothesis of parental attitudes as a mediator for previously established SES effects on child performance (Silinskas & Kikas, Citation2019). Similarly, Herges et al. (Citation2017) found positive correlations between internal motivation and grades; confidence and grades; and parental involvement and grades. While there is a synergy effect to internal motivation, confidence and parental involvement, where all three mechanisms that may boost the effect of each other, efforts to tease out separate effects are crucial.
1.2.4. Parental Attitudes
An extensive meta-analysis found parental attitudes and involvement, widely defined, to be consistently associated with children’s academic achievement (Porumbu & Necşoi, Citation2013). The authors found that their results varied somewhat across cultures. Drawing on Eccles’ expectancy-value theory, Hascoët et al. (Citation2021) examined the effects of parents’ expectations and found attitudes as an expression of expectations, mediating the effects that underlying expectations have on parenting and, in turn, on outcomes. They also established a link between parental attitudes and children’s positive self-concept. Yet, a cross-cultural comparison of parental attitudes was inconclusive with regard to whether the strength of this pathway, from attitudes via self-concept to achievement, is strongest for mathematics- or language achievement (Neuenschwander et al., Citation2007). As such, examining the attitudes of parents in a limited cultural context may yield more conclusive results, but less generalizability. One example is a longitudinal investigation on K-8 students in the United States, concluding that there is a connection between the attitudes of parents and their children toward mathematics (Mohr-Schroeder et al., Citation2017).
1.2.5. Present Study
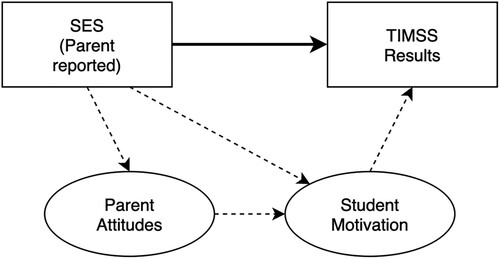
In the present study, we use the TIMSS 2015 data for Norway to examine the extent to which intrinsic motivation and self-concept can explain some of the SES differences in test results, as well as whether parental attitudes can explain some of the proposed association between SES and intrinsic motivation and self-concept. Specifically, our first research question explores whether motivation and self-concept mediate the relationship between family SES and achievement. The hypothesized relationship is illustrated in . Secondly, we explore whether parental attitudes and motivation mediate the relationship between family SES and achievement. The hypothesized relationship is illustrated in .
Figure 1. Model of the hypothesized relationship tested in the first research question.
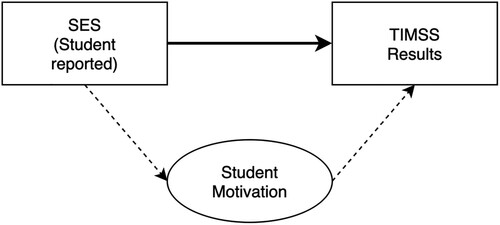
Figure 2. Model of the hypothesized relationship tested in the second research question.
Drawing on previous research, we analyze motivation items in two distinct forms: intrinsic motivation and self-concept. This repurposing of the student context questionnaire items diverges from the TIMSS trend analysis standard of conceptualizing “confidence in” and “liking” of subjects (Mullis & Martin, Citation2013) and from other research where only confidence and intrinsic motivation has been analyzed at the elementary school level (Kaarstein & Nilsen, Citation2016; Citation2018). The TIMSS 2015 home questionnaire includes eight items for measuring parental attitudes. The attitude items included in TIMSS 2015 were developed based on the 2011 items (Mullis et al., Citation2011), which place the importance of parental attitudes on how they in turn influence student attitudes.
2. Materials and Methods
2.1. The Timss 2015 Data
In this study, we make use of the 2015 iteration of mathematics and science assessment data published by the TIMSS & PIRLS International Study Center at Boston College. The data was collected in 2015 through the administration of mathematics and science exercises (hereby referred to as achievement items); a context questionnaire for the student (background items); and, for the younger participants, a home background questionnaire (parent responses to socioeconomic and attitude items). The test was administered to students in grade four and eight in 60 countries. In the Norwegian subset, grade five students were tested because many Norwegian students enter grade one at age five and so age-wise these are most comparable students to the typical OECD grade four. The present study includes all Norwegian grade five respondents (n = 4329) who participated in TIMSS 2015. As will be discussed, only about 40% of the parents respond (n varies between 1789 and 1823 in analyzed items), while the student response rate is close to complete. The student sample was drawn from the Norwegian fifth grade student population using a stratified two-stage cluster sampling design (LaRoche et al., Citation2016). The two-stage clustered sampling means schools were first sampled based on municipality characteristics, and from each school, whole classes were sampled. The total sample includes 222 classes across 140 schools. As such, the data are sampled in two stages where all individual results in the second sample stage (classes) are nested within the first sample stage (schools). More information on how we mitigate the challenges of working with nested data and our reasoning behind only analyzing the individual-level data versus class- or school level can be found in the appendix. Descriptive statistics of the analyzed variables are also presented in the appendix (Table A.1).
2.2. Outcome Variable: Achievement Items
The dependent variable in all analyses is an estimated achievement score in mathematics. Frameworks for the TIMSS achievement items are updated for each cycle and administered as a full-scale field test prior to translation (Mullis et al., Citation2016). The framework is designed to assess students across two dimensions: content and cognitive (Mullis et al., Citation2016). Fourth grade (Norwegian fifth grade) content domains were numbers, geometric shapes and measures, and data display. Cognitive domains were defined as knowing, applying and reasoning and were assessed in both subjects. One hundred and fourteen representatives from 45 participating countries took part in developing the test items. When results of main analyses are presented below, including standard errors, it will be as an average over five separate calculations using each of the plausible values, as recommended in what von Davier et al call “PV-R,” the PV-right method (Citation2009). Further information on the plausible values treatment in the current analyses are provided in appendix 3.
2.3. Independent and Mediating Variables: Background Items
Independent and mediating variables in the analyses are all derived from the context questionnaires – reported in turn by students and (some of) their parents. Motivation and number of books at home are reported by students, while a scaled SES resource proxy and parental attitudes to subjects are reported by parents.
2.3.1. Student Motivation
Mathematics motivation in TIMSS proper is measured based on responses to 18 questions in the context questionnaire. Examples range from “I learn interesting things in mathematics” to “Mathematics make me nervous” and are all answered on a four-point likert scale. As of the 2015 cycle, TIMSS include items meant to capture both extrinsic and intrinsic motivation in the fourth-grade questionnaire. In their study of 20 years of TIMSS data on mathematics motivation, Kaarstein et al. (Citation2018) account for the concepts the questionnaire meant to measure, aligning with Ryan and Deci’s concept of intrinsic motivation (Citation2000), and Eccles and Wigfield’s self-concept construct (Wigfield & Eccles, Citation2000). Items were chosen for both motivation measurement models dependent on their relative fit to the factor found through modification indices.
2.3.2. Socioeconomic Status in Student Data
In the context questionnaire administered with the achievement items, students are asked to report the number of books in their home. The options are presented together with illustrations of books and bookshelves to visualize how a certain number of books may look at home. The student response rate on this question is close to complete and the responses approximate a normal distribution across the sample, as shown in .
Table 1. Student reported number of books in the home.
The number of books at home is commonly included in a scale of home resources, as it is in the TIMSS parent data, combined with other measures of possessions and often with parental education or occupation (Amato et al., Citation2015). But even as a standalone proxy, the number of books at home has been proven repeatedly to be a stable and consistent measure of “objectified cultural capital” (Sieben & Lechner, Citation2019). In an analysis of socioeconomic indicators in earlier TIMSS data, Yang found that the number of books at home was highly related to cultural capital across most of the TIMSS sample (Citation2003). The number of books has also been related to an investment perspective on parents’ socialization of their children into an SES bracket (National Academies of Sciences, Engineering and Medicine, Citation2019). In order to retain as much data as possible from the sample, we use this variable alone as an SES proxy in student data analyses, as it is reported by 4230 students as opposed to the 1813 students for whom a home resources scale is compiled.
2.3.3. Home Resources for Learning Scale
In the analyses of parent data, a combination of student and parent data are used to define the SES background variable in the structural models. These are comprised in the item response theory-based scale called “home resources for learning,” which includes number of books in the home, number of children’s books in the home, highest level of education of either parent, number of home study supports and the highest level of occupation of either parent (Martin, Mullis, Hooper, Yin, et al., Citation2016, exhibit 4.1; Mullis et al., Citation2017). The scale proved to be a significant predictor in all participating countries in 2011 and has since been retained in subsequent TIMSS cycles (Mullis & Martin, Citation2013). It is particularly the combining measure of parental occupational status and education level that makes the home resources for learning scale an interesting proxy for SES.
2.3.4. Parent’s Attitude to Subjects
Parent’s attitude to subject is measured based on eight statements in the home questionnaire which parents are asked to rate on a four-point likert scale of agreement. The eight statements cover a combination of science and mathematics, so in our analyses, attitude items are combined to capture the parent’s attitude to these subjects as one. One out of the eight items, item 16H, was excluded during the confirmatory factor analysis of the attitude measurement model due to poor fit.
2.3.5. Non-response and Missing Values
The home questionnaire is severely compromised by the amount of non-response. As we do not know the characteristics of those parents who do not respond, we cannot infer the reasons for not responding. One context item is comparable between students and their parents, asking respondents to report the number of books at home. Compared to above, describing the distribution of the student sample across the number of books at home variable, shows a severely skewed response from the parents when asked the same question.
Table 2. Parent reported number of books in the home.
The distribution of responses shows that the parents who do fill out the home questionnaire (or at least the question about number of books at home) has a right-skewed distribution on this item compared to their children. Out of the 4329 students, the 1819 whose parents answered this question are not random; the parents who respond are those who report a relatively larger volume of books at home. The 2510 students whose parents did not respond are therefore missing not at random (Kline, Citation2016). This is integral to the understanding and interpretation of other missing information on the parental level, knowing that our parent sample is skewed toward the higher end of the SES spectrum.
2.3.6. Control Variables
We include two control variables in the structural models to account for possible effects not included in our research questions. One is gender, which we coded to a binary 0-1. The second covariate controlled is age, to account for whether students were born early or late in the year. The students’ ages range from 10 years and 62 days to 12 years and 29 days. We centered the age variable on 0.
2.4. Statistical Analyses
All analysis in this paper was conducted in RStudio version 1.2.5033 (“Orange Blossom”, 2019-12-03) with R version 3.6.2 (“Dark and Stormy Night”, 2019-12-12), on macOS Catalina 10.15.1 (R Studio Inc, 2019; The R Foundation for Statistical Computing, 2019). All models were estimated using maximum-likelihood estimation in the R package lavaan version 0-65, written for latent variable analysis (Rosseel, Citation2012, Citation2019). The total number of items analyzed are I = 32 with 5 being outcome items (plausible values), 2 socioeconomic items (one of which is a TIMSS-constructed scale) and 25 plausible mediator items. Direct and indirect effects were estimated in lavaan by fitting a path analysis model within the regressions.
In addition to the model test statistic (chi-square with degrees of freedom and p-value), we use three fit measures to evaluate the models; Comparative Fit Index (CFI), Root Mean Square Error of Approximation (RMSEA) and Standardized Root Mean Square Residual (SRMR). According to Hu and Bentler (Citation1999), a CFI value above.95 and a RMSEA value below .06 is sufficient to consider the model well fitted. The “combination rule” states an acceptable fit to have a CFI value equal to or above .95 and an SRMR value equal to or below .08 (Hu & Bentler, Citation1999; Kline, Citation2016). Some of the confirmatory factor models, used to evaluate the measurement of latent variables, have CFI and SRMR values indicating good or acceptable fit but RMSEA values that indicate poor fit or have non-significant RMSEA estimation. This could be caused by the low degrees of freedom in these measurement models as they are comprised of relatively few variables. Kline (Citation2016) explains the penalty that RMSEA imposes on models with few variables. We therefore retain the CFAs, if they are otherwise of seemingly good fit.
We estimate the standard errors in all models by the bootstrap method with 1000 iterations. As a robustness check, we also estimated the models with robust standard errors clustered at the school level. This led to a slight decrease in t-value for most standardized estimates but always remained within the confidence interval of estimates with bootstrapped standard errors. Due to minimal difference, we do not report the clustered standard errors.
3. Results
3.1. Measurement Models for Motivation and Attitudes
As a first stage, we fitted confirmatory factor models for our latent variables prior to including them as independent variables in the structural models. For self-concept and intrinsic motivation, we fitted two separate one-factor models. As detailed in appendix 4, these models fit the data well.
3.2. Structural Models in Student Data
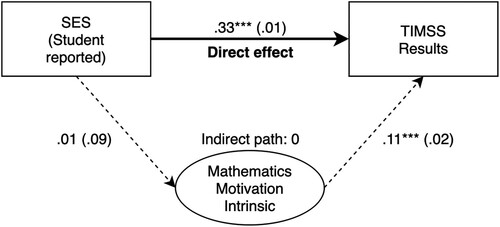
Our first research question was whether student motivation and self-concept mediate the association between SES and achievement and if so, to what extent. The hypothesis associated with this research question is that the relationship between SES and achievement is partially but significantly explained by motivation and self-concept. We tested this hypothesis in student data (n = 4329). In a structural equation model (SEM), we regressed intrinsic motivation and self-concept (separately) on the SES proxy and regressed the achievement score on both forms of motivation as well as SES to capture both indirect and direct effects in . Fit indices for the first combined model indicate good fit (χ2 = 622*** (DF = 79), CFI = .98, SRMR = .02, RMSEA 90% CI = [.04 – .05]). The direct effect, meaning the effects of SES on achievement not explained by motivation pathways, was .25*** (.02), visualized in . The total effect, adding up the direct effect and the indirect effects estimated through motivation mediators, was .33*** (.02). The path from SES, through self-concept, to achievement, was estimated to .08*** (.01). No such significant path was found from SES through intrinsic motivation to achievement.
Figure 3. Path Analysis Structural Equation Model with Two Motivation Constructs Using Student Data. Note: Total effect of SES on results including all mediating paths: .33*** (.02). Residual correlation between self-concept and intrinsic motivation was .68*** (.02). Standard errors are estimated with 1000 bootstrap iterations. Controlled for age and gender. *p < .05 **p < .01 ***p < .001.
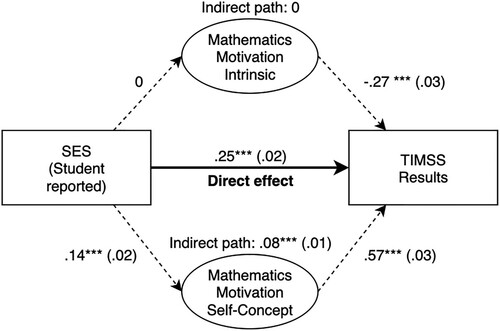
However, as can be noted from , there was a significant negative path of intrinsic motivation on mathematics results, while the path from self-concept was positive and strong. This may indicate a suppressor effect in the model including two measures of motivation, given that the latent variables were strongly correlated. While the two motivation factors often appear together – meaning students who are intrinsically motivated often have a positive self-concept – the constructs have very different properties (Watson et al., Citation2013). In the model where both intrinsic motivation and self-concept is included, their shared variance is parceled out of the model (as the two factors are controlling for one another). This creates the potentially artificial appearance that intrinsic motivation is negatively correlated with results, but this only appears because the model excludes the shared variance with self-concept, properties of intrinsic construct that on their own are very much associated with results. To alleviate the way the two factors influence each other in the combined model, we fitted separate SEMs for each motivation factor, visualized in and .
Figure 4. Path Analysis of Student Data with an Self-Concept Motivation Factor. Note: Total association between SES and results, all direct and indirect paths 4: .32*** (.02). Controlled for age and gender. * p < .05 ** p < .01 ***p < .001.
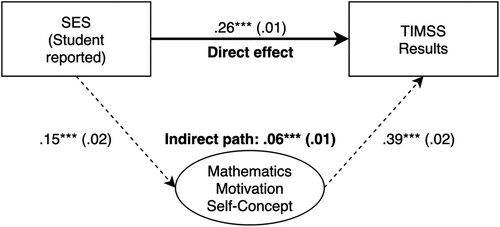
Figure 5. Path Analysis of Student Data with an Intrinsics Motivation Factor. Note: Total association between SES and results, all direct and indirect paths 5: .33*** (.02). Controlled for age and gender. * p < .05 ** p < .01 ***p < .001.
Accounting only for self-concept, model fit indices indicate a stable, well-fitted model (χ2 = 151*** (DF = 16) CFI = .97, SRMR = .03, RMSEA 90% CI = [.04 – .05]). The regressions are estimated while controlling for gender and age with 1000 bootstrap iterations. The same model accounting only for intrinsic forms of motivation factor also fit the data well (χ2 = 386*** (DF = 40), CFI = .99, SRMR = .02, RMSEA 90% CI = [.04 – .05]), but revealed zero explanatory power through intrinsic motivation. Total effects of SES on mathematics achievement remain stable across the combined and restricted models. Many of the regression estimates in the restricted model are thus similar to what they were in the full model but the exclusion of intrinsic motivation lowers the relative association between self-concept and the mathematics score and eases the interpretation of self-concept effects. Based on this post-hoc analysis, we therefore conclude that self-concept, but not intrinsic motivation, mediates the association between SES and TIMSS results, leading to partial support for our hypothesis.
3.3. Structural Models Including Parent Data
For evaluating the second research question – how parental attitudes mediate the relationship between SES, motivation and achievement – we included the available parent data (n = 1819), and restricting the child sample to those with parent report. While a model that included both motivation factors was available and fit the data well (χ2 = 585*** (DF = 199), CFI = .97, SRMR = .03, RMSEA 90% CI = [.03 – .04]), including the intrinsic motivation factor does not lend any further explanatory power to how either SES or parental attitudes are associated with achievement. We already showed this in the student-data models above and the same holds in the data combining parent- and student data. Therefore, we will here present results using only one motivation factor (self-concept).
The SEM presented in includes two latent variables: student self-concept, specified as in the former model; and an added factor for parental attitudes with seven indicators. We regressed self-concept on both attitude and the SES proxy, and regressed attitude on SES. We regressed the achievement score on SES and self-concept. The model fit the data well (χ2 = 279*** (DF = 84), CFI = .96, SRMR = .03, RMSEA 90% CI = [.03 – 04]).
Figure 6. Path Analysis of Structural Equation Model with Parent- and Student Data, Including One Motivation Factor (Self-Concept) and Parental Attitudes. Note: Total effect of SES on results including all mediating paths: .36 *** (.02). Effect through attitude-motivation path: .005* (.002). Effect through only motivation: .06*** (.01). Controlled for age and gender. *p < .05 **p < .01 ***p < .001.
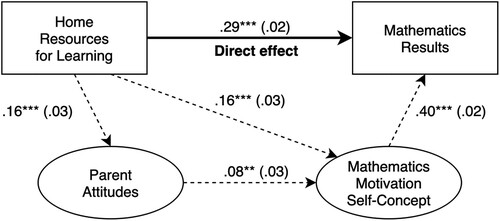
Associations are similar to those found in the student-only data. The associations between the SES indicator and achievement are somewhat stronger but both estimates are within the confidence intervals of the other. The association between self-concept and achievement remains the same. The correlation coefficient between parent-reported SES, measured on a scale of home resources for learning, and self-concept is estimated to .16*** (.03) [.12 – .22], similar to the association found in student-only data (.15*** (.02) [.11 – .18).
3.3.1. Direct and Indirect Effects Including Parent Attitudes and Parent Reported SES
Since intrinsic motivation was not associated with SES at a statistically significant level, the direct and indirect effects reported here were calculated using only self-concept as a mediator. This has a bearing on conclusion drawn from these results, knowing that it is only specific aspects of motivation (herein self-concept) that we found to mediate SES effects on achievement. The main benefit of excluding the intrinsic motivation variables is to avoid suppressor effects and to achieve a more precise estimate of the remaining, significant, effects.
The total effect of SES on mathematics achievement remains significant and substantial, with a total effect coefficient of .36*** (.02). Most of the total effect comes from the direct effect of SES on achievement, which was .31*** (.02). We found a miniscule but significant (at p<.05) indirect effect (.005* [.002]) in the path via attitudes and student self-concept. Circumventing parental attitude, the effect of a path from home resources through self-concept to outcomes was .06*** (.01).
4. Discussion
4.1. Key Findings
We found that SES was associated with test results in both child and parent data, with standardized total effect coefficients of .33 and .36 respectively. In both cases, a small portion of total SES effects (17-19%) was mediated through self-concept. Our estimates of total effect of SES on achievement mirror Turmo’s findings using PISA results and scientific literacy where effect sizes for “home educational resources” and books in the home were similarly predictive (Turmo, Citation2004). Bergem and Nilsen (Citation2016), using the same data as us, found a very strong association between SES indicators and mathematics results in the fifth grade. The difference in power between their results and ours may be attributed to the indicators chosen for SES measurement, where Bergem and Nilsen use four indicators rather than the single variable we use in student data or the TIMSS home resources scale we use in parent data. It is worth noting that their four SES indicators included parent education, reported by the parents, and therefore resemble most closely our parent data which includes only 1819 cases out of the total n=4329 sample.
4.1.1. Student data: does motivation mediate SES effects?
In our first research question, we examined whether motivation accounted for any of the relationship between SES and mathematics achievement. The answer is yes, in the case of student self-concept. Using student data, we found that self-concept mediated 19% of the total SES effects on achievement. In the model that combined both types of motivation (well fitted but rejected because of the suppressor effect of including intrinsic motivation), self-concept mediated 24% of the total SES effects. As both estimates are subject to measurement and estimation error, an exact quantification of the mediation effect is ill advised but an approximate estimate around the 20% mark is suggested by our data. In other words, student data alone indicate that student self-concept explains some of the SES effect on achievement, though much remains to be explained.
4.1.2. Lack of Evidence for Intrinsic Motivation
The latent measurement model for intrinsic motivation proved to fit the data well in confirmatory factor analysis. However, in structural models, intrinsic motivation had very low or insignificant associations with both outcome and independent variables. We interpret this to mean that the inclusion of intrinsic motivation lends no explanatory power on how SES and/or attitudes are associated with achievement. Intrinsic motivation was highly correlated with self-concept (.67), while the one-factor model showed poor fit, suggesting that the two factors we modeled do not measure the same underlying construct. Where Kaarstein and Nilsen (Citation2016) found a .15 correlation between intrinsic motivation and achievement, our analyses established a .11 correlation, though none of this was related to SES. This suggests that while intrinsic motivation is somewhat important for mathematics achievement, it is not affected by family SES. One explanation for this may be the expectancy-value model, where Eccles and Wigfield propose that the social world precedes individual cognitive processes and motivational beliefs, and that the social world primarily transmits ideas of acknowledgement, praise and reward, so that whatever motivation might be spurred by socioeconomic conditions is closely tied with an expected social value and not the intrinsic value of the activity.
4.1.3. Student and parent data: do attitudes mediate SES effects?
We found no evidence that parental attitudes mediate a meaningful portion of the SES correlations with their children’s motivation for mathematics, neither intrinsic motivation nor the students’ self-concept. One model showed a correlation between parental attitudes and the children’s motivation, however the portion of this that was directed from the SES factor was very small (.005) and of less reliable significance. This amounts to about 1% of total SES effects on achievement. There is, however, a significant correlation between SES and parental attitude (.16) – and between SES and self-concept (also .16) – but the important (nil) finding is that the parental attitude does not meaningfully explain the association between SES and motivation. The aspects of parental attitude that are correlated with SES background are largely different from those aspects that are correlated with the children’s self-concept. While the concepts are connected, we have not found a continual path through attitudes and motivation that explains how SES effects work.
4.2. Study Limitations
Quantifying socioeconomic status and -resources is a key challenge for the analyses we have performed. Given the available data, we chose the pragmatic approach of using books at home as reported by the students. While this maximized the sample size for our main analyses, we are sensitive to the potential bias of relying on a single SES indicator. We therefore checked both levels of analysis (student- and parent collected data) with both home resources scale and the “books” indicator, and found that the results were largely the same. The results of these replications with SES indicator substitution are reported in appendix 5. Still, a more fine-grained or multi-faceted SES measurement could have lent the study more nuance in relation to SES differences, had data been available. Moreover, our data is cross-sectional, compromising the temporal order of events, which strictly speaking is a requirement for studying mediation. While reverse causality in one case may be possible – parental attitudes affecting their SES – we find the reverse causality argument that student motivation leads to lower SES less plausible. However, our design cannot rule out unobserved third variables causing both SES and student motivation.
4.3. Implications for Future Research, Policy, and Practice
Future research should extend our investigation in several directions. As the 2019 cycle of TIMSS is analyzed and published in 2020, a new set of data will be available to replicate the analyses we have performed. Going forward, the evidence encourages a conceptual divide between intrinsic motivation and student self-concept, and attention to the difference in effect size between the two. The TIMSS data may be of continued use for researchers interested in examining to what extent and in what ways self-concept mediates the relationship between SES background and achievement. As we found no substantial effects of parental attitudes, it is still unsure whether it is the measurement of attitudes that eludes their effects; yet unspecified paths that divert the effects; or if parental attitudes really have no implication for children’s achievement. In our analyses of the TIMSS attitude items we have not found substantive answers to these questions. In all, the present study confirms and supports the long-standing knowledge among education researchers that SES background is substantially related to school achievement. The present study has identified one path through which the effects of SES background is mediated, though much of the total effect remains to be explained. Our analyses also confirmed that dividing motivation into two conceptually distinct forms was meaningful insofar as self-concept did act as a mediator while intrinsic motivation did not. Future research should also move beyond the use of large-scale assessments, given their individual-level cross sectional nature. One important venue would be to test the mediating mechanisms we identify using longitudinal data, thereby incorporating the implied temporal order of factors in our models. This approach could possibly probe the causal inference by addressing parallel trends in motivation and achievement, for instance by parceling within- and between-person effects (Berry & Willoughby, Citation2017).
Our results could have implications for the policy and practice of reducing social inequality in math achievement. If the results prove robust across replications, they imply that improving students’ motivational self-concept through support from teachers could potentially reduce the socioeconomic gaps in achievement. This is in line with acknowledged levers for reducing inequality through compensatory practices in the school (OECD, Citation2018), and a wider call for attending to so-called non-cognitive factors to promote student growth (Kautz et al., Citation2014). Parallel attention could be paid to the potential role of parental attitudes in mediating the SES effect on motivation by improving parental involvement and informing and motivating parents for supporting their children’s self-concept and motivation for math (Mohr-Schroeder et al., Citation2017), yet this requires care and effort due to parental skepticism and resistance (Jay et al., Citation2018).
In conclusion, our study identifies a probable chain of influences, from family socioeconomics and home learning resources, through parental attitudes towards math, through student self-concept, to math achievement. Policies and practice should not be changed due to results of a single study, but our findings point to an avenue for reducing the socioeconomic gap in math skills through a wider scope of policies and practices than teaching more math, but rather through supporting families and children in attitudes and motivations.
Disclosure Statement
No potential conflict of interest was reported by the author(s).
Additional information
Funding
References
- Amato, P. R., Booth, A., McHale, S. M., & Van Hook, J. (2015). Families in an Era of increasing inequality: Diverging destinies. Springer.
- Bakken, A., Frøyland, L. R., & Sletten, M. A. (2016). Social differences in young people’s lives [Sosiale forskjeller i unges liv] NOVA Report 3/16. ISBN: 978-82-7894-578-0.
- Bergem, O., & Nilsen, T. (2016). Home background : An equitable school [hjemmebakgrunn : En likeverdig skole]. In O. K. Bergem, H. Kaarstein, & T. Nilsen (Eds.), We can do well in STEM: Results and analyses from TIMSS 2015 [Vi kan lykkes i realfag: resultater og analyser fra TIMSS 2015], 158–172. Universitetsforlaget.
- Berry, D., & Willoughby, M. T. (2017). On the practical interpretability of cross-lagged panel models: Rethinking a developmental workhorse. Child Development, 88(4), 1186–1206. doi:https://doi.org/10.1111/cdev.12660
- Braun, S. T. & Stuhler, J. (2018). The transmission of inequality across multiple generations. The Economic Journal (London), 128(609), 576–611. https://doi.org/https://doi.org/10.1111/ecoj.12453
- Chmielewski, A. K. (2019). The global increase in the socioeconomic achievement gap, 1964 to 2015. American Sociological Review, 84(3), 517–544. doi:https://doi.org/10.1177/0003122419847165
- Chmielewski, A. K. & Reardon, S. F. (2016). Patterns of cross-national variation in the association between income and academic achievement. AERA Open, 2(3). https://doi.org/https://doi.org/10.1177/2332858416649593
- Davadas, S. D., & Lay, Y. F. (2018). Factors affecting students’ attitude toward mathematics: A Structural Equation Modeling approach. Eurasia Journal of Mathematics, Science and Technology Education, 14(1), 517–529. doi:https://doi.org/10.12973/ejmste/80356
- Duncan, G. J., Dowsett, C. J., Claessens, A., Magnuson, K., Huston, A. C., Klebanov, P., Pagani, L. S., Feinstein, L., Engel, M., Brooks-Gunn, J., Sexton, H., Duckworth, K., & Japel, C. (2007). School readiness and later achievement. Developmental Psychology, 43(6), 1428–1446. doi: https://doi.org/10.1037/0012-1649.43.6.1428
- Duncan, G. J., Magnuson, K., & Votruba-Drzal, E. (2015). “Children and socioeconomic status.” In M. H. Bornstein, T. Leventhal, & R. M. Lerner (Eds.), Handbook of child psychology and developmental science: Ecological settings and processes, 534–573. John Wiley & Sons Inc.
- Eccles, J. S. (1993). School and family effects on the ontogeny of children’s interests, self-perceptions and activity choices. In J. Jacobs (Ed.), Nebraska symposium on motivation: Developmental perspectives on motivation (pp. 145–208). Nebraska University Press.
- Eccles, J. S., & Wigfield, A. (2002). Motivational beliefs, values and goals. Annual Review of Psychology, 53(1), 109–132. doi:https://doi.org/10.1146/annurev.psych.53.100901.135153
- Eklöf, H., Pavešič, B., & Grønmo, L. (2014). A cross-national comparison of reported effort and mathematics performance in TIMSS advanced. Applied Measurement in Education, 27(1), 31–45. doi: https://doi.org/10.1080/08957347.2013.853070
- Epland, J., & Normann, T. M. (2020.03.04). «Almost 111.000 children grow up in long-term low-income households» [«Nesten 111.000 barn vokser opp med vedvarende lave husholdningsinntekter»]. Statistics Norway. https://www.ssb.no/inntekt-og-forbruk/artikler-og-publikasjoner/nesten-111-000-barn-vokser-opp-med-vedvarende-lave-husholdningsinntekter
- Evans, M. D. R., Kelley, J., Sikora, J., & Treiman, D. J. (2010). Family scholarly culture and educational success: Books and schooling in 27 nations. Research in Social Stratification and Mobility, 28(2), 171–197. doi: https://doi.org/10.1016/j.rssm.2010.01.002
- Ginsburg, H. P., Lee, J. S., & Boyd, J. S. (2008). Mathematics education for young children: What it is and how to promote it. Social Policy Report from the Society for Research in Child Development, 23(1), 1–24. https://doi.org/https://doi.org/10.1002/j.2379-3988.2008.tb00054.x
- Hascoët, M., Giaconi, V., & Jamain, L. (2021). Family socioeconomic status and parental expectations affect mathematics achievement in a national sample of Chilean students. International Journal of Behavioral Development, 45(2), 122–132. doi: https://doi.org/10.1177/0165025420965731
- Herges, R. M., Duffied, S., Martin, W., & Wageman, J. (2017). Motivation and achievement of middle school mathematics students. The Mathematics Educator, 26(1), 83–106. ISSN: ISSN-1062-9017.
- Høgheim, S., & Reber, R. (2019). Interesting, but less interested: Gender differences and similarities in mathematics interest. Scandinavian Journal of Educational Research, 63(2), 285–299. doi: https://doi.org/10.1080/00313831.2017.1336482
- Hu, L., & Bentler, P. M. (1999). Cutoff criteria for fit indexes in covariance structure analysis: Conventional criteria versus new alternatives. Structural Equation Modeling: A Multidisciplinary Journal, 6(1), 1–55. doi: https://doi.org/10.1080/10705519909540118
- Jang, H. (2016). Identifying 21st century STEM competencies using workplace data. Journal of Science Education and Technology, 25(2), 284–301. doi:https://doi.org/10.1007/s10956-015-9593-1
- Jay, T., Rose, J., & Simmons, B. (2018). Why is parental involvement in children’s mathematics learning hard? Parental perspectives on their role supporting children’s learning. SAGE Open, 8(2), 1–13. doi:https://doi.org/10.1177/2158244018775466
- Kaarstein, H., & Nilsen, T. (2016). «Motivation» [«Motivasjon»]. In O. K. Bergem, H. Kaarstein, & T. Nilsen (Eds.), We can do well in STEM: Results and analyses from TIMSS 2015 [Vi kan lykkes i realfag: Resultater og analyser fra TIMSS 2015] (pp. 63–77). Universitetsforlaget.
- Kaarstein, H., & Nilsen, T. (2018). “Norwegian students’ motivation for science through 20 years» [«Norske elevers motivasjon for naturfag gjennom 20 år»]. In J. K. Björnsson, & R. V. Olsen (Eds.), Twenty years of TIMSS and PISA in Norway: Trends and new analyses [Tjue år med TIMSS og PISA i Norge: Trender og nye analyser] (pp. 34–56). Universitetsforlaget.
- Kaarstein, H., Radišić, J., & Nilsen, T. (2018, July 3–7). “20 years of mathematics motivation mirrored through TIMSS: Example of Norway”. Proceedings of the 42nd conference of the International Group for the Psychology of mathematics education, Vol. 1. Umeå, Sweden: PME.
- Kautz, T., Heckman, J. J., Diris, R., Ter Weel, B., & Borghans, L. (2014). Fostering and measuring skills: Improving cognitive and non-cognitive skills to promote lifetime success. OECD.
- Kline, R. B. (2016). Principles and practice of Structural Equation modeling (4th ed). Guilford.
- LaRoche, S., Joncas, M., & Foy, P. (2016). Sample Design in TIMSS 2015. In M. O. Martin, I. V. S. Mullis, & M. Hooper (Eds.), Methods and Procedures in TIMSS 2015 (pp. 3.1-3.37). Boston College, TIMSS & PIRLS International Study Center.
- Lerner, R. E., & Grolnick, W. S. (2020). Maternal involvement and children’s academic motivation and achievement: The roles of maternal autonomy support and children’s affect. Motivation and Emotion, 44(3), 373–388. doi: https://doi.org/10.1007/s11031-019-09813-6
- Martin, M. O., Mullis, I. V. S., & Hooper, M.2016). Methods and Procedures in TIMSS 2015. Boston College, TIMSS & PIRLS International Study Center.
- Martin, M. O., Mullis, I. V. S., Hooper, M., Yin, L., Foy, P., & Palazzo, L. (2016). “Creating and interpreting the TIMSS 2015 context questionnaire scales.” In M. O. Martin, I. V. S. Mullis, & M. Hooper (Eds.), Methods and Procedures in TIMSS 2015 (pp. 15.1-15.312). Boston College, TIMSS & PIRLS International Study Center.
- Martin, N. (2018). Getting to the genetic and environmental roots of educational inequality. npj Science of Learning, 3(1)), doi: https://doi.org/10.1038/s41539-018-0021-1
- Mega, C., Ronconi, L., & De Beni, R. (2014). What makes a good student? How emotions, self-regulated learning, and motivation contribute to academic achievement. Journal of Educational Psychology, 106(1), 121–131. doi: https://doi.org/10.1037/a0033546
- Ministry of Education. (2007). White paper nr. 16 (2006-2007) … noone left behind. Early intervention for lifelong learning. [ … og ingen sto igjen. Tidlig innsats for livslang læring]. Oslo, Norway: The Norwegian Government.
- Mohr-Schroeder, M. J., Jackson, C., Cavalcanti, M., Jong, C., Craig Schroeder, D., & Speler, L. G. (2017). Parents’ attitudes toward mathematics and the influence on their students’ attitudes toward mathematics: A quantitative study. School Science and Mathematics, 117(5), 214–222. doi: https://doi.org/10.1111/ssm.12225
- Mullis, I. V. S., Cotter, K. E., Fishbein, B. G., & Centurino, V. A. S. (2016). Developing the TIMSS 2015 achievement items. In M. O. Martin, I. V. S. Mullis, & M. Hooper (Eds.), Methods and Procedures in TIMSS 2015 (pp. 1.1–1.22). Boston College, TIMSS & PIRLS International Study Center.
- Mullis, I. V. S., & Martin, M. O. (2013). «TIMSS and PIRLS 2011: Relationships among reading, mathematics and science achievement – Implications for early learning”. In Martin, & Mullis (Eds.), TIMSS and PIRLS 2011: Relationships Among reading, mathematics and Science achievement at the Fourth grade – Implications for early learning (pp. 1–11). TIMSS and PIRLS International Study Center.
- Mullis, I. V. S., Martin M. O., & Hooper M. (2017). Measuring changing educational contexts in a changing world: Evolution of the TIMSS and PIRLS questionnaires. In M. Rosén, K. Yang Hansen, & U. Wolff, (Eds.), Cognitive abilities and educational outcomes. Methodology of educational measurement and assessment. Springer. https://doi.org/https://doi.org/10.1007/978-3-319-43473-5_11
- Mullis, I. V. S., Martin, M. O., Ruddock, G. J., O’Sullivan, C. Y., & Preuschoff, C. (2011). TIMSS 2011 Assessment Framework. TIMSS & PIRLS International Study Center.
- National Academies of Sciences, Engineering and Medicine. (2019). A roadmap to reducing child poverty. Duncan & Le Menestrel (Eds.). Washington, DC: The National Academies Press.
- Neuenschwander, M. P., Vida, M., Garrett, J. L., & Eccles, J. S. (2007). Parents’ expectations and students’ achievements in two western nations. International Journal of Behavioral Development, 31(6), 594–602. doi: https://doi.org/10.1177/0165025407080589
- OECD. (2016). “Socio-economic status, student performance and students’ attitudes towards science”, in PISA 2015 Results (Volume I): Excellence and Equity in Education, OECD Publishing, Paris, https://doi.org/https://doi.org/10.1787/9789264266490-10-en
- OECD. (2018). Equity in education: Breaking down barriers to social mobility. OECD Publishing.
- Porumbu, D., & Necşoi, D. (2013). Relationship between parental involvement/attitude and children's school achievements”. Procedia - Social and Behavioral Sciences, 76, 706–710. doi: https://doi.org/10.1016/j.sbspro.2013.04.191
- Rosseel, Y. (2012). Lavaan: An R package for Structural Equation modeling. Journal of Statistical Software, 48(2), 1–36. http://www.jstatsoft.org/v48/i02/ doi:https://doi.org/10.18637/jss.v048.i02
- Rosseel, Y. (2019). lavaan: Latent Variable Analysis. Ghent University, Belgium. R package version 0.6-5 (28.08.19). https://cran.r-project.org/package=lavaan
- Rowell, L., & Hong, E. (2013). Academic motivation: Concepts, strategies, and counseling approaches. Professional School Counseling, 16(3), 158–171. doi: https://doi.org/10.1177/2156759X1701600301
- Ryan, R. M., & Deci, E. L. (2000). Self-determination theory and the facilitation of intrinsic motivation, social development, and well-being. American Psychologist, 55(1), 68–78. doi:https://doi.org/10.1037/0003-066X.55.1.68
- Salvanes, K. G. (2017). «Income difference and social mobility in Norway» [«Inntektsforskjeller og sosial mobilitet i Norge»] in Growing differences – does it matter? Childhood Report 2017 [Økte forskjeller -gjør det noe? Oppvekstrapporten 2017]. Oslo, Norway: Bufdir.
- Schunk, D. H., Pintrich, P. R., & Meece, J. L. (2008). Motivation in education : Theory, research, and application (3rd ed.). Pearson Education.
- Sieben, S., & Lechner, C. M. (2019). Measuring cultural capital through the number of books in the household. Measurement Instruments for the Social Sciences, 1(1), 1–6. doi: https://doi.org/10.1186/s42409-018-0006-0
- Silinskas, G., & Kikas, E. (2019). Parental involvement in math homework: Links to children’s performance and motivation. Scandinavian Journal of Educational Research, 63(1), 17–37. doi: https://doi.org/10.1080/00313831.2017.1324901
- Sirin, S. R. (2005). Socioeconomic status and academic achievement: A meta-analytic review of research 1990–2000? Review of Educational Research, 75(3), 417–453. https://doi.org/https://doi.org/10.3102/00346543075003417
- Statistics Norway. (2020.05.22). National tests. [Nasjonale prøver]. Oslo: Statistics Norway. https://www.ssb.no/utdanning/statistikker/nasjprov/aar
- Stipek, D. J., & Ryan, R. H. (1997). Economically disadvantaged preschoolers: Ready to learn but further to go. Developmental Psychology, 33(4), 711–723. doi: https://doi.org/10.1037/0012-1649.33.4.711
- TIMSS & PIRLS International Study Center. (2016). TIMSS 2015 achievement scaling methodology. In M. O. Martin, I. V. S. Mullis, & M. Hooper (Eds.), Methods and Procedures in TIMSS 2015 (pp. 12.1–12.9). TIMSS and PIRLS International Study Center.
- Turmo, A. (2004). Scientific literacy and socio-economic background among 15-year-olds—a Nordic perspective. Scandinavian Journal of Educational Research, 48(3), 287–305. doi: https://doi.org/10.1080/00313830410001695745
- Von Davier, M., Gonzales, E., & Mislevy, R. (2009). What are plausible values and why are they useful? In M. Von Davier, & D. Hastedt (Eds.), IERI monograph series issues and methodologies in large-scale assessments (Vol. 2, pp. 9–36). IER Institute, Educational Testing Service.
- Vosters, K. & Nybom, M. (2017). Intergenerational persistence in latent socioeconomic status: Evidence from Sweden and the United States. Journal of Labor Economics, 35(3), 869–901. https://doi.org/https://doi.org/10.1086/690827
- Watson, D., Clark, L. A., Chmielewski, M., & Kotov, R. (2013). The value of suppressor effects in explicating the construct validity of symptom measures. Psychological Assessment, 25(3), 929–941. doi: https://doi.org/10.1037/a0032781
- Watkins, C. S., & Howard, M. O. (2015). Educational success among elementary school children from low socioeconomic status families: A systematic review of research assessing parenting factors. Journal of Children & Poverty, 21(1), 17–46. https://doi.org/https://doi.org/10.1080/10796126.2015.1031728
- Watts, T. W. (2020). Academic achievement and economic attainment: Reexamining associations between test scores and long-run earnings. AERA Open, 6(2). https://doi.org/https://doi.org/10.1177/2332858420928985
- White, K. R. (1982). The relation between socioeconomic status and academic achievement. Psychological Bulletin, 91(3), 461–481. https://doi.org/https://doi.org/10.1037/0033-2909.91.3.461
- Wigfield, A., & Eccles, J. S. (2000). Expectancy–value theory of achievement motivation. Contemporary Educational Psychology, 25(1), 68–81. doi: https://doi.org/10.1006/ceps.1999.1015
- World Bank, Development Research Group. (2020). GINI index (World Bank estimate). https://data.worldbank.org/indicator/SI.POV.GINI?locations=NO. Accessed: 15.05.2020
- Yang, Y. (2003). Dimensions of socio-economic status and their relationship to mathematics and science achievement at individual and collective levels. Scandinavian Journal of Educational Research, 47(1), 21–41. doi: https://doi.org/10.1080/00313830308609