
Abstract
While completing a science test and science survey, 155 high school students wore a biometric wristband (measuring electrodermal activity; EDA) and self-reported their science self-efficacy and science anxiety. Adopting a challenge-threat appraisal perspective and latent profile analysis, we explored how students were psychologically (self-efficacy, anxiety) and physiologically (EDA) oriented to science. We identified three groups (profiles), representing different challenge-threat profiles. The largest group was the ‘composed challenge-and-threat’ group (modest EDA, average anxiety, average self-efficacy). The next largest was the ‘aroused high-threat’ group (elevated EDA, elevated anxiety, low self-efficacy). The third represented ‘composed high-challenge’ students (modest EDA, elevated self-efficacy, low anxiety). The aroused high-threat group scored significantly lower than composed high-challenge and composed challenge-and-threat groups in science test performance and flow. Notably, the composed high-challenge and composed challenge-and-threat groups did not significantly differ in test performance; however, the composed high-challenge group was significantly higher in flow than the composed challenge-and-threat group.
Introduction
Research has suggested that whether a student appraises academic tasks as challenging or threatening has implications for their performance on those tasks—with challenge appraisals typically associated with higher performance than threat appraisals (Putwain et al., Citation2017). Drawing on psychological (self-efficacy and anxiety) and physiological (electrodermal activity; EDA) data, the present study investigated students’ challenge and threat appraisals in science and the implication of these appraisals for their science test performance and their subjective experience of science. Using these data, we can gain closer insight into the factors implicated in students’ orientation to and outcomes in science. For example, we can ask if there are different performance and experiential outcomes among students who have similar levels of anxiety and self-efficacy, but who differ on EDA—or students who may differ in self-efficacy and anxiety, but are similar in EDA. As we describe below, triangulating psychological and physiological data in these ways has significant potential to provide more targeted guidance for educators as they seek to assist distinct groups of students who appraise the challenge-threat dimensions of academic tasks in different ways (Järvelä et al., Citation2019).
Perspectives on challenge and threat
Biopsychosocial perspectives on stress have become a dominant approach to understanding challenge and threat (e.g. Seery, Citation2013; Tomaka et al., Citation1997). Theories of cognitive appraisal (e.g. Lazarus & Folkman, Citation1984), that fall under this biopsychosocial perspective, contend that when faced with a task, individuals subjectively assess its demands (primary appraisal) and then assess their capacity to deal with these demands (secondary appraisal). Challenge is experienced when individuals believe they can meet the task demands and that the task is appraised as self-relevant. Threat occurs when they believe they cannot meet the demands of a task they also perceive as self-relevant (see also Lazarus & Folkman, Citation1984; Putwain & Symes, Citation2014, Citation2016; Uphill et al., Citation2019). Moreover, some students can see the same level of task difficulty as either an obstacle or an opportunity, depending on their competence belief profile (Malmberg & Little, Citation2007). In assessing the self-relevance of a task, students may view a task as highly self-relevant, that is aligning strongly with their goals, or less so. This may result in a student sitting anywhere within the evaluative space (Uphill et al., Citation2019) of the orthogonal dimensions of challenge and threat. In major models of cognitive appraisal, researchers have identified psychological (e.g. self-efficacy, anxiety) and physiological dimensions (e.g. EDA) (Harvey et al., Citation2010; Uphill et al., Citation2019), but up to now direct measurement of physiological factors in educational research has been rare.
Psychological challenge-threat indicators
In line with cognitive appraisal theory and also psycho-educational challenge-threat perspectives (e.g. Putwain et al., Citation2015; Putwain & Symes, Citation2014, Citation2016), we propose self-efficacy as a key factor implicated in challenge appraisals. Self-efficacy refers to an individual’s belief that they have the capacity to meet or exceed the demands of a task (Schunk & DiBenedetto, Citation2014). It reflects an individual’s appraisal as to whether they have the personal resources and skills for success on the task and whether their capacity exceeds the task challenge (Bandura, Citation1997). Self-efficacy has thus been inferred as a measure of perceived challenge (Uphill et al., Citation2019). In developing a measure of challenge-threat appraisal in sport (and following theorising by Jones et al., Citation2009), Rossato et al. (Citation2018) reported that ‘where individuals report high levels of self-efficacy … challenge is purported to be elicited’ (p. 164). Furthermore, the challenge scale they developed includes self-efficacy items (e.g. ‘I expect I will achieve success…’). We thus include self-efficacy in our study as an indicator of challenge appraisal (using an academic scale, focussed on science). Following this challenge-appraisal orientation, students who are self-efficacious are more likely to generate and test alternative courses of action, invest greater effort and persistence, and approach difficult tasks with ‘enabling’ cognitive and emotional processes (Bandura, Citation1997). Research has also shown that self-efficacy is significantly associated with higher levels of self-regulation, effort, and achievement (e.g. Schunk & Miller, Citation2002), including when task difficulty is high (Koole et al., Citation2012).
On the other hand, anxiety typically reflects the perception that self-relevant task demands exceed one’s personal resources and capacity (Britton et al., Citation2011)—and thus is associated with threat appraisals (e.g. see Putwain et al., Citation2015, Citation2017). Students experiencing anxiety with regard to specific academic tasks perceive that the task poses a threat to them in some way (Putwain et al., Citation2015, Citation2017). Indeed, Britton et al. (Citation2011) have identified that anxious individuals display perceived threat biases at many levels of information processing (e.g. cognitive appraisal, learning threat biases, etc.). Anxiety has thus been inferred as an indicator of perceived threat (Uphill et al., Citation2019). Moreover, when Rossato et al. (Citation2018) developed a measure of challenge-threat appraisal in sport (following theorising by Jones et al., Citation2009), 6 of the 7 threat scale items included the words ‘worry’ or ‘concern’. We therefore include anxiety in our study as an indicator of threat appraisal (using an academic scale, focussed on science). Following this threat-appraisal orientation, a significant body of work has shown the negative effects of high levels of anxiety on academic outcomes (e.g. Namkung et al., Citation2019) and the helplessness that follows exposure to situations beyond one’s resources and control (Skinner et al., Citation1998). Salient explanations for these effects include impaired resource allocation and cognitive interference (e.g. Ellis & Ashbrook, Citation1989), as well as cognitive initiative impediments (e.g. Hertel, Citation2000). Anxiety also disrupts the flow experience (Shernoff et al., Citation2003).
In guiding our selection of self-efficacy and anxiety as challenge and threat indicators, we also draw on recent work by Meijen et al. (Citation2020) who described how appraisals of challenge and threat may vary the closer an individual gets to the actual task demand when they know what that task is and what its demands are. Thus, if we consider self-reported self-efficacy and anxiety when students are in the task condition, we may consider these measures as more closely reflective of students’ capacity in relation to the immediate challenge and threat at hand. Indeed, it may be further informative to consider theorising by Skinner (Citation1996) who differentiated experienced domain-specific control (the level of control being experienced by a person during a task) from their more domain-general assessments of control not so directly related to a specific task. When viewed from this perspective, our measures of self-efficacy and anxiety, taken when students are in the task condition, may reflect experienced self-efficacy and anxiety and represent analogues of perceived capacity in relation to challenge and threat. To the extent this is the case, we suggest that measures of self-efficacy and anxiety taken when students are in the task condition offer unique insights into self-perceived challenge and threat—especially when combined with contemporaneous objective measures of physiological reactions (EDA, in our study). Nevertheless, we do also recognise there are other self-reported indicators of experienced challenge and threat, including emotional dimensions such as enjoyment, pride, anger, frustration, boredom, etc (Pekrun, Citation2006). Our study focussed on self-efficacy and anxiety, but other self-reported analogues for challenge and threat could be these other emotions.
Taken together, in operationalising psychological dimensions of challenge and threat appraisals in science, the present study assesses students’ self-efficacy (for challenge) and anxiety (for threat) in science. Importantly, however, although our study focuses on higher levels of self-efficacy as reflecting challenge-appraisal and higher levels of anxiety as reflecting threat-appraisal, there are two aspects of our study’s operationalisation of self-efficacy and anxiety that are relevant to interpreting findings. First, challenge and threat assessments are made within the context of a student’s assessment of the relevance of the task to their hierarchy of goals (Elliot, Citation2006). Second, as we describe in more detail below, some students can display simultaneous high challenge/high threat appraisal or simultaneous low challenge/low threat appraisal (Nicholson et al., Citation2019; Uphill et al., Citation2019). For this reason, we have retained separate measures of challenge and threat, treating them as independent dimensions rather than assuming they are simply two ends of the same bipolar dimension.
Augmenting psychological challenge-threat indicators: physiological reactions
To augment our understanding of students’ psychological challenge-threat assessments it can be helpful to include physiological measures which have the potential to yield new nuances in a student’s operationalisation of their challenge-threat orientation (Uphill et al., Citation2019). Alongside psychological appraisals of challenge and threat, there are also physiological reactions to challenge and threat. For example, there is evidence that both arms of the autonomic nervous system, the sympathetic and parasympathetic nervous system, are associated with psychological states and with appraisal processes (Kreibig, Citation2010; Uphill et al., Citation2019). When an individual perceives a challenging or threatening event, the amygdala sends a signal to the hypothalamus which activates the sympathetic nervous system by way of signals through the autonomic nervous system that impacts functions such as skin conductivity, heart rate, blood volume pulse, skin temperature, etc. (see Kreibig, Citation2010 for review). One of these, sympathetic arousal via skin conductivity (EDA, or galvanic skin response), has received substantial attention in psychological research, especially in scenarios and assessment of arousal, stress, and evaluation (see Boucsein, Citation2012; Critchley, Citation2002, for summary of these processes and pathways).
While cardiovascular measures such as heart rate variability have been extensively used as markers of the autonomic nervous system’s response, these are confounded by the actions of both the sympathetic and parasympathetic arms which cause changes in these measures, sometimes in the same directions. EDA is one of the few readily accessible and non-invasive measures which is singly the result of the sympathetic nervous system and thus provides a more direct window into its operation. In his extensive metanalysis of studies correlating measures of the autonomic nervous system with emotion, Kreibig (Citation2010) found 88 of 134 reviewed papers used a measure of electrodermal activity, which was the next most common after cardiovascular measures. We propose EDA as a measure of sympathetic arousal.
Importantly, sympathetic arousal (via EDA) may be associated with either perceived challenge or perceived threat (Feldman-Barrett, Citation2006). It may also affect performance and subjective experience in different ways. For example, some students’ stress and sympathetic arousal may be experienced in negative emotions (e.g. ‘tired’, ‘angry’, ‘nervous’) and impact negatively on their performance via (for example) impairment to memory (Gagnon & Wagner, Citation2016; Oei et al., Citation2006; Pekrun, Citation2006). However, there are other students for whom demanding events are not associated with negative academic outcomes (Martin & Marsh, Citation2003). This may be because their appraisal of and response to these events are in terms of challenge (not threat), activating an adaptive ‘fight’ response which is also associated with sympathetic arousal (Simonov, Citation1991) that is supportive of achievement through enhanced attention, alertness, positive emotions (e.g. ‘excited’, ‘enthusiastic’), and memory consolidation (e.g. Pekrun, Citation2006; Sharot & Phelps, Citation2004).
Rather than seeing sympathetic arousal (via EDA) as a direct reflection of challenge and threat, we propose sympathetic arousal as a potentially additional dimension to assist interpretation of a student’s position in the evaluative challenge-threat space (Uphill et al., Citation2019). Thus, we might ask if there are nuanced differences between two students occupying the same psychological challenge-threat assessment illuminated by different experiences of sympathetic arousal. Answers to this question provide insight into the extent to which physiological data can augment our understanding of psychological appraisals in science.
Outcomes and experiences associated with challenge-threat appraisals
We explore the association between science students’ challenge-threat profiles and two ‘outcomes’ in science: their achievement in a science test and their flow in science. Achievement is routinely recognised as an important educational outcome, with significant implications for students during school and also for their post-school pathways (Palmer et al., Citation2017). It is also the case that students’ subjective experience is a desirable end in itself (Shernoff et al., Citation2003). Flow represents an optimal subjective experience that is experienced when an individual is engaged in an activity that is appropriately challenging to their skill level (Shernoff et al., Citation2003). When an individual perceives they have the resources and capacity to meet or exceed the demands of the task, they experience flow (Inkinen et al., Citation2014; Martin & Jackson, Citation2008). Conversely, the anxiety experienced when task demands are appraised as exceeding one’s resources and capacity is antithetical to optimal subjective and immersed experience such as flow (Britton et al., Citation2011).
Recent extensions on ‘classic’ stress models—and implications for data analysis
Diverse challenge-threat profiles
Recent reviews of biopsychosocial theories (and other stress perspectives) have been critical of the fact that challenge and threat are too often considered as unidimensional/bipolar (viz. that challenge is the opposite end of threat, or that an individual is either challenged or threatened) (Uphill et al., Citation2019). Uphill et al. (Citation2019) note that this narrow configuration does not reflect the reality that evaluations of positivity and negativity are generally distinct and separable psychological and neural systems. For example, in the education domain there has been recognition for the potential coactivation of both challenge and threat and both approach and avoidance (e.g. Elliot & Covington, Citation2001), as well as multidimensional challenge-threat student typologies (e.g. Bassi et al., Citation2007; Inkinen et al., Citation2014; Nicholson et al., Citation2019). For example, Hulleman et al. (Citation2010) identified a positive correlation between performance-avoidance performance-approach goals. Likewise, Law et al. (Citation2012) identified the coactivation of performance-avoidance and performance-approach goals. Students can also conceive of a situation as an opportunity for both gain and loss (Sirsch, Citation2003). Indeed, neuroscientific literature suggests the brain can simultaneously process positive and negative information (Man et al., Citation2017) and can concurrently mentally represent positive and negative evaluations (Zayas & Shoda, Citation2015). Extrapolating from these perspectives, it is possible a student might appraise an academic demand as an opportunity for (a) both gain and loss—i.e. challenge and threat, (b) neither gain nor loss—neither challenge nor threat, and (c) one over the other—challenge more than threat or threat more than challenge (Uphill et al., Citation2019).
This being the case, it is important to consider students in terms of both challenge and threat—for example, in the case of the present study’s psychological factors, both self-efficacy and anxiety. Thus, although we typically consider students as high in self-efficacy and low in anxiety (or vice versa), following Uphill et al. (Citation2019) it is also possible there are students low in both (i.e. they do not believe they can meet the task demand and they are not anxious about it) and students high in both (e.g. they believe they can meet the task demand and they are anxious about it).
Implications for data analysis—the yield of person-centered approaches
It therefore follows that different groups of students may reflect different patterns in how psychological and physiological factors may manifest in their science experience. Person-centered analyses (in our study, latent profile analysis—LPA) are ideal for capturing these differences. Person-centered approaches, which enable identification of profiles of students based on their psychological and physiological variables (science anxiety, self-efficacy, EDA), are an effective method for identifying subgroups within a larger group (Collie et al., Citation2015). Specifically, by revealing the way science anxiety, self-efficacy, and sympathetic arousal co-occur among subgroups of science students, person-centered approaches make it possible to identify the different types of students that reside within the learning context and the distinct ways these different types of students are oriented to science and its task demands (also see Online Supplementary Materials for educational implications of LPA findings). Indeed, research has suggested that physiological arousal may reflect positive (e.g. challenge) or negative dimensions (e.g. threat) depending on what psychological factors accompany it—for example, Baker et al. (Citation2010) suggested that high physiological arousal may not be a problem if accompanied by adaptive motivation factors such as self-regulation. LPA enables us to see what happens when similar physiological levels are accompanied by different psychological profiles (and vice versa). Also, as noted above, it is possible that students may believe they are up to the demands of the task (high self-efficacy), but also worry about it (high anxiety). LPA is able to unearth these profiles as well (Nicholson et al., Citation2019). Thus, from a challenge-threat perspective, the present study employed LPA to identify different profiles (or, groups) of science students using science self-efficacy, science anxiety, and sympathetic arousal during a science task as indicators of these profiles.
Aims of the present study
While completing a science test and science survey, high school students wore a biometric wristband that collected electrodermal activity (EDA) signals and they also responded to items assessing science self-efficacy and science anxiety. Using this methodology and person-centered analyses, we sought to explore Uphill et al.'s (Citation2019) recent extension of challenge-threat frameworks to ascertain if additional profiles (e.g. low challenge/low threat and high challenge/high threat) are evident among students in science—and the factors and outcomes associated with these profiles. Given our combination of science factors (self-efficacy, anxiety, sympathetic arousal, etc.) has not been previously examined from a person-centered perspective and following Uphill et al.’s (Citation2019) open question as to the co-activation of challenge and threat appraisals, we position this study as exploratory rather than one driven by directional hypotheses.
Method
Participants
Participants were 155 students in Grade 7 (29%), Grade 8 (27%), Grade 9 (21%), and Grade 10 (23%) from two single-sex independent schools. The independent sector is the third largest in Australia, after government and systemic Catholic school sectors. One school was a boys’ school and one was a girls’ school, both located in a major urban area on Australia’s east coast. These schools are not academically selective, however, they do trend higher in aggregate literacy and numeracy based on data from the Australian Curriculum and Assessment Authority (ACARA). Students were aged 12–16 years (M = 13.97, SD = 1.25). Thirty-one percent were girls and 69% were boys. This ratio was not dissimilar to the ratio of the two school sizes, 40:60 (in Online Supplementary Materials we tested for gender effects). Students varied in SES (range 822–1210, M = 1087, SD = 84 on the Australian Bureau of Statistics Index of Relative Socio-Economic Advantage and Disadvantage classification), but in aggregate were marginally higher than the national average of 1000. Just under 13% of participants were of a non-English speaking home background. Data are shared with a study on the causal relationships between self-efficacy and achievement (Martin et al., Citation2019).
Procedure
Ethics approval was provided by the University Human Research Ethics Committee. School Principals provided signed consent for their school’s participation, as did parents/caregivers for their child’s participation. Measurement involved an online survey comprising socio-demographic items as well as science anxiety, self-efficacy, and flow measures. Students also completed a (hard copy) science test. While responding to all measures, participants wore a biometric wristband (Empatica E4) on their non-dominant arm to collect streamed physiological data (via EDA). As a quality control procedure, to ensure the Empatica E4 devices were working properly and capturing data accurately, the testing was conducted in small groups of 6–10 students. This allowed monitoring of equipment and data flow. These groups were conducted in the same room at each of the two schools, and the same research assistant supervised participants on every occasion. The same instructions were provided to participants in each testing session. The research assistant explained the survey’s rating scales, the science test, the equipment, and the procedure. Although participants completed measures independently, they were informed they could ask the research assistant for help if experiencing any procedural or equipment difficulties.
Materials
Science anxiety (threat appraisal indicator) and science self-efficacy (challenge appraisal indicator)
Science anxiety and science self-efficacy were assessed using items from the Motivation and Engagement Scale—High School (MES-HS; Martin, Citation2015), adapted to science (Green et al., Citation2007). Science anxiety (e.g. ‘I worry about failing exams and assignments in science’; ‘When exams and assignments are coming up for science, I worry a lot’) was administered as an indicator of threat appraisal for science task demands (reflecting the student’s fears about their personal capacity to meet the task demand; consistent with items in Rossato et al.’s [Citation2018] threat measure for sport). Self-efficacy (e.g. ‘If I try hard, I believe I can do well in science’; ‘If I don’t give up, I believe I can do difficult science’) was administered as an indicator of challenge appraisal (reflecting the student’s appraisal that their personal capacity is sufficient to meet the task demand; consistent with items in Rossato et al.’s [Citation2018] challenge measure for sport). Each scale comprised four items that were rated from 1 (strongly disagree) to 7 (strongly agree). In previous psychometric research, both anxiety and self-efficacy are normally distributed, reliable, and validated with educational outcomes (for review see Liem & Martin, Citation2012), including in science (Green et al., Citation2007). In the current investigation, science anxiety and science self-efficacy were also reliable and normally distributed (see for descriptive and psychometric properties).
Table 1. Descriptive and reliability statistics.
Sympathetic arousal: electrodermal activity (EDA)
A biometric wristband (Empatica E4) was used to collect streamed data from a conductivity sensor to measure sympathetic nervous system arousal and derive features related to stress. We adopted a curve-fitting approach for modelling the EDA signals, employed in the Ledalab tool (Ledalab, Citation2019; see also Boucsein, Citation2012). Online Supplementary Materials describe this approach. As shown in , this measure was approximately normally distributed (skewness and kurtosis) and reliable (calculated by taking the mean EDA value from each half of the achievement test and calculating coefficient omega using these values).
Science achievement
We assessed science achievement using items from the Australian Council for Educational Research (ACER) Progressive Achievement Tests in Science (PAT Science; Martin et al., Citation2009). The PAT Science is a nationally normed and validated science achievement measure (Masters, Citation2009). It assesses scientific literacy, scientific knowledge, scientific understanding, and application of scientific principles. Test items are designed to address material in the Australian science curriculum. Sample items are presented in Online Supplementary Materials. The number of correct responses was added to create a total achievement score—reflecting something of a formative construct. For each year group, there are appropriately graduated items that have a common scale across tests, enabling researchers to compare different students irrespective of their year group or the particular items administered. To also graduate the difficulty, the upper two year groups received 4 more questions than the lower two year groups (28 questions and 24 questions respectively). To allow comparability across year levels, we standardised (M = 0, SD = 1.00) scores within each year group. presents mean, standard deviation, skewness, kurtosis, and reliability (coefficient omega) for science achievement. These results show that this measure was approximately normally distributed (skewness and kurtosis) and reliable (coefficient omega).
Flow in science
We assessed flow in science using Martin and Jackson’s (Citation2008) Core Flow Scale. This comprised ten items (e.g. ‘When I participate in science, I am totally involved; ‘When I participate in science, it feels like nothing else matters’) rated from 1 (strongly disagree) to 7 (strongly agree). Martin and Jackson (Citation2008) have demonstrated the psychometric properties of the Core Flow Scale, including in the STEM area (mathematics). We adapted the Core Flow Scale to apply to science. shows that this measure was approximately normally distributed (skewness and kurtosis) and reliable (coefficient omega).
Background attributes
In supplementary analyses (presented in Online Supplementary Materials) we also examined the extent to which various background attributes were associated with challenge-threat profiles. Background variables comprised gender, age, socio-economic status (SES), language background, and science year rank.
Data analysis
Using Mplus 7.20 (Muthén & Muthén, Citation2014), we ran LPA with the three profile indicators (science anxiety, self-efficacy, EDA) using maximum likelihood with robustness to non-normality (MLR). Given that anxiety and self-efficacy were multi-item scales, we accounted for their unreliability by first conducting confirmatory factor analysis (CFA; χ2 = 27.66, df = 25, p = .33, CFI = .99, RMSEA = .026, SRMR = .054) of these scales in Mplus and imported factor scores from the CFA output into the LPA analyses. To assist interpretation of profiles, prior to the LPA factors were standardised (M = 0; SD = 1.00). Given the partially exploratory nature of analyses, to yield the best solution we ran profile enumeration techniques with 2–7 profiles. We adhered to the conditional independence assumption by constraining covariances between variables to zero (Marsh et al., Citation2009). Profile indicator variances were allowed to vary across profiles. Each model had 10,000 starts with 100 iterations in the initial stage and 100 final stage optimizations were run. To guard against local solution convergence, in deciding on the final profile membership we ascertained that the best log-likelihood value was replicated.
We employed several fit indices to decide on the final solution, but also considered conceptual reasoning and parsimony as criteria (Bauer & Curran, Citation2004). This is because LPA entails both statistical evaluation and some subjective judgement following conceptual grounding and data interpretation (Marsh et al., Citation2009). Fit indices included the sample-size-adjusted Bayesian Information Criteria (SSA-BIC), the log-likelihood value, the p value of the Lo-Mendell–Rubin Likelihood Ratio Test (pLMR), and the p value of the Bootstrapped Likelihood Ratio Test (pBLRT). For SSA-BIC and log-likelihood, lower values indicate better fit. The pLMR and pBLRT identify the extent to which the correct number of classes have been identified. A significant value indicates a significantly better profile selection than the previous profile selection (e.g. where a 3-profile solution is significantly better than a 2-profile solution). Entropy is also reported as a test of class separation, with values >.70 suggesting the latent classes are discriminating.
When the final solution was identified, profiles were interpreted by inspecting the means of the profile variables. We used Wald tests of difference (via ‘model test’ in Mplus; Muthén & Muthén, Citation2014) to test for significant differences across profiles on each of the indicator variables. We then examined science ‘outcomes’ as a function of profile membership. For this we used the ‘DU3STEP’ option in Mplus. This tested for significant differences in science test achievement and science flow between profile groups. In Online Supplementary Materials we examined the extent to which profile membership was associated with student characteristics (e.g. gender, age, etc.).
Results
Preliminary descriptive analyses
Means, standard deviations, skewness, kurtosis, and reliability for each substantive variable are presented in (see Participants for background attribute descriptive statistics). Variables were approximately normally distributed and reliability coefficients indicated they were all reliable. Correlations among profile indicators were as follows: science anxiety and self-efficacy, r = −.19, p < .05; science self-efficacy and EDA, r = −.03, p = .77; science anxiety and EDA, r = .21, p < .01. Correlations between profile indicators and outcomes were as follows: science anxiety and achievement, r = −.16, p = .08; science anxiety and flow, r = −.26, p < .01; science self-efficacy and achievement, r = .29, p < .001; science self-efficacy and flow, r = .65, p < .001; EDA and achievement, r = −.20, p < .01; EDA and flow, r = −.05, p = .46.
Identifying profiles
shows the fit statistics of the models with 2 to 7 profiles. We immediately discounted the 4- to 6-profile solutions as they could not replicate the best log-likelihood that is critical for a proper solution. We also discounted the 7-profile solution because of the non-significant pLMR (indicating it is not a significant improvement on the 6-profile solution) and also the low minimum group size of 2% (small frequencies raise concerns about the benefits of adding additional profiles when they represent so few participants; Lubke & Neale, Citation2006).
Table 2. Fit statistics, entropy, and profile size for various profile solutions.
We then considered fit statistics for the 2- to 3-profile solutions. The SSA-BIC decreased as more profiles were added, suggesting that each additional profile improved fit. The pLMR and pBLRT for each of these models were similar, further suggesting that each solution provided significantly better fit than a previous solution (thus, the 3-profile solution was significantly better fit than the 2-profile solution). There was also a rise in entropy when moving from the 2-profile to the 3-profile solution. Thus, taking this reasoning together (i.e. fit indices, parsimony, separation of groups), we pursued a 3-profile solution as the final model.
Then we looked to more closely interpret the three profiles. plots the means of the profile indicators for each group. also shows these means, along with sample proportions, significant differences from the sample average of zero (indicated by †), significant differences between profiles (indicated by alphabetical superscripts), and the proposed name for each profile (based on interpreting the values for each profile and any significant differences indicated by † and alphabetical superscripts).
Figure 1. The final three derived profiles (standardised scores; mean = 0). Note. shows significant differences in the profile indicator variables (science anxiety, science self-efficacy, EDA during science task) across the profiles.
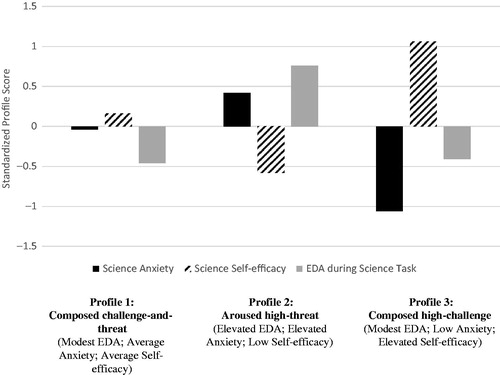
Table 3. Latent profile analysis solution and significant mean differences in latent profile indicators.
The results show that students within Profile 1 (52% of the sample) exhibited average science anxiety (as it is not significantly different from zero, the sample average), average science self-efficacy (as it is not significantly different from zero, the sample average), and modest EDA. We suggest this pattern reflects a ‘composed challenge-and-threat’ profile—i.e. modest level of sympathetic arousal, some level of anxiety, and some belief in their own capacity. Students in Profile 2 (34% of the sample) exhibited elevated science anxiety, low science self-efficacy, and elevated EDA. This group is named ‘aroused high-threat’—i.e. high sympathetic arousal, little belief in their own capacity, and elevated levels of anxiety. Students in Profile 3 (14% of the sample) exhibited low levels of science anxiety, elevated science self-efficacy, and modest EDA. We have named this group ‘composed high-challenge’—i.e. modest levels of sympathetic arousal, substantial belief in their own capacity, and relatively little anxiety.
Using the Wald test (see Data Analysis), we examined the extent to which these profiles differed from each other on the indicator variables. Results are shown in . For science anxiety, all groups were significantly different: aroused high-threat > composed challenge-and-threat > composed high-challenge. For science self-efficacy, all groups were also significantly different: composed high-challenge > composed challenge-and-threat > aroused high-threat. For EDA, composed challenge-and-threat and composed high-challenge profiles did not differ significantly (composed challenge-and-threat = composed high-challenge); however, there were significant differences in EDA on the other comparisons: aroused high-threat > composed challenge-and-threat; aroused high-threat > composed high-challenge.
Differences between profiles in science test performance and flow in science
Science test performance
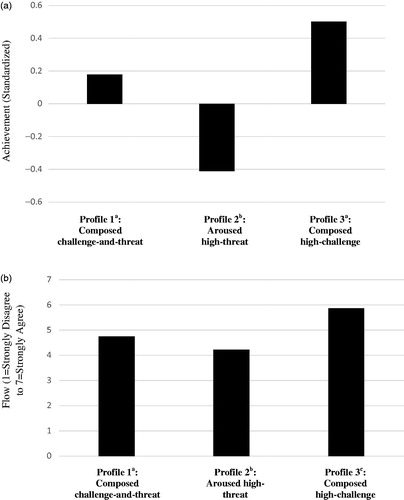
We then assessed for differences in test performance. Mean test performance scores are plotted in . For test performance, there was an omnibus significant difference between profiles (χ2 = 20.11, df = 2, p < .001). Follow-up tests indicated that the composed challenge-and-threat profile (Profile 1) scored significantly higher in performance than the aroused high-threat profile, Profile 2 (χ2 = 13.36, df = 1, p < .001). The composed high-challenge profile (Profile 3) also scored significantly higher in test performance than the aroused high-threat profile, Profile 2 (χ2 = 14.13, df = 1, p < .001). There was no significant difference in test performance between composed challenge-and-threat and composed high-challenge profiles (Profiles 1 and 3).
Figure 2. (a) Differences across profiles in science test achievement. Note: Different superscripts indicate two profile groups significantly different on achievement, p < .05. (b) Differences across profiles in science flow. Note. Different superscripts indicate two profile groups significantly different on flow, p < .05.
Flow in science
For flow, there was an omnibus significant difference between profiles (χ2 = 57.84, df = 2, p < .001). Follow-up tests indicated that the composed challenge-and-threat profile (Profile 1; χ2 = 9.77, df = 1, p < .001) and the composed high-challenge profile (Profile 3; χ2 = 57.70, df = 1, p < .001) scored significantly higher in flow than the aroused high-threat profile, Profile 2. Further, the composed high-challenge profile (Profile 3) scored significantly higher in flow than the composed challenge-and-threat profile, Profile 1 (χ2 = 29.46, df = 1, p < .001).
Discussion
We identified three groups of science students, each representing a different profile in terms of challenge and threat. The largest group was the composed challenge-and-threat profile (average science anxiety, average science self-efficacy, modest EDA). The next largest group was the aroused high-threat profile (elevated science anxiety, low science self-efficacy, elevated EDA). The third group represented the composed high-challenge students (low science anxiety, elevated science self-efficacy, modest EDA). We found that anxiety and self-efficacy separated all groups and EDA separated the aroused high-threat group from both composed high-challenge and composed challenge-and-threat groups. In terms of test performance and flow, the composed high-challenge and composed challenge-and-threat groups performed significantly better than the aroused high-threat group. Interestingly, the composed challenge-and-threat and composed high-challenge groups did not differ in test performance—but the composed high-challenge group did experience more flow than the composed challenge-and-threat group.
Yields of integrating psychological and physiological measures
Complementing typical self-report methods with real-time, bio-psychological indicators helped unearth insights into students’ orientation to science. The joint operation of psychological and physiological profile indicators was associated with different levels of test performance among the groups. For example, there was no difference between the composed challenge-and-threat and composed high-challenge groups (Profiles 1 and 3) in test performance and it is noteworthy that these groups also did not differ in EDA (that is, they were both relatively ‘composed’ from a sympathetic arousal perspective, even though they differed in anxiety and self-efficacy). Thus, for the composed challenge-and-threat group it may be that modest levels of EDA combined with average anxiety and self-efficacy is sufficient to maintain test performance that is in line with the composed high-challenge group. The equivalence in EDA between composed challenge-and-threat and composed high-challenge profiles, then, was helpful in identifying when differences in psychological factors for the two groups (i.e. differences in anxiety and self-efficacy) are not associated with different test outcomes. However, differences in the psychological indicators did help understand differences in students’ subjective experience of science (flow).
This highlights the important role played by both physiological and psychological profile indicators—and the important role of latent profile analysis in allowing different combinations of these indicators to emerge. Physiological data (EDA) were helpful in understanding equivalence in science test performance between composed challenge-and-threat and composed high-challenge groups—and also the poor performance of the aroused high-threat group. Psychological data (science self-efficacy and science anxiety) were helpful in understanding differences in science flow—and again, the poor performance of the aroused high-threat group.
Insights into theory and constructs
As we noted in the Introduction, recent reviews of biopsychosocial theories have been critical of the fact that challenge and threat are too often considered in unidimensional/bipolar ways (Uphill et al., Citation2019). The claim is that this bipolar configuration does not recognise the potential coactivation of both challenge and threat and both approach and avoidance (e.g. Elliot & Covington, Citation2001; Nicholson et al., Citation2019). Indeed, Putwain et al. (Citation2017) have also indicated more complex responses from a challenge and threat perspective; for example, they have shown that even within a fear-based context (e.g. fear appeals by teachers), students can appraise this in terms of challenge and threat. Following these more multi-faceted challenge-threat possibilities, Uphill et al. (Citation2019) suggested that a student might appraise a test as both a challenge and a threat, neither a challenge nor a threat, or one more than the other (for similar arguments for potential co-activation, see Law et al., Citation2012; Sirsch, Citation2003). We found partial support for this contention. We did find the two ‘classic’ profiles of composed high-challenge (elevated science self-efficacy, low anxiety, modest EDA) and aroused high-threat (low self-efficacy, elevated anxiety, elevated EDA). Also in line with Uphill et al.’s thesis, we identified a composed challenge-and-threat profile reflecting average self-efficacy, average anxiety, and modest EDA. In fact, these three profiles also have some resonance with the multidimensional challenge-threat frameworks suggested by Bassi et al. (Citation2007) and Inkinen et al. (Citation2014). For example, among Bassi et al.’s typologies (or, ‘channels’) are: the ‘optimal experience’ channel (reflecting high skill relative to the challenge) that aligns with our composed high-challenge profile, and the ‘worry’ and ‘anxiety’ channels (reflecting low skill relative to the challenge) that aligns with our aroused high-threat group.
Indeed, the composed challenge-and-threat profile revealed in our analyses was an interesting one. The composed challenge-and-threat profile demonstrated that performance is not impaired if physiological arousal and anxiety are not elevated (as they were for the aroused high-threat profile), and if both these features are accompanied by an average level of self-efficacy. Indeed, key features of the composed challenge-and-threat profile (especially modest EDA and average anxiety) are in keeping with major models of arousal that do not rule out the benefits of some level of anxiety (e.g. Keeley et al., Citation2008). Notwithstanding this, our modelling also showed that the composed challenge-and-threat profile did not fare so well in terms of flow; here, the composed high-challenge profile exceeded the composed challenge-and-threat profile. Thus, in regard to flow as an outcome, science practitioners might look to shift students from the composed challenge-and-threat profile to the composed high-challenge profile. Our study suggests they would do this by reducing science anxiety and increasing science self-efficacy—discussed below.
Implications for practice
Psychological intervention
It was clear that higher self-efficacy and lower anxiety in science was associated with higher test performance and flow. Strategies promoting self-efficacy include encouraging students to challenge negative beliefs about themselves, particularly when they encounter challenging academic tasks (Wigfield & Tonks, Citation2002). Educators might also frame science tasks (including tests) in positive and task-focussed ways, reminding students of their strengths and what they have learnt in science which can also be motivating and energising (Higgins et al., Citation2001). Regarding anxiety, there tends to be three main types of programs offered in schools: universal programs for all students, selective programs targeting students at-risk of developing problematic anxiety (at clinical levels), and specific programs for students experiencing clinical levels of anxiety. Successful programs often involve cognitive–behavioural approaches (Neil & Christensen, Citation2009) such that, for example, students are explicitly taught strategies to reduce their anxiety (e.g. planning specific cognitive and behavioural actions for when anxiety threatens or strikes).
Physiological intervention
Real-time monitoring of EDA markers enables real-time intervention, including when perceived challenge and threat is in play. According to Pijeira-Díaz et al. (Citation2018), when educators are aware of students’ arousal levels, there are numerous options, including (a) stress management strategies, (b) biofeedback, and (c) modifying the classroom environment to reduce threat and optimise challenge. In terms of stress management and biofeedback, monitoring EDA may also provide a tangible and practical indicator of when anxiety moves from being adaptive to maladaptive. Giving students access to their real-time sympathetic arousal via EDA may provide them with a useful feedback measure to assist them to keep their anxiety in the adaptive range. Electronic monitoring of a typically automatic bodily function (e.g. sympathetic nervous arousal via EDA) would then be used to train the student to acquire more voluntary control of that function (Yucha & Montgomery, Citation2008). Thus, for example, students would monitor their EDA in real-time and engage in systematic relaxation (e.g. a breathing exercise; Boyes, Citation2015) when EDA levels elevate too much. Over time, the aim is to train students to reduce physiological stress in real-time as it arises. In terms of classroom adaptations, real-time arousal information can inform teachers about what situations (e.g. introduction of challenging concepts, tests, group activities) may be associated with problematic arousal and allow modifications of tasks or instruction to address this (Pijeira-Díaz et al., Citation2018).
Limitations and future directions
There are some limitations important to consider when interpreting findings and which hold directions for further research. First, our study included self-efficacy and anxiety as indicators of challenge and threat appraisals (e.g. see Jones et al., Citation2009). As described earlier, the items we used to operationalise these factors were aimed at accessing a student’s fearful concerns about science task demands (threat appraisal, in the case of anxiety; see Rossato et al., Citation2018) and their personal capacity to meet science task demands (challenge appraisal, in the case of self-efficacy; Rossato et al., Citation2018). The self-efficacy and anxiety items were also administered during the task condition (online science test) which we earlier argued are more reflective of actual perceived capacity and may be considered to represent experienced domain-specific analogues of perceived challenge and threat. However, being indicators of challenge and threat appraisals, there is a need for research using other measures of perceived challenge and threat to test the generality of our findings. These might include affective dimensions that may reflect perceived challenge-threat, such as enjoyment, hope, frustration, depression, anger, boredom, etc. (Pekrun, Citation2006). Also, in the case of lower levels of self-efficacy, it is possible that some students may interpret their lack of capacity to meet the challenge as a threat; and, in the case of lower levels of anxiety, it is possible that some students may interpret the absence of threat as a challenge. Our data did not indicate this, but future work may further explore this. Second, this study was conducted in a school subject that is challenging (Coe et al., Citation2008) and one in which many students struggle (Office of the Chief Scientist, Citation2014). Anxiety and elevated EDA are thus likely to be salient. Research is now needed to explore the extent to which these findings apply to other school subjects. Third, an important follow up to our research is to conduct interventions targeting self-efficacy, anxiety, and EDA—and investigating the extent to which change in profile membership is possible and the effects of this on academic outcomes. Fourth, we did not have data to precisely understand how or why EDA may be associated with test achievement and flow. Others have suggested that elevated EDA impairs memory (e.g. Gagnon & Wagner, Citation2016; Oei et al., Citation2006) and so future research might extend to neuro-psychological measures to see what neural factors are at play that may impact achievement. Finally, when capturing bio-data such as EDA, decisions need to be made about how to aggregate and manage that data. We used the Ledalab tool (Ledalab, Citation2019) to generate our EDA values. There are other approaches that can be explored. For example, one such alternative is to use Fourier Transform (e.g. see Yoshizawa et al., Citation2011) to separate tonic and phasic signals. Unlike the curve-fitting approach of LedaLab, this approach transforms the time varying data into the frequency domain. This approach is agnostic in regard to a predetermined rise-fall curve in conductivity caused by a sudomotor event and thereby suffers less from type 2 errors than the curve fitting approach. The downside is that is it more prone to type 1 errors by assuming that all high frequency power is the result of sudomotor activity. Thus, as with any measure, researchers select what best addresses the research problem posed.
CEDP-2019-0367-File002.docx
Download MS Word (31.7 KB)Acknowledgements
The authors thank the two participating schools for assisting with data collection and Rebecca Collie for input on data analysis.
Correction Statement
This article has been corrected with minor changes. These changes do not impact the academic content of the article.
Additional information
Funding
References
- Baker, R. S., D’Mello, S. K., Rodrigo, M. T., & Graesser, A. C. (2010). Better to be frustrated than bored: The incidence and persistence of affect during interactions with three different computer‐based learning environments. International Journal of Human-Computer Studies, 68(4), 223–241. https://doi.org/10.1016/j.ijhcs.2009.12.003
- Bandura, A. (1997). Self-efficacy: The exercise of control. Freeman.
- Bassi, M., Steca, P., Delle Fave, A., & Caprara, G. V. (2007). Academic self-efficacy beliefs and quality of experience in learning. Journal of Youth and Adolescence, 36(3), 301–312. https://doi.org/10.1007/s10964-006-9069-y
- Bauer, D. J., & Curran, P. J. (2004). The integration of continuous and discrete latent variable models: Potential problems and promising opportunities. Psychological Methods, 9(1), 3–29. https://doi.org/10.1037/1082-989X.9.1.3
- Boucsein, W. (2012). Electrodermal activity. Springer. https://doi.org/10.1007/978-1-4614-1126-0
- Boyes, A. (2015). The anxiety toolkit: Strategies for fine-tuning your mind and moving past your stuck points. TarcherPerigee.
- Britton, J. C., Lissek, S., Grillon, C., Norcross, M. A., & Pine, D. S. (2011). Development of anxiety: The role of threat appraisal and fear learning. Depression and Anxiety, 28(1), 5–17. https://doi.org/10.1002/da.20733
- Coe, R., Searle, J., Barmby, P., Jones, K., & Higgins, S. (2008). Relative difficulty of examinations in different subjects. Report for SCORE (Science Community Supporting Education). Centre for Evaluation and Modelling, Durham University.
- Collie, R. J., Shapka, J. D., Perry, N. E., & Martin, A. J. (2015). Teachers’ beliefs about social-emotional learning: Identifying teacher profiles and their relations with job stress and satisfaction. Learning and Instruction, 39, 148–157. https://doi.org/10.1016/j.learninstruc.2015.06.002
- Critchley, H. D. (2002). Electrodermal responses: What happens in the brain. The Neuroscientist : A Review Journal Bringing Neurobiology, Neurology and Psychiatry, 8(2), 132–142. https://doi.org/10.1177/107385840200800209
- Elliot, A. J. (2006). The hierarchical model of approach-avoidance motivation. Motivation and Emotion, 30(2), 111–116. https://doi.org/10.1007/s11031-006-9028-7
- Elliot, A. J., & Covington, M. V. (2001). Approach and avoidance motivation. Educational Psychology Review, 13(2), 73–92. https://doi.org/10.1023/A:1009009018235
- Ellis, H. C., & Ashbrook, P. W. (1989). The “state” of mood and memory research: A selective review. Journal of Social Behavior and Personality, 4, 1–21.
- Feldman-Barrett, L. (2006). Are emotions natural kinds? Perspectives on Psychological Science : A Journal of the Association for Psychological Science, 1(1), 28–58. https://doi.org/10.1111/j.1745-6916.2006.00003.x
- Gagnon, S. A., & Wagner, A. D. (2016). Acute stress and episodic memory retrieval: Neurobiological mechanisms and behavioral consequences. Annals of the New York Academy of Sciences, 1369(1), 55–75. https://doi.org/10.1111/nyas.12996
- Green, J., Martin, A. J., & Marsh, H. W. (2007). Motivation and engagement in English, mathematics and science high school subjects: Towards an understanding of multidimensional domain specificity. Learning and Individual Differences, 17(3), 269–279. https://doi.org/10.1016/j.lindif.2006.12.003
- Harvey, A., Nathens, A. B., Bandiera, G., & LeBlanc, V. R. (2010). Threat and challenge: Cognitive appraisal and stress responses in simulated trauma resuscitations. Medical Education, 44(6), 587–594. https://doi.org/10.1111/j.1365-2923.2010.03634.x
- Hertel, P. T. (2000). The cognitive-initiative account of depression-related impairments in memory. Psychology of Learning and Motivation, 39, 47–71. https://doi.org/10.1016/S0079-7421(00)80030-4
- Higgins, E. T., Friedman, R. S., Harlow, R. E., Idson, L. C., Ayduk, O. N., & Taylor, A. (2001). Achievement orientations from subjective histories of success: Promotion pride versus prevention pride. European Journal of Social Psychology, 31(1), 3–23. https://doi.org/10.1002/ejsp.27
- Hulleman, C. S., Schrager, S. M., Bodmann, S. M., & Harackiewicz, J. M. (2010). A meta-analytic review of achievement goal measures: Different labels for the same constructs or different constructs with similar labels? Psychological Bulletin, 136(3), 422–449. https://doi.org/10.1037/a0018947
- Inkinen, M., Lonka, K., Hakkarainen, K., Muukkonen, H., Litmanen, T., & Salmela-Aro, K. (2014). The interface between core affects and the challenge-skill relationship. Journal of Happiness Studies, 15(4), 891–913. https://doi.org/10.1007/s10902-013-9455-6
- Järvelä, S., Malmberg, J., Haataja, E., Sobocinski, M., & Kirschner, P. A. (2019). What multimodal data can tell us about the students’ regulation of their learning process? Learning and Instruction, 101203. https://doi.org/10.1016/j.learninstruc.2019.04.004
- Jones, M., Meijen, C., McCarthy, P. J., & Sheffield, D. (2009). A theory of challenge and threat states in athletes. International Review of Sport and Exercise Psychology, 2(2), 161–180. https://doi.org/10.1080/17509840902829331
- Keeley, J., Zayac, R., & Correia, C. (2008). Curvilinear relationships between statistics anxiety and performance among undergraduate students: Evidence for optimal anxiety. Statistics Education Research Journal, 7, 4–15.
- Koole, S. L., Jostmann, N. B., & Baumann, N. (2012). Do demanding conditions help or hurt self‐regulation? Social and Personality Psychology Compass, 6(4), 328–346. https://doi.org/10.1111/j.1751-9004.2012.00425.x
- Kreibig, S. D. (2010). Autonomic nervous system activity in emotion: A review. Biological Psychology, 84(3), 394–421. https://doi.org/10.1016/j.biopsycho.2010.03.010
- Law, W., Elliot, A. J., & Murayama, K. (2012). Perceived competence moderates the relation between performance-approach and performance-avoidance goals. Journal of Educational Psychology, 104(3), 806–819. https://doi.org/10.1037/a0027179
- Lazarus, R. S., & Folkman, S. (1984). Stress, appraisal, and coping. Springer.
- Ledalab (2019). Ledalab software (Version 3.4.9). Ledalab. http://www.ledalab.de/
- Liem, G. A., & Martin, A. J. (2012). The motivation and engagement scale: Theoretical framework, psychometric properties, and applied yields. Australian Psychologist, 47(1), 3–13. https://doi.org/10.1111/j.1742-9544.2011.00049.x
- Lubke, G., & Neale, M. C. (2006). Distinguishing between latent classes and continuous factors: Resolution by maximum likelihood? Multivariate Behavioral Research, 41(4), 499–532. https://doi.org/10.1207/s15327906mbr4104_4
- Malmberg, L.-E., & Little, T. D. (2007). Profiles of ability, effort, and difficulty: Relationships with worldviews, motivation and adjustment. Learning and Instruction, 17(6), 739–754. https://doi.org/10.1016/j.learninstruc.2007.09.014
- Man, V., Nohlen, H., Melo, H. U., & Cunningham, W. A. (2017). Hierarchical brain systems support multiple representations of valence and mixed affect. Emotion Review, 9(2), 124–132. https://doi.org/10.1177/1754073916667237
- Marsh, H. W., Lüdtke, O., Trautwein, U., & Morin, A. J. S. (2009). Classical latent profile analysis of academic self-concept dimensions: Synergy of person- and variable-centered approaches to theoretical models of self-concept. Structural Equation Modeling: A Multidisciplinary Journal, 16(2), 191–225. https://doi.org/10.1080/10705510902751010
- Martin, A. J. (2015). The motivation and engagement scale - high school. Lifelong Achievement Group (www.lifelongachievement.com).
- Martin, A. J., & Jackson, S. A. (2008). Brief approaches to assessing task absorption and enhanced subjective experience: Examining ‘Short’ and ‘Core’ flow in diverse performance domains. Motivation and Emotion, 32(3), 141–157. https://doi.org/10.1007/s11031-008-9094-0
- Martin, A.J., Malmberg, L.-E., Kennett, R., Mansour, M., Papworth, B., & Pearson, J. (2019). What happens when students reflect on their self-efficacy during a test? Exploring test experience and test outcome in science. Learning and Individual Differences, 73, 59–66. https://doi.org/10.1016/j.lindif.2019.05.005
- Martin, A. J., & Marsh, H. W. (2003). Fear of failure: Friend or foe? Australian Psychologist, 38(1), 31–38. https://doi.org/10.1080/00050060310001706997
- Martin, R., Urbach, D., Hudson, R., & Zoumboulis, S. (2009). Progressive achievement tests in science. Australian Council of Educational Research.
- Masters, G. (2009). PAT Science: Getting good assessment down pat. Teacher, 2009. https://research.acer.edu.au/teacher/vol2009/iss206/11/
- Meijen, C., Turner, M., Jones, M. V., Sheffield, D., & McCarthy, P. (2020). A theory of challenge and threat states in athletes: A revised conceptualization. Frontiers in Psychology, 11, 126. https://doi.org/10.3389/fpsyg.2020.00126
- Muthén, L. K., & Muthén, B. (2014). Mplus user’s guide (version 7.20). Muthén & Muthén.
- Namkung, J. M., Peng, P., & Lin, X. (2019). The relation between mathematics anxiety and mathematics performance among school-aged students: A meta-analysis. Review of Educational Research, 89(3), 459–496. https://doi.org/10.3102/0034654319843494
- Neil, A. L., & Christensen, H. (2009). Efficacy and effectiveness of school-based prevention and early intervention programs for anxiety. Clinical Psychology Review, 29(3), 208–215. https://doi.org/10.1016/j.cpr.2009.01.002
- Nicholson, L. J., Putwain, D. W., Nakhla, G., Porter, B., Liversidge, A., & Reece, M. (2019). A person-centered approach to students’ evaluations of perceived fear appeals and their association with engagement. The Journal of Experimental Education, 87(1), 139–160. https://doi.org/10.1080/00220973.2018.1448745
- Oei, N. Y., Everaerd, W. T., Elzinga, B. M., van Well, S., & Bermond, B. (2006). Psychosocial stress impairs working memory at high loads: An association with cortisol levels and memory retrieval. Stress (Amsterdam, Netherlands), 9(3), 133–141. https://doi.org/10.1080/10253890600965773
- Office of the Chief Scientist (2014). Benchmarking Australian science. Australian Government.
- Palmer, T. A., Burke, P. F., & Aubusson, P. (2017). Why school students choose and reject science: A study of the factors that students consider when selecting subjects. International Journal of Science Education, 39(6), 645–662. https://doi.org/10.1080/09500693.2017.1299949
- Pekrun, R. (2006). The control-value theory of achievement emotions: Assumptions, corollaries, and implications for educational research and practice. Educational Psychology Review, 18(4), 315–341. https://doi.org/10.1007/s10648-006-9029-9
- Pijeira-Díaz, H. J., Drachsler, H., Kirschner, P. A., & Järvelä, S. (2018). Profiling sympathetic arousal in a physics course: How active are students? Journal of Computer Assisted Learning, 34(4), 397–408. https://doi.org/10.1111/jcal.12271
- Putwain, D. W., Remedios, R., & Symes, W. (2015). Experiencing fear appeals as a challenge or a threat influences attainment value and academic self-efficacy. Learning and Instruction, 40, 21–28. https://doi.org/10.1016/j.learninstruc.2015.07.007
- Putwain, D. W., & Symes, W. (2014). Subjective value and academic self-efficacy: The appraisal of fear appeals used prior to a high-stakes test as threatening or challenging. Social Psychology of Education, 17(2), 229–248. https://doi.org/10.1007/s11218-014-9249-7
- Putwain, D. W., & Symes, W. (2016). The appraisal of value-promoting messages made prior to a high-stakes mathematics examination: The interaction of message-focus and student characteristics. Social Psychology of Education, 19(2), 325–343. https://doi.org/10.1007/s11218-016-9337-y
- Putwain, D. W., Symes, W., & Wilkinson, H. M. (2017). Fear appeals, engagement, and examination performance: The role of challenge and threat appraisals. The British Journal of Educational Psychology, 87(1), 16–31. https://doi.org/10.1111/bjep.12132
- Rossato, C. J., Uphill, M. A., Swain, J., & Coleman, D. A. (2018). The development and preliminary validation of the Challenge and Threat in Sport (CAT-Sport) Scale. International Journal of Sport and Exercise Psychology, 16(2), 164–177. https://doi.org/10.1080/1612197X.2016.1182571
- Schunk, D. H., & DiBenedetto, M. K. (2014). Academic self-efficacy. In M. J. Furlong, R. Gilman, & E. S. Huebner (Eds.), Handbook of positive psychology in schools (pp. 115–521). Elsevier.
- Schunk, D. H., & Miller, S. D. (2002). Self-efficacy and adolescents’ motivation. In F. Pajares & T. Urdan (Eds.), Academic motivation of adolescents (pp. 29–52). Information Age Publishing.
- Seery, M. D. (2013). The biopsychosocial model of challenge and threat: Using the heart to measure the mind. Social and Personality Psychology Compass, 7(9), 637–653. https://doi.org/10.1111/spc3.12052
- Sharot, T., & Phelps, E. A. (2004). How arousal modulates memory: Disentangling the effects of attention and retention. Cognitive, Affective & Behavioral Neuroscience, 4(3), 294–306. https://doi.org/10.3758/cabn.4.3.294
- Shernoff, D. J., Csikszentmihalyi, M., Shneider, B., & Shernoff, E. S. (2003). Student engagement in high school classrooms from the perspective of flow theory. School Psychology Quarterly, 18(2), 158–176. https://doi.org/10.1521/scpq.18.2.158.21860
- Simonov, P. V. (1991). The motivated brain: A neurophysiological analysis of human behavior (Vol. 4). Taylor & Francis.
- Sirsch, U. (2003). The impending transition from primary to secondary school: Challenge or threat? International Journal of Behavioral Development, 27(5), 385–395. https://doi.org/10.1080/01650250344000082
- Skinner, E. A. (1996). A guide to constructs of control. Journal of Personality and Social Psychology, 71(3), 549–570. https://doi.org/10.1037/0022-3514.71.3.549
- Skinner, E. A., Zimmer-Gembeck, M. J., & Connell, J. P. (1998). Individual differences and the development of perceived control. Monographs of the Society for Research in Child Development, 63(2-3), i–231. https://doi.org/10.2307/1166220
- Tomaka, J., Blascovich, J., Kibler, J., & Ernst, J. M. (1997). Cognitive and physiological antecedents of threat and challenge appraisal. Journal of Personality and Social Psychology, 73(1), 63–72. https://doi.org/10.1037/0022-3514.73.1.63
- Trizano-Hermosilla, I., & Alvarado, J. M. (2016). Best alternatives to Cronbach’s alpha reliability in realistic conditions: Congeneric and asymmetrical measurements. Frontiers in Psychology, 7, 769. https://doi.org/10.3389/fpsyg.2016.00769
- Uphill, M. A., Rossato, C., Swain, J., & O’Driscoll, J. M. (2019). Challenge and threat: A critical review of the literature and an alternative conceptualization. Frontiers in Psychology, 10, 1255. https://doi.org/10.3389/fpsyg.2019.01255
- Wigfield, A., & Tonks, S. (2002). Adolescents’ expectancies for success and achievement task values during middle and high school years. In F. Pajares & T. Urdan (Eds.), Academic motivation of adolescents (pp. 58–82). Information Age Publishing.
- Yoshizawa, T., Hirobayashi, S., & Misawa, T. (2011). Noise reduction for periodic signals using high-resolution frequency analysis. EURASIP Journal on Audio, Speech, and Music Processing, 2011, 5. https://doi.org/10.1186/1687-4722-2011-426794
- Yucha, C., & Montgomery, D. (2008). Evidence-based practice in biofeedback and neurofeedback. AAPB.
- Zayas, V., & Shoda, Y. (2015). Love you? Hate you? Maybe it’s both: Evidence that significant others trigger bivalent-priming. Social Psychological and Personality Science, 6(1), 56–64. https://doi.org/10.1177/1948550614541297