
 ?Mathematical formulae have been encoded as MathML and are displayed in this HTML version using MathJax in order to improve their display. Uncheck the box to turn MathJax off. This feature requires Javascript. Click on a formula to zoom.
Abstract
Live probiotics can be supplemented to bread as functional ingredients. The viability of probiotics in bread needs to be sufficient to exert a beneficial effect on human health. To maximize the viability, a kinetic study on the inactivation of probiotics during baking was carried out. The thermal inactivation of Lactobacillus plantarum P8 during bread baking was evaluated with rate-dependent kinetic models. The influences of temperature, moisture content, drying rate, and temperature variation rate on the inactivation kinetics were studied explicitly. A kinetic model , which included temperature (T), moisture content (X), and temperature variation rate (dT/dt) as variables, was found to best describe the concave and sigmoidal survival curves of probiotics in bread crust and in crumb during baking, respectively. The drying rate (dX/dt) was of little influence on the kinetics. The application of the proposed model is limited to baking processes, but could be used to maximize the survival of probiotics in bread products.
1. Introduction
Predictive microbiology describes the response of microorganisms to external conditions via mathematical modeling.[Citation1,Citation2] Living probiotics ingredients may be inactivated during thermal processing of foods due to their high heat sensitivity. Predictive models are of interest to describe inactivation kinetics of probiotics during food processing, which may be subsequently used to address maximum survival of probiotics in food products.[Citation3–5]
Probiotics may be applied to produce functional bakery products.[Citation6] However, inactivation of the probiotics during baking significantly affects the bacterial viability in the bakery products such as bread.[Citation7–10] Baking of bread is a dynamic process, during which the temperature and moisture content of the bread matrix change continuously.[Citation11] In a previous experimental study, we found that the thermal inactivation of probiotic bacteria in the bread crust and crumb is affected by the distinct temperature-moisture content histories in these two domains within the bread during baking.[Citation12] However, the underlying mechanism is not well-understood. We can deepen the understanding of the inactivation mechnisms of probiotics during baking via kinetic modeling.
Kinetic models can increase in complexity according to the following three different levels: i) a kinetic model that simply describes the inactivation percentage as function of time (e.g., by first-order kinetics); ii) a kinetic model that includes the effect of an environmental factor (e.g., temperature, pH or moisture content) toward stability of the microorganism (e.g., Arrhenius-type); and iii) a kinetic model that includes the two previous levels to predict the microbial responses to the changing conditions, e.g., the temperature or moisture gradient during processing.[Citation13,Citation14] Traditionally, kinetic models that have complexity up to level 2 are derived from isothermal experiments in model systems.[Citation15] Predictions of such kinetic models are often not in full agreement with inactivation data collected from dynamic processes. This is because rapid changing conditions during dynamic processes can dramatically alter the inactivation mechanism, and thus potentially lead to a disagreement between the experimental inactivation data and the predictions.[Citation14]
provides an overview of several studies that involved the kinetic modeling of inactivation of microorganisms during drying, a process that may be considered similar to baking to certain extent. Main external factors considered in these studies are the temperature and the moisture content (or water activity).[Citation16–20,Citation26] Interestingly, only few studies incorporated the influence of the drying rate and/or the change in temperature to predict the inactivation kinetics of microorganisms.[Citation19,Citation21–24,Citation27,Citation28] To the best of our knowledge, no previous work exists in the literature that deals with modeling of the influences of temperature, moisture content and their changes in time on inactivation kinetics of probiotics in the typical temperature range of baking processes. This is, however, of particular interest when the baking conditions need to be optimized to maximize viability of probiotics in final bread products.
Table 1. List of some studies on kinetic modeling of the inactivation of micro-organisms during dynamic drying processes.
Therefore, this study aims at providing a deeper understanding of the inactivation mechanism of probiotics during bread baking through kinetic modeling. We evaluated the feasibility of rate-dependent kinetic models to describe the inactivation of Lactobacillus plantarum P8 during bread baking as a function of several external factors (i.e., temperature, moisture content, drying rate, and temperature variation rate). The model parameters are optimized using inactivation data of bacteria derived from real baking experiments of bread instead of from model systems, to increase the accuracy of model predictions. The obtained parameters are subsequently validated against inactivation data of bacteria in bread crust or crumb during baking generated from independent baking experiments.
2. Rate-dependent models
The inactivation of microbial cells by thermal processing is frequently described by first order kinetics (EquationEquations (1)(1)
(1) and Equation(2)
(2)
(2) ):
(1)
(1)
or in an integrated form over a small discrete time interval Δt:
(2)
(2)
where N is the viable cell counts (CFU/mL, CFU: colony forming unit) at time t (s), N0 is the initial viable cell counts (CFU/mL), and kd is the inactivation rate constant (s−1).
Generally, the rate of the thermal inactivation of bacteria increases with increasing temperature and decreases with reduced moisture content of the material.[Citation17,Citation29] However, the effect of the drying rate on the survival of microorganisms during drying processes remains unclear. Different studies report that a high drying rate has a positive, negative or no influence on the survival of microorganisms during drying.[Citation17,Citation21,Citation22,Citation30]
In previous studies, drying and temperature-rate dependent models were successfully applied to describe the survival data of different microorganisms (Bifidobacterium infantis Bb1, Streptococcus thermophilus St10, and Saccharomyces cerevisiae ATCC 2601) during drying.[Citation23,Citation24] An extensive theoretical appraisal of rate-dependent models can be found in the paper by Chen and Patel.[Citation30]
In previously described rate-dependent models, the inactivation rate constant kd is made dependent on the temperature (T), moisture content (X), drying rate (dX/dt), and the change of temperature in time (dT/dt). The latter two variables may be considered as “dehydration stress” and “thermal stress” experienced by the microorganisms during the process, respectively. The effect of these variables is described by the modification of the classical Arrhenius equation. However, different variations may be proposed for the rate-dependent correlations ( and upplementary material Table A1). In these models, k0 is a pre-exponential factor (s−1), Ed is the activation energy (J·mol−1), and R is the ideal gas constant (8.314 J·mol−1·K−1).
Table 2. Rate-dependent models tested in this study to describe the inactivation rate constant kd of Lactobacillus plantarum P8 inactivation during bread baking.
The performance of different kinetic models in describing survival can be evaluated in different ways, for example, with the parameters mean square error (MSE, EquationEquation (3)(3)
(3) ) and the corrected Akaike information criterion (AICc, EquationEquation (4)
(4)
(4) ).[Citation31] The advantage of the AICc is that both the number of parameters of the model and the goodness of fit are included in this parameter.[Citation32]
(3)
(3)
(4)
(4)
where n is the number of observations, p is the number of optimized parameters, and RSS is the residual sum of squares. To compare multiple models, the models with smaller MSE and AICc values are preferred.
3. Materials and methods
3.1. Experimental inactivation data
Experimental inactivation data used in this study were derived from our previous study on the thermal inactivation of Lactobacillus plantarum P8 (ATCC 14917, Inner Mongolia Agricultural University) in bread during baking at different conditions. Detailed description of the experimental procedures can be found in Zhang et al.[Citation12] In brief, Lactobacillus plantarum P8 was cultured and supplemented to bread. Bread samples with varying dough weight (5, 30, and 60 g) were baked at different temperatures (175, 205, and 235 °C) for 8 min, and the residual viability of bacteria was determined every 2 min. The temperature and moisture content profiles of the bread crust and crumb were recorded. The corresponding diameter of the maximum cross sectional area of the bread was 2 cm, 6 cm, and 8 cm for 5 g, 30 g and 60 g dough, respectively.
3.2. Generation of a new dataset for model validation
To validate the rate-dependent model, new experimental datasets were generated in this study. Bread samples with an initial weight of 0.1 g were prepared, for which the experimental procedures are described in the next sections.
3.2.1. Bacterial culture
A single colony of L. plantarum was inoculated in 10 mL sterile MRS broth (OXOID, United Kingdom) from a MRS agar plate stored at 4 °C. After 12-h incubation at 37 °C, 1% v/v inoculum of L. plantarum was sub-cultured in 100 mL MRS broth for 24 h. Subsequently, the cell pellets were harvested by centrifugation (8000 g, 4 °C, 15 min) (Thermo Fisher Scientific, USA) and were re-suspended in UHT skim milk.
3.2.2. Bread baking experiment
Bread samples supplemented with L. plantarum were prepared according to Zhang et al.[Citation12] Miniature bread dough (0.1 g) with L. plantarum was baked at 145, 175, and 205 °C for 5 min in an electric oven (Changdi®, China). Type-K thermocouples (Omega®, USA) were used to monitor the temperature change inside the mini-bread with a sampling interval of 10 s. Only the average temperature and the average moisture content were measured because of the small dimensions (0.1 g) of the bread samples (the diameter of the dough ball was 0.5 cm). The moisture content of the mini-bread was determined every 1 min: the moisture content of the sample (kg/kg) was calculated by weighing the sample before and after drying at 105○C in an oven for 24 h.
3.2.3. Microbiological analysis
The residual viabilities of L. plantarum in 0.1 g dough/bread were determined every 1 min during baking. Briefly, the 0.1 g dough/bread was crushed into pieces and transferred into a 2 mL centrifuge tube. Subsequently, 0.90 mL peptone water (0.1% w/v, Solarbio®, China) was added and the suspension was vigorously homogenized using a vortex mixer (IKA®, Germany). Serial dilutions of the obtained suspension were made in peptone water and plated following the surface technique onto MRS agar (OXOID, United Kingdom) supplemented with natamycin (200 ppm, Antai®, China).[Citation7] The plates were incubated at 37 °C for 48 h. The residual bacterial viability was recorded as log(N/N0), with N the viable count value after baking, CFU/g, and N0 the initial viable count, CFU/g. The initial viable count was 8.8 ± 0.1 log CFU/g for the 5 g, 30 g, and 60 g dough, and 9.9 ± 0.5 log CFU/g for the 0.1 g dough. The moisture content of dough was 0.41 kg/kg on a wet basis.
3.3. Modeling procedures
The parameters of the models were estimated based on the data set for the 30 g bread, and the models with the best fit were subsequently validated against the data for 0.1 g, 5 g, and 60 g bread. The survival data of the bacteria in the crust of 30 g breads during baking at each temperature were plotted against baking time (8 min) on semi-logarithmic coordinates. To improve the accuracy of the parameter estimation, the inactivation data log(N/N0) in 30 g breads were first correlated with the baking time[Citation25,Citation26] (EquationEquation (5)(5)
(5) ). This procedure enabled us to generate a more comprehensive set of experimental inactivation data (48 points in total) for each survival curve ().
(5)
(5)
where K (s−m) and m were two empirical parameters of this exponential equation. The values of K were 0.02, 0.07, and 0.15 for baking temperatures of 175, 205, and 235 °C, respectively, while the corresponding values of m were 1.00, 0.82, and 0.71, with a coefficient of determination (R2) above 0.98.
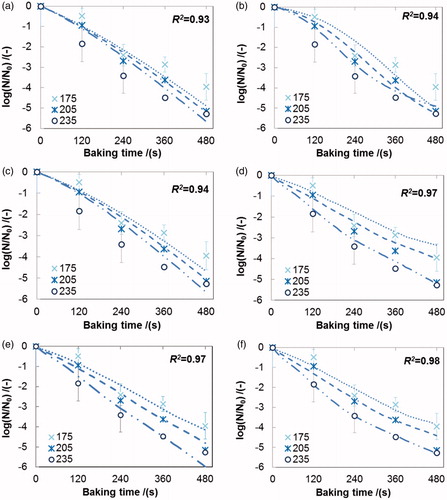
Figure 1. Experimental and simulated inactivation data of L. plantarum in the crust of 30 g bread during baking at different temperatures (experimental data: ×, 175 °C; *, 205 °C, ○, 235 °C; simulated data: ······, 175 °C; - - -, 205 °C; – ·· –, 235 °C), Simulated survival curves fitted with different rate-dependent models: (a) ∼ (f) for model No. 1 ∼ 6 in (R2, square of correlation coefficient). Error bars indicate the standard deviation of the experimental data.
More data were generated on the moisture content history during baking (supplementary material Figure A1), according to the Page’s model (EquationEquation (6)(6)
(6) ) which is used to simulate the drying curves of food materials.[Citation33]
(6)
(6)
where W, We, W0 are the average, equilibrium and initial moisture contents (kg/kg), respectively, and k and n empirical constants (s−n and dimensionless). Therefore, absolute values of dX/dt were calculated using the data generated by the Page’s model. Supplementary material Figure A1 shows the variables (T, X,
and
of the rate-dependent kinetic models, which were plotted against the baking time for every interval of 10 s. The moisture removal rates were non-zero for 5 g, 30 g, and 60 g bread at the end of baking, which indicates that the equilibrium moisture content was not achieved.
Subsequently, the unknown coefficients in the inactivation kinetic models were estimated using the non-linear least square minimization method solved using the add-in solver in Excel 2010 (Microsoft®, USA) based on the data set of 30 g bread. The coefficient of determination (R2) was calculated using the RSQ function in Excel 2010 (Microsoft®, USA). The goodness of fitting was evaluated by comparing the MSE and AICc of each model (EquationEquations (3)(3)
(3) and Equation(4)
(4)
(4) ) as mentioned before. The best-fit model was used to predict the survival data of L. plantarum in 0.1 g, 5 g and 60 g bread during baking, in combination with the drying kinetics for each baking condition.
3.4. Statistical analysis
All experiments were conducted at least in duplicate and results were presented as mean ± standard deviations. The residual viability of bacteria during baking at different temperatures was analyzed by two-factor analysis of variance (ANOVA) with replication with a significance level of P < 0.05. The ANOVA analysis was performed using Excel 2010 (Microsoft®, USA).
4. Results and discussion
4.1. Development of a rate-dependent model to describe survival in the crust
In this study, we investigate the influence of the drying rate and/or temperature variation rate on the inactivation of probiotic bacteria during baking, in addition to other factors (i.e., temperature and moisture content). However, the moisture content in the bread crumb stayed almost constant throughout baking (i.e., dX/dt = 0),[Citation12] which makes it unrealistic to evaluate the influence of the drying rate in the crumb on the bacterial inactivation kinetics in the crumb. Therefore, it is more rational to evaluate first the rate-dependent models using the inactivation data of bacteria in the bread crust, where the temperature and moisture content changed dynamically during baking, as well as the drying rate and temperature variation rate. In section 4.4 the two most promising developed rate-dependent models on the basis of crust data were evaluated for prediction of inactivation in the crumb as well.
shows the residual viability of L. plantarum in the crust of 30 g bread against the baking time on semi-logarithmic coordinates. The dependency of the inactivation data of L. plantarum on the baking temperature (175, 205, and 235°C) was significant (P < 0.01). The survival curves were slightly concave especially for the baking temperature of 235 °C.
First, the classical Arrhenius model (model No.1, ) was evaluated to describe the experimental inactivation data, which just considered the temperature-dependence of the inactivation rate. The fit is unsatisfactory: a large discrepancy remains between the measured residual viability and the predictions (). The estimated activation energy (Ed) for the Arrhenius model is low (), which implies that the influence of temperature on the inactivation process is relatively small (model No.1, ), which explains the overlap of the different survival curves in .
Table 3. Optimal parameters of the rate-dependent models based on the inactivation data of Lactobacillus plantarum P8 in the crust of 30 g bread.
Subsequently, the moisture content (X) was incorporated in the next kinetic model (model No.2, )[Citation34]: the moisture content of the food matrix has a profound effect on the thermal inactivation rate of bacteria when the moisture content changes strongly, e.g. during drying[Citation4]. Visually, the fitting results slightly improved (), even though the mean square error (MSE, ) in fact increased somewhat.
Then, two rate-dependent models (models No. 3 & 4, ) were used to describe the inactivation kinetics, which include the effect of the dynamics of the process on the inactivation as shown in .[Citation25,Citation26] Model No. 3 includes the drying rate or moisture removal rate (dX/dt).[Citation29] The model No. 3 describes the inactivation of bacteria during drying of milk droplets reasonably well,[Citation26] but it fails to describe the bacterial inactivation in our case (): its fit was even worse than the Arrhenius equation (larger values of MSE and AICc, ).
The fit was dramatically improved by incorporating the changing rate of temperature (dT/dt) into the rate-dependent model No. 4 ( & ). A similar effect was observed in a study on infrared drying of yeast, where incorporation of both dX/dt and dT/dt also resulted in the best fit model.[Citation25] However, this was not seen in the study of single droplet drying.[Citation26] This indicates that the temperature variation rate (dT/dt) may have different degrees of impact on the inactivation kinetics during different drying methods (i.e., convective drying, infrared drying, baking). There is no apparent delay in the temperature increase inside the matrix during bread baking (crust) and during infrared drying of yeast (supplementary material Figure A1), whereas the temperature inside the single droplet remains almost constant for some time in the beginning of the drying process (i.e., dT/dt ≈ 0). This may influence the inactivation of the bacteria during different drying processes.
It is worth noting that the value of coefficient a in model No. 4 was small (), suggesting that the drying rate (dX/dt) may have little influence on the inactivation rate kd. Therefore, we evaluated model No. 5 (see ) in which the term dX/dt was eliminated from the pre-exponential factor. As shown in , this simplified model describes the inactivation kinetics of L. plantarum in the crust during baking reasonably well; the corresponding MSE and AICc values were even smaller than those of model No. 4. However, model No. 5 was not able to predict the noticeable convexity of the inactivation curve at a baking temperature of 235 °C.
Finally, a new variety of the rate-dependent model was developed by introducing the variable moisture content (X) into the exponential term (model No. 6, ), similar as for model No. 2. This new expression requires the temperature (T), the moisture content (X), and the temperature change rate (dT/dt) as input variables. The calculated inactivation curves were in good agreement with the experimental data (), while the MSE and AICc were the smallest among all evaluated models (). The estimated activation energy (Ed) was smaller (13.92 kJ·mol−1) than that found in other studies,[Citation16,Citation19,Citation24–26] which is probably due to the different food matrices used during drying.[Citation35]
In addition to the six models discussed, other expressions of the rate-dependent models were evaluated (see supplementary material Table A1), but no significant improvement was found in terms of the goodness of fit (results not shown). Therefore, we do not elaborate on those expressions.
4.2. Validation of the rate-dependent model
Models No. 4 & 6 in provided the best fit to the experimental data, by comparing the values of MSE and AICc () and by judging their visual fit (i.e., the convexity of the simulated survival curves, ). Therefore, these two rate-dependent kinetic models were validated against newly generated experimental results. Specifically, the temperature and moisture content profiles as well as the viability of L. plantarum were determined during 5-min baking of 0.1 g bread at 145 °C and 175 °C, and during 8-min baking of 5 g or 60 g bread at 175 °C, 205 °C and 235 °C, respectively.
The temperature-moisture trajectories in the crust of the 5 g and 60 g breads showed a similar trend as for the 30 g samples (see supplementary material Appendix, Figure A1(a)–(d)), which we interpreted in detail in our previous paper.[Citation12] In contrast, the core temperature of the 0.1 g sample increased rapidly to a plateau of 100 °C (i.e., dT/dt ≈ 0) after baking for 120 s at 145 °C and after 60 s at 175 °C, respectively. This plateau is explained by the evaporation-condensation mechanism, which keeps the temperature at a constant value within the dough.[Citation36] The temperature increased again after baking for 180 s at 175 °C, indicating internal transfer limitation or even depletion of moisture.[Citation37] The change of moisture content (X) in 0.1 g samples was precisely described by the Page’s model (EquationEquation (6)(6)
(6) ), and the drying rate (dX/dt) clearly increased with increasing baking temperature during the first 180 s of baking (supplementary material Figure A1(b)).
The bacterial viability of L. plantarum in the crust decreased substantially from the initial viable counts of 9 to 10 log CFU/g down to 5 to 6 log CFU/g for all breads. The survival curves of L. plantarum in the crust of 5 g and 60 g breads exhibited a similar trend as for the 30 g bread (), whereas a noticeable “tail” was observed for the 0.1 g samples (). The survival curves of L. plantarum in the 0.1 g, 5 g, and 60 g samples during baking were predicted using the rate-dependent models (models No. 4 & 6), by using the parameters derived from the 30 g dataset () and the measured temperature (T), moisture content (X), drying rate (dX/dt) and temperature variation rate (dT/dt) as input variables (supplementary material Figure A1).
Figure 2. Validation of the rate-dependent model No. 4 in using different inactivation datasets (a: 0.1 g; b: 5 g; c: 60 g) and a parity plot of the experimental and the simulated values of the residual viability of L. plantarum in the crust during baking (d: ▲30 g, Δ 0.1 g, □ 5 g, ◊ 60 g). Lines represent predicted survival curves calculated using parameters derived from 30 g dataset; Error bars indicate the standard deviation of the experimental data, R2 the square of correlation coefficient.
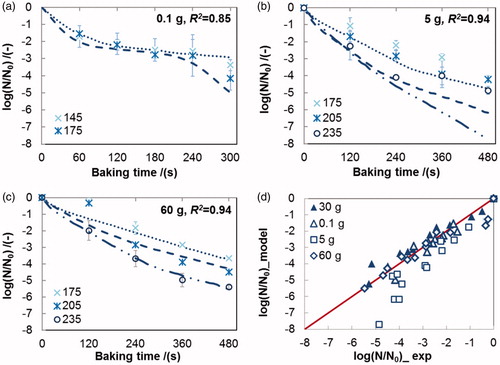
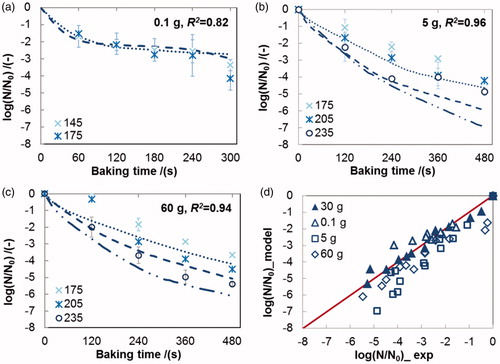
Generally, the rate-dependent models predicted the survival curves of bacteria in 0.1 g and 60 g bread samples reasonably well, especially the “long tail” for 0.1 g samples ( and ). However, the inactivation of L. plantarum in the crust of 5 g breads was overestimated by the kinetic models ( and ), which could be caused by the high heating rate (dT/dt, supplementary material Figure A1(c)) in this group of breads. A smaller discrepancy between the predicted and observed data was found when model No. 6 was used ( and ).
Figure 3. Validation of the rate-dependent model No. 6 in using different inactivation datasets (a: 0.1 g; b: 5 g; c: 60 g) and a parity plot of the experimental and the simulated values of the residual viability of L. plantarum in the crust during baking (d: ▲30 g, Δ 0.1 g, □ 5 g, ◊ 60 g). Lines represent predicted survival curves calculated using parameters derived from 30 g dataset; Error bars indicate the standard deviation of the experimental data, R2 the square of correlation coefficient.
4.3. Mechanistic interpretation of the rate-dependent model
The results discussed above suggest that the rate-dependent model No.6 best describes the inactivation kinetics of L. plantarum in bread crust during baking. In model No.6, the temperature variation rate (dT/dt), the reached moisture content (X), and the temperature (T) of the food matrix were identified as the main input variables to describe the bacterial inactivation during baking.
The exponential term of the rate-dependent model No. 6, i.e., or
, may describe the opposite influence of increasing temperature (T) and decreasing moisture content (X) on the inactivation rate.[Citation28] Specifically, during baking, the increasing temperature has a negative influence on the survival of bacteria (if T ↑, then kd ↑), while the concurrently decreasing moisture content has a positive influence (if X ↓, then kd ↓). The thermo-tolerance of bacteria is thus higher at low moisture contents than it is at high moisture contents.[Citation38] In other words, the bacteria will be more heat-resistant once a lower moisture content is reached during drying.[Citation23,Citation39] This explains the slowing decrease in the residual viability of L. plantarum in 0.1 g bread (the “tailing effect”) in the later stages of baking when the moisture content becomes very low ( and supplementary material Figure A1(b)). At low moisture contents the bacteria will become vitrified in the glassy crust matrix. Formation of a glassy matrix leads to a significant arrest of translational molecular motion and chemical reactions. Configuration of crucial macromolecules inside bacterial cells change very slowly in a glassy state, which contributes to reduction of the inactivation rate of bacteria. Thus, bacteria cells embedded in the glassy crust may be better protected against thermal damage during baking.[Citation29,Citation40,Citation41]
The pre-exponential term of the rate-dependent model describes the negative effect of the higher temperature variation rate on the heat resistance of bacteria (if dT/dt ↑, then kd ↑). However, the term drying rate (dX/dt) is not present in model No. 6, which indicates that the inactivation induced by heat stress (dT/dt) is dominant over that of the stress due to dehydration. The latter may be significant during mild drying processes.[Citation23,Citation26] but may be neglected when the dehydration takes place at much higher temperatures (i.e., the case of bread baking). This may be related to different inactivation mechanisms at different temperatures: dehydration inactivation is dominant at lower temperature (< 45 °C), while thermal inactivation becomes more prominent at higher temperature.[Citation4,Citation42] We conclude that the temperature variation rate must be considered as one of the prime extrinsic factors that influence the bacterial inactivation kinetics during severe thermal drying processes such as baking.
4.4. Prediction of the inactivation in bread crumb
During bread baking, the moisture content of the crumb was not affected (X ≈ 0.41, dX/dt ≈ 0) and the temperature in the crumb follows a sigmoidal pattern (supplementary material Figure A2),[Citation36] which is distinct from the temperature profile and the moisture content history in the crust (supplementary material Figure A1). The inactivation data of L. plantarum in bread crumb were predicted using the rate-dependent models (models No. 4 & 6) with the same parameters in found for the crust of 30 g bread (X was set to 0.41, dX/dt was set to 0).
As shown in , the two rate-dependent models can predict the sigmoidal trend of the inactivation curves (with a “shoulder” and a “tail”) of L. plantarum in the crumb during baking. The “shoulder” is explained by the limited thermal inactivation in the initial stage of baking because both the temperature and the changing-rate of temperature remained relatively low (supplementary material Figure A2). We attribute the “tail” to the reasons mentioned before in section 4.3. Visual inspection shows the predicted trend of model No. 6 to be more realistic ().
Figure 4. Experimental and simulated inactivation data of L. plantarum in the crumb of bread during baking at different temperatures (experimental data: □, 175 °C; ◊, 205 °C, Δ, 235 °C; simulated data: ······, 175 °C; - - -, 205 °C; – ·· –, 235 °C), Simulated survival curves fitted with different rate-dependent models: (a) ∼ (c) for model No. 4 and (d) ∼ (f) for model No. 6 in (R2, square of correlation coefficient). Error bars indicate the standard deviation of the experimental data.
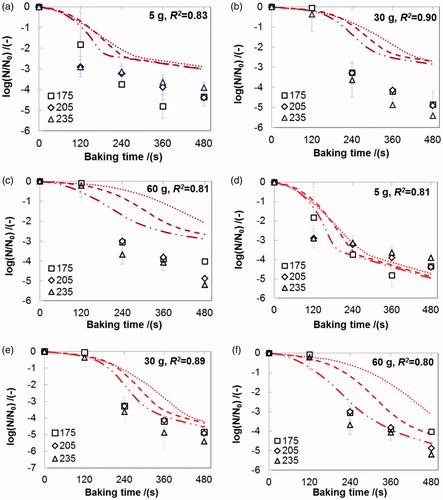
The inactivation of L. plantarum in the crumb of 30 g and 60 g bread was systematically underestimated by the rate-dependent model (,f)). This might have two reasons. First, the experimental inactivation curves of bacteria in crumb during baking at three temperatures were not significantly different (ANOVA, P > 0.05) (). Conversely, the temperature and its changing-rate in crumb of 30 g and 60 g bread were notably different at the three baking temperatures (supplementary material Figure A2(b,c)), which are two crucial variables (T and dT/dt) in the rate-dependent model (model No. 6) as the X was set to a constant. This may then in turn cause the inconsistency between the predicted and the observed inactivation data. We suggest that besides temperature and moisture content, also other environmental factors that are not included in this model (e.g., salt concentration, microstructure) and that are different in the crumb compared to the crust, may affect the inactivation of L. plantarum in the crumb.[Citation43]
Second, the discrepancy could be caused by our assumption that the recorded temperature in the core zone of the bread is the average temperature of the crumb. In reality, the actual average temperature in the crumb (especially during the initial heating up phase) may well be higher than the value in the middle, due to a temperature gradient inside the bread matrix.[Citation36] Therefore, the accuracy of the prediction may be improved by considering the spatial temperature distribution inside the crumb.
4.5. Limitations to the application of the rate-dependent kinetic model
The parameters of the rate-dependent kinetic models were estimated from experimental baking data within a specific range of moisture contents (between 0.20 and 0.40) and temperatures (25–110 °C). Therefore, application of the kinetic models to other processes than baking is not valid, especially if moisture contents or temperatures are outside the considered ranges. An alternative kinetic model development strategy could be to use experimental data from isothermal heating experiments with especially larger variations in moisture content. However, such a strategy may not provide a more accurate prediction of the inactivation during baking, because it is difficult to assess the influence of parameters other than temperature and moisture content (e.g., evolution of bread microstructure, changes of rheological properties of the dough, or certain stresses) on the inactivation kinetics in isothermal experiments.
5. Conclusions
The thermal inactivation of L. plantarum supplemented into bread before baking was investigated via kinetic modeling. The (semi-)empirical rate-dependent kinetic model proposed in this study describes the effects of the temperature (T), the temperature variation rate (dT/dt), and the moisture content (X) in the matrix on the survival rate of probiotics during baking. Reasonable agreement was found between the experimental and predicted inactivation data of L. plantarum in the crumb of 5 g bread and in the crust of other bread samples. A limitation of the presented rate-dependent kinetic model is that it is only applicable to describe survival during bread baking.
The predicted bacterial inactivation during thermal processing may be further improved by collecting more accurate data on the spatial distribution of temperature and water inside the food matrix and/or other factors that can affect the inactivation kinetics (e.g., salt concentration & microstructure). This will support development of more reliable kinetic models that describe inactivation of bacteria. In addition, optimization of the bread recipe and the baking conditions should contribute to further increase in the survival rate of probiotics after processing, without altering the organoleptic properties of the products. This leaves room for further study.
| Notation | ||
| a | = | parameter of the rate-dependent modelFootnote* |
| aw | = | water activity (−) |
| b | = | parameter of the rate-dependent model or the Bigelow model (K−1) |
| C | = | coefficient of surface response kinetic model (−) |
| Ed | = | activation energy for deactivating cells (J·mol−1) |
| k0 | = | a pre-exponential factor (−) |
| kd | = | rate constant of cell deactivation (s−1) |
| K | = | empirical parameter of an exponential equation (s−m) |
| m | = | empirical parameter of an exponential equation (−) |
| n | = | number of data points for non-linear regression (−) |
| N | = | viable counts (CFU/g) |
| p | = | moisture content dependency of parameter α for thermal inactivation or the number of optimized parameters (−) |
| R | = | ideal gas constant (8.314 J·mol−1·K−1) |
| R2 | = | square of the correlation coefficient (−) |
| T | = | Temperature (K) |
| t | = | Time (s) |
| W | = | weight (kg) |
| X | = | moisture content (kg/kg) |
| dt | = | a short sampling time interval (10 s) |
| dT/dt | = | changing rate of temperature (K·s−1) |
| dX/dt | = | drying rate (K·s−1) |
| Greek letters | ||
| α | = | scale parameter of Weibull distribution (s) |
| β | = | shape parameter of Weibull distribution (−) |
| Subscripts | ||
| e | = | equilibrium |
| ref | = | reference |
| s | = | solid |
| w | = | water |
| 0 | = | initial |
| exp | = | experimental inactivation data |
| model | = | simulated inactivation data |
| Abbreviations | ||
| AICc | = | Akaike information criterion |
| MSE | = | mean square error |
| RSS: | = | residual sum of squares |
Supplemental Material
Download Zip (1,009.5 KB)Acknowledgements
The authors thank Professor Heping Zhang from Inner Mongolia Agriculture University for kindly providing the bacteria strain. Financial supports from the Natural Science Foundation of China (Grant No. 21676172) and from the National Key Research and Development Program of China (Project No. 2016YFE0101200), International S&T Cooperation Program, ISTCP) are gratefully acknowledged. The first author also likes to thank the Sandwich PhD program between Wageningen University and Soochow University.
Disclosure statement
The authors have declared no conflict of interest.
Notes
*The unit of a depends on the expression of the rate-dependent models (Table 2).
Related Research Data
References
- Whiting, R. C. Microbial Modeling in Foods. Crit. Rev. Food Sci. Nutr. 1995, 35, 467–494. DOI:10.1080/10408690290825493.
- McMeekin, T.; Bowman, J.; McQuestin, O.; Mellefont, L.; Ross, T.; Tamplin, M. The Future of Predictive Microbiology: Strategic Research, Innovative Applications and Great Expectations. Int. J. Food Microbiol. 2008, 128, 2–9. DOI:10.1016/j.ijfoodmicro.2008.06.026.
- Peleg, M.; Cole, M. B. Reinterpretation of Microbial Survival curves. Crit. Rev. Food Sci. Nutr. 1998, 38, 353–380. DOI:10.1080/10408699891274246.
- Fu, N.; Chen, X. D. Towards a Maximal Cell Survival in Convective Thermal Drying Processes. Food Res. Int. 2011, 44, 1127–1149. DOI:10.1016/j.foodres.2011.03.053.
- Perdana, J.; Zubia, A. A.; Kutahya, O.; Schutyser, M.; Fox, M. Spray Drying of Lactobacillus Plantarum WCFS1 Guided by Predictive Modeling. Drying Technol. 2015, 33, 1789–1797. DOI:10.1080/07373937.2015.1026975.
- Majeed, M.; Majeed, S.; Nagabhushanam, K.; Natarajan, S.; Sivakumar, A.; Ali, F. Evaluation of the Stability of Bacillus Coagulans MTCC 5856 During Processing and Storage of Functional Foods. Int. J. Food Sci. Technol. 2016, 51, 894–901. DOI:10.1111/ijfs.13044.
- Zhang, L.; Huang, S.; Ananingsih, V. K.; Zhou, W.; Chen, X. D. A Study on Bifidobacterium Lactis Bb12 Viability in Bread During Baking. J. Food Eng. 2014, 122, 33–37. DOI:10.1016/j.jfoodeng.2013.08.029.
- Seyedain-Ardabili, M.; Sharifan, A.; Tarzi, B. G. The Production of Synbiotic Bread by Microencapsulation. Food Technol. Biotechnol. 2016, 54, 52–59. DOI:10.17113/ftb.54.01.16.4234.
- Altamirano-Fortoul, R.; Moreno-Terrazas, R.; Quezada-Gallo, A.; Rosell, C. M. Viability of some Probiotic Coatings in Bread and its Effect on the Crust Mechanical Properties. Food Hydrocoll. 2012, 29, 166–174. DOI:10.1016/j.foodhyd.2012.02.015.
- Soukoulis, C.; Yonekura, L.; Gan, H. H.; Behboudi-Jobbehdar, S.; Parmenter, C.; Fisk, I. Probiotic Edible Films as a New Strategy for Developing Functional Bakery Products: The Case of Pan Bread. Food Hydrocoll. 2014, 39, 231–242. DOI:10.1016/j.foodhyd.2014.01.023.
- Zhang, J.; Datta, A. K. Mathematical Modeling of Bread Baking Process. J. Food Eng. 2006, 75, 78–89. DOI:10.1016/j.jfoodeng.2005.03.058.
- Zhang, L.; Taal, M. A.; Boom, R. M.; Chen, X. D.; Schutyser, M. A. I. Effect of Baking Conditions and Storage on the Viability of Lactobacillus Plantarum Supplemented to Bread. LWT Food Sci. Technol. 2018, 87, 318–325. DOI:10.1016/j.lwt.2017.09.005.
- Isabelle, L.; André, L. Quantitative Prediction of Microbial Behaviour During Food Processing Using an Integrated Modelling Approach: A Review. Int. J. Refrig. 2006, 29, 968–984. DOI:10.1016/j.ijrefrig.2006.04.008.
- Pérez-Rodríguez, F.; Valero, A. Predictive Microbiology in Foods. Springer: New York, USA, 2013. DOI:10.1007/978-1-4614-5520-2.
- Chen, X. D.; Patel, K. C. Micro-Organism Inactivation During Drying of Small Droplets or thin-layer slabs - A Critical Review of existing Kinetics Models and an Appraisal of the Drying Rate Dependent Model. J. Food Eng. 2007, 82, 1–10. DOI:10.1016/j.jfoodeng.2006.12.013.
- Fu, N.; Woo, M. W.; Selomulya, C.; Chen, X. D. Inactivation of Lactococcus Lactis Ssp. Cremoris Cells in a Droplet During Convective Drying. Biochem. Eng. J. 2013, 79, 46–56. DOI:10.1016/j.bej.2013.06.015.
- Lievense, L. C.; Verbeek, M. A. M.; Taekema, T.; Meerdink, G.; Riet, K. V. Modelling the Inactivation of Lactobacillus Plantarum During a Drying Process. Chemical Engineering Science 1992, 47, 87–97. DOI:10.1016/0009-2509(92)80203-O.
- Valdramidis, V. P.; Geeraerd, A. H.; Gaze, J. E.; Kondjoyan, A.; Boyd, A. R.; Shaw, H. L.; Impe, J. F. V. Quantitative Description of Listeria Monocytogenes Inactivation Kinetics with Temperature and Water Activity as the Influencing Factors; Model Prediction and Methodological Validation on Dynamic Data. J. Food Eng. 2006, 76, 79–88. DOI:10.1016/j.jfoodeng.2005.05.025.
- Ghandi, A.; Powell, I.; Chen, X. D.; Adhikari, B. Drying Kinetics and Survival Studies of Dairy Fermentation Bacteria in Convective Air Drying Environment using Single Droplet Drying. J. Food Eng. 2012, 110, 405–417. DOI:10.1016/j.jfoodeng.2011.12.031.
- Valero, A.; Cejudo, M.; García-Gimeno, R. M. Inactivation Kinetics for Salmonella Enteritidis in Potato Omelet using Microwave Heating Treatments. Food Control 2014, 43, 175–182. DOI:10.1016/j.foodcont.2014.03.009.
- Tan, D. T.; Poh, P. E.; Chin, S. K. Microorganism Preservation by Convective Air-Drying — A review. Drying Technol. 2018, 36(7), 764–779.
- Bayrock, D.; Ingledew, W. M. Fluidized Bed Drying of Baker’s Yeast: Moisture Levels, Drying Rates, and Viability Changes During Drying. Food Res. Int. 1997, 30, 407–415. DOI:10.1016/S0963-9969(98)00003-9.
- Perdana, J.; Bereschenko, L.; Fox, M. B.; Kuperus, J. H.; Kleerebezem, M.; Boom, R. M.; Schutyser, M. A. I. Dehydration and Thermal Inactivation of Lactobacillus Plantarum WCFS1: Comparing Single Droplet Drying to Spray and Freeze Drying. Food Res. Int. 2013, 54, 1351–1359. DOI:10.1016/j.foodres.2013.09.043.
- Foerst, P.; Kulozik, U. Modelling the Dynamic Inactivation of the Probiotic Bacterium L. Paracasei Ssp. Paracasei During a low-temperature Drying Process based on Stationary Data in Concentrated Systems. Food Bioprocess Technol. 2012, 5, 2419–2427. DOI:10.1007/s11947-011-0560-4.
- Huang, H.; Brooks, M. S.-L.; Huang, H.-J.; Chen, X. D. Inactivation Kinetics of Yeast Cells During Infrared Drying. Drying Technol. 2009, 27, 1060–1068. DOI:10.1080/07373930903218453.
- Li, X.; Lin, S.; Chen, X. D.; Chen, L.; Pearce, D. Inactivation Kinetics of Probiotic Bacteria During the Drying of Single Milk Droplets. Drying Techno. 2006, 24, 695–701. DOI:10.1080/07373930600684890.
- Marechal, P. A.; De, I. M.; Poirier, I.; Gervais, P.; Proce, Â. The Importance of the Kinetics of Application of Physical Stresses on the Viability of Microorganisms: Significance for Minimal Food Processing. Trends Food Sci. Technol. 1999, 10, 15–20.
- Chen, X. D.; Patel, K. C. Biological Changes During Food Dyring Processes. In Drying Technologies in Food Processing; Arun, S. M., Xiao, D. C., Eds.; Blackwell Publishing: UK, 2008; pp 90–112.
- Kuts, P. S.; Tutova, E. G. Fundamentals of Drying of Microbiological Materials. Drying Technol. 1983, 2, 171–201. DOI:10.1080/07373938308959824.
- Majs, v. B.; Zwietering, M. Experimental design, data processing and model fitting in predictive modelling. In Modelling Microorganisms in Food ; Brul, S., van Gerwen, S., Zwietering, M., Eds.; Woodhead Publishing Limited: Cambridge, England, 2007; pp. 22–43. DOI:10.1533/9781845692940.1.22.
- Pérez-Rodríguez, F.; Valero, A. Experimental Design and Data Generation. In Predictive Microbiology in Foods; Richard W. Hartel, Ed.; New York: Springer, 2013; 18.
- Simal, S.; Femenia, A.; Garau, M. C.; Rosselló, C. Use of Exponential, page’s and Diffusional Models to Simulate the Drying Kinetics of Kiwi Fruit. J. Food Eng. 2005, 66, 323–328. DOI:10.1016/j.jfoodeng.2004.03.025.
- Meerdink, G.; van’t Riet, K. Prediction of Product Quality During Spray Drying. Food Bioprod. Process. 1995, 73(4), 165–170. DOI:10.134/J.0960-3085
- Aryani, D. C.; Zwietering, M. H.; den Besten, H. M. The Effect of Different Matrices on the Growth Kinetics and Heat Resistance of Listeria Monocytogenes and Lactobacillus Plantarum. Int. J. Food Microbiol. 2016, 238, 326–337. DOI:10.1016/j.ijfoodmicro.2016.09.012.
- Purlis, E.; Salvadori, V. O. Bread Baking as a Moving Boundary Problem. Part 1: Mathematical Modelling. J. Food Eng. 2009, 91, 428–433. DOI:10.1016/j.jfoodeng.2008.09.037.
- Zhang, L.; Putranto, A.; Zhou, W.; Boom, R. M.; Schutyser, M. A. I.; Chen, X. D. Miniature Bread Baking as a Timesaving Research Approach and Mathematical Modeling of Browning Kinetics. Food Bioprod. Process. 2016, 100, 401–411. DOI:10.1016/j.fbp.2016.08.007.
- Ansari, M. I. A.; Datta, A. K. An Overview of Sterilization methods for Packaging Materials used in Aseptic Packaging Systems. Food Bioprod. Process. 2003, 81, 57–65. DOI:http://dx.doi.org/10.1205/096030803765208670.
- Xing, Y.; Li, A.; Felker, D. L.; Burggraf, L. W. Nanoscale Structural and Mechanical Analysis of Bacillus Anthracis Spores Inactivated with Rapid Dry Heating. Appl. Environ. Microbiol. 2014, 80, 1739–1749. DOI:10.1128/AEM.03483-13.
- Broeckx, G.; Vandenheuvel, D.; Claes, I. J. J.; Lebeer, S.; Kiekens, F. Drying Techniques of Probiotic Bacteria as an Important step Towards the Development of Novel Pharmabiotics. Int. J. Pharm. 2016, 505, 303–318. DOI:10.1016/j.ijpharm.2016.04.002.
- Schutyser, M. A. I.; Perdana, J.; Boom, R. M. Single Droplet Drying for Optimal Spray Drying of Enzymes and Probiotics. Trends Food Sci. Technol. 2012, 27, 73–82. DOI:http://dx.doi.org/10.1016/j.tifs.2012.05.006.
- Gong, P.; Zhang, L.; Han, X.; Shigwedha, N.; Song, W.; Yi, H.; Du, M.; Cao, C. Injury Mechanisms of Lactic Acid Bacteria Starter Cultures During Spray Drying: A Review. Drying Technol. 2014, 32, 793–800. DOI:10.1080/07373937.2013.860458.
- Peleg, M. Advanced Quantitative Microbiology for Foods and Biosystems: Models for Predicting Growth and Inactivation. Boca Raton: CRC Press, Taylor & Francis Group, LLC, 2006. DOI:10.1201/9781420005370.
- Cerf, O.; Davey, K. R.; Sadoudi, A. K. Thermal inactivation of Bacteria: A New Predictive Model for the Combined Effect of Three Environmental Factors: Temperature, pH and Water Activity. Food Res. Int. 1996, 29, 219–226. DOI:10.1016/0963-9969(96)00039-7.