
ABSTRACT
This paper explores students and researchers drawings of white blood cell recruitment. The data combines interviews with exhibit of review-type academic images and analyses of student model-drawings. The analysis focuses on the material aspects of bio-scientific data-making and we use the literature of concrete bioscience modelling to differentiate the qualities of students model-making choices: novelty versus reproduction; completeness versus simplicity; and the achievement of similarity towards selected model targets. We show that while drawing on already published images, some third-year undergraduates are able to curate novel, and yet plausible causal channels in their graphic representations, implicating new phenomenal potentials as lead researchers do in their review-type academic publications. Our work links the virtues of drawing to learn to the disclosure of potential epistemic things, involving close attention to the contours of non-linguistic stuff and corresponding sensory perception of substance; space; time; shape and size; position; and force. The paper documents the authority and power students may achieve through making knowledge rather than repeating it. We show the ways in which drawing on the images elicited by others helps to develop physical, sensory, and sometimes affective relations towards the real and concrete world of scientific practice.
GRAPHICAL ABSTRACT
Introduction
In science the settlement of facts and models are inseparably intertwined with the historical development of visual culture and technology (Daston & Galison, Citation2007; Rheinberger, Citation1988, Citation2010) and scientific knowledge is intrinsically bound up with graphic representation (Coopmans, Vertesi, Lynch, & Woolgar, Citation2014; Latour, Citation2006; Lynch, Citation1988, Citation2006; Pauwels, Citation2006). Among the sciences, biology makes most frequent and most varied use of images (Elkins, Citation2007), and while the technologies of bioscience image-making have changed dramatically since the enlightenment, drawing has never been entirely replaced as a relevant research tool (Hoffmann & Whittmann, Citation2013; Whittmann, Citation2013). Thus as Quillin and Thomas (Citation2015) explain: ‘It is difficult to imagine teaching, learning, or doing biology without the use of visual representations’ (Quillin & Thomas, Citation2015, p. 1). Compared with the gains achieved by the ‘academic literacies approach’ (cf. Lea & Street, Citation1998) in the writing disciplines, however, contemporary science education tends to neglect visual practice (Kress, Citation2003; Kress & van Leeuwen, Citation2006). While modelling and simulation are core competencies in the Vision and Change statement of the American Association for the Advancement of Science (Citation2011), ‘drawing to learn’ (cf. Ainsworth, Prain, & Tytler, Citation2011) is rarely realised as a science teaching or assessment method in schools or universities/colleges (Quillin & Thomas, Citation2015). Nevertheless, most bioscience lectures and textbooks rely on images as pedagogical devices (Perini, Citation2012a), and drawings of ‘things’ like cells and their functions are concrete models of their material targets (Weisberg, Citation2012). In the words of Downes (Citation1992):
In most texts a schematized cell is presented that contains a nucleus, a cell membrane, mitochondria, a Golgi body, endoplasmic reticulum and so on. In a botany text the schematized cell will contain chloroplasts and an outer cell wall, whilst in a zoology text it will not include these items. The cell is a model in a large group of inter-related models that enable us to understand the operations of all cells. The model is not a nerve cell, nor is it a muscle cell, nor a pancreatic cell, it stands for all of these. (p. 145 [emphasis added]: quoted also in Weisberg, Citation2012, p. 18)
Perhaps the most important issue is that while scientists inevitably use images to communicate their research findings, bioscience research-work also constitutes the inscription and the mobilisation of non-verbal matter (‘things’ such as cells and molecules and their processes) being made as data-images (Knorr-Cetina, Citation1999; Latour & Woolgar, Citation1986). Thus the material realisation of the experimental phenomenon (Radder, Citation2012) entangles model/theory and matter: models and matter which manage and negotiate both the material and the theoretical side of phenomenal disclosure (Heckman, Citation2010; Pickering, Citation1995). In the teaching/learning context it is therefore towards drawing as a function of model-based reasoning that Quillin and Thomas (Citation2015) direct most attention, extending Perini’s work on the ‘correct’ interpretation of instructor-generated or instructor-selected scientific images (Perini, Citation2012a) towards learner-generated models ().
Figure 1. The spectrum of engagement with graphic bioscience models (from interpretation to creation): Quillin and Thomas (Citation2015, p. 3).
Nevertheless, there are good reasons to doubt the ‘blank-slate’ which Quillin and Thomas (Citation2015) depict as the potential starting-point of learner-generated model-making (: right-hand portion). Some textbook images (the drawing of an archetypal brain cell, for example) are already so well known that it is difficult to envisage how students might be free to represent these model-objects in more novel ways (see Wingate, Citation2011; Wingate & Kwint, Citation2006). Of course research scientists make use of established images/models: but in research these are made to work as tools or guides (as methods) rather than being taken as representations of the research target (Hay, Williams, Stahl, & Wingate, Citation2013). The first aim of this paper is to explore the ways in which students might escape the ‘knowledge trough’ of visual reproduction (Wingate, Citation2010), learning to curate existing scientific knowledge in more creative, and potentially, new knowledge-making ways. As we shall see, research scientists curate pre-existing data-images to envisage and explain phenomena (e.g. Trujillo, Anderson, & Pelaez, Citation2015). The extent to which students might also achieve this purpose in drawing-work is one important way in which the college, university, or school curriculum might be more researcher-like (Hay, Weller, & Ashton, Citation2015).
Novel drawing quality
Perhaps one reason that drawing is not more widely used in science teaching and assessment is that where the success (or otherwise) of students’ model-drawings might be novel, we must also find correspondingly novel frameworks for assessment of their drawings’ qualities. The problem with most pre-existing schemes, like the one in which Ranaweera and Montplaisir (Citation2010) provide criteria for giving formative feedback on students’ drawings of ‘the human nervous system’, is that the highest scores such schemes afford are necessarily attributed to reproduction of the textbook image: conferring no reward/incentive for work which ‘goes beyond the given’ (cf. Bruner, Citation1961). The second aim of this paper is to address this issue, turning to the scientific model-making literature, particularly the work of Weisberg (Citation2012) who explains the choices of concrete scientific modelling, thereby potentially providing more objective measures of the achievements of novel drawings/models.
Model-making practice
Weisberg’s framework () comprises four essential elements and their relations: (a) elements of model description (i.e. its ‘blue-print’); related to (b) the model per se by specification of its assignment (scope and purpose); and (c) its target system(s), in turn related by degrees of similarity achieved; towards (d) the phenomenon of which the model holds contention and utility through the process of abstraction. This provides a framework by which judgements might be made of quality in model-drawings depending on: (1) their scope; (2) their similarity; and (3) relations towards phenomenal potentials.
Figure 2. A schematic summary of concrete model-making: Weisberg (Citation2012, p. 96). © Oxford University Press, USA.
In regard to these three criteria, however, Weisberg (Citation2012) also usefully describes the choices of representational fidelity which determine the success or failure of a model’s given purpose. Briefly (and selectively) these are as follows:
Completeness – Representational goals which instruct the model-maker to include every known aspect of the target system(s) including its exogenous causes.
Simplicity – Goals prioritising the making of the simplest model which makes sense of the immediate data; ignoring exogenous factors and perhaps introducing serious distortions in order to do so.
Causality – Requiring that the model (probably a simple one) includes only the important root or causal channels of its purpose.
As Weisberg (Citation2012) explains, causal models are often the most revealing model types. It is the relative isolation of potentially causal elements and channels which is most important in shaping the object of inquiry (Hoffmann, Minkin, & Carpenter, Citation1996). This is to say that while bioscience models may refer and perhaps embody the materiality of phenomenal experience (often experimentally realised), causal models also curate the contours of potential scientific object(s)/system(s) and the experimental method (e.g. Lynch, Citation1988, Citation2006; Rheinberger, Citation2009, Citation2010). The potential realisation of ‘things’ like leukocytes (white blood cells); their functions and molecular causes/operations; or the bigger picture of the ‘leukocyte cascade’ (a term which collects the agents and the processes by which leukocytes are recruited to wound-sites to discharge their immunological duties) are all negotiated in their graphic representation (e.g. Ley, Laudanna, Cybulsky, & Norshargh, Citation2007). As we shall see the images of review-type articles are synoptic models, drawing on visual data elicited by others and curating the system as a whole by drawing ‘things’ together: influencing decisions about research priorities, and sometimes determining the choices of researchers; the funding allocations made to different research groups; and therefore, also in some part, determining the disclosure of scientific facts through social/economic channels (Heckman, Citation2010; Pickering, Citation1995).
Review-type images curate the leukocyte cascade
The research world of leukocyte biology is a loose assembly of many different research-groups, combining, for example: studies of blood physics (rheology); cytology; immunocytochemistry; histology; classical immunology; molecular biology; and molecular biophysics: many of these approaches being combined together and augmented by the use of a variety of microscope technologies often coupled with the use of photography or video.
Each field has its own preferences for the object(s) of inquiry it prioritises: frequently requiring visual resolution at different scales with different models/apparatus and depending upon a likewise varied repertoire of data-making/inscription devices. Thus the variety of images in leukocyte biology is somewhat bewildering and difficult to fit together (even for researchers), and the discussion pages of original research and particularly review-type articles tend to present graphic summaries (usually synoptic diagrams) which have the function of establishing the relations between disparate fields and data: creating novel system-level models; and revealing or consolidating particular research priorities in doing so. Such reviews are rarely systematic (i.e. they tend to lack specified criteria for including or omitting detail). Instead they are selective: most often being written and illustrated by established research leaders who are encouraged to draw on their own knowledge and experience to achieve a particular assignment. shows a handful of the images which illustrate some ‘leukocyte cascade’ reviews: these particular examples having being chosen because they are among the most frequent visual exhibits used in teaching leukocyte biology which also show how the ‘epistemic things’ of leukocyte research are dynamic processes (Dupré, Citation2012).
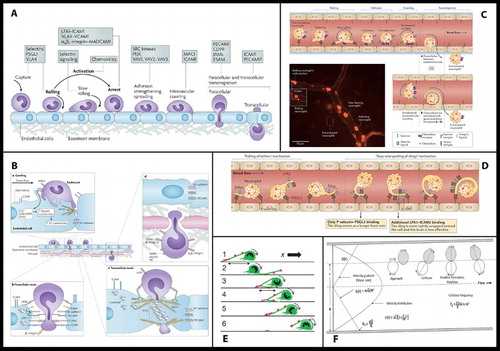
Figure 3. A sample of the images of reviews and original research publications of the ‘leukocyte cascade’: (a) and (b) from Ley et al. (Citation2007), in Nature Reviews Immunology; (c) and (d) from Kolaczkowska and Kubes (Citation2013), also in Nature Reviews Immunology; Snudd et al. (Citation2012) in Nature; and (f) from Karino and Goldsmith (Citation1987) in Haemostasis and thrombosis. Parts (a)–(d) are classic immunology-type schematics which divide the stages of the leukocyte recruitment process into steps which attribute causality to particular molecular (receptor–ligand) interactions. Image-part (c) also includes a replete pictorial component which is a photograph of leukocytes and blood vessels visualised under experimental conditions using intravital microscopy. Parts (d) and (e) purport to represent the same object – the slings which leukocytes form to break themselves against the forceful flow of blood: but these images evoke this process in quite different ways, attributing a very different sense and feel for leukocyte cell shape and behaviour. Part (f) is an image-type more consistent with experimental simulation of rheology, showing the forces which cause leukocytes to marginate (accumulate at the periphery of blood vessels) and to crash and roll together.
Showing these images will help us later differentiate between student drawings which reproduce their elements and process-organising structures versus those learner-generated models which might be more novel compositions: but also the purpose of their inclusion here is to demonstrate the ways in which such graphic models already curate the collective research field. This issue is developed briefly in the key informant interviews which follow.
Key informant interviews
Our interviews (and subsequent e-mail correspondence) with four key informants were semi-structured: organised by discussion of the images shown in . The interviews were carried out by the first author of this paper and comprised a total of 12 hours of talk with four participants; each of them lead researchers/teachers in the field of leukocyte biology; three based in U.K. institutions; and one working in the U.S. Two of the U.K.-based participants also taught the students of our teaching interventions. For the purpose of this article, however, just two quotes suffice. This is because the thematic coding of all those interviews corresponds so closely to the categories of ‘assignment/scope’ and ‘similarity’; ‘completeness’; or ‘simplicity/causality’, already discussed in our summary of Wiesberg’s model-making framework, which we need not repeat here: instead we simply embed these ‘coding labels’ in the transcripts (below) to demonstrate that correspondence. The two quotes we choose to show, however, also add particular weight to the issue of a sense and feel towards the phenomena potentially at stake – an issue which Weisberg (Citation2012) does not implicate explicitly.
Informant 2: ‘Most of these models introduce serious distortions [simple model consequences]. You look at this or that image [indicating parts A and C of the pictures shown in ] and you think this is what happens – naturally [similarity/reality]: But they are selective [choices]. Actually what is shown is the very special case of cells which stick [assignment]. In fact 90% of all migratory endothelial events are excluded in this image [simplicity/causality]. You don’t see how unusual this is [assignment scope]. I mean cells in blood are rushing by and normally they don’t make any contact with the endothelium. In reality it’s like the endothelium is Teflon coated and there is neither friction nor gravity in this environment [abstraction]. And then suddenly: Wham! A cell sticks … and rolls and crawls [similarity]. Amazing (!) But you don’t get that impression from these images. It’s all just business as usual [assignment].’
Informant 4: ‘What is left out [simplicity] – purposefully left out I mean [causality], but also problematically [distortion] is the “big picture” [scope] and any semblance of the actual scale and speed which could make these models much more real [similarity]. I mean the act of recruiting leukocytes happens very quickly: Almost instantaneously; and it happens over very large distances. Imagine that you are camping in the New Forest in England. It is dark and the nearest train-track is some six miles way. Imagine that you step outside your tent and switch on your torch. Then two seconds later one of the passengers who was sitting quietly in a carriage on that speeding train is sitting next you [abstraction]. That’s the sort of scale and sense of time which we must talk of in the leukocyte cascade [sense and feeling for the object/system]. But look at the pictures of that system. How do you get a sense of that from those (!).’ … ‘We use these images all the time in our research. They organise our work ([explicitly curation]) and allow me to say to one researcher – look you are working on this part of the system while someone else is working over here (pointing at different parts of the images shown in part A). But you need to see what these images leave out [assignment]. Like platelets [scope] or the real sense of time and space [similarity]. I acknowledge my perspectives, but you must also see that sometimes I think these images determine which project attracts most publicity and funding (!).’
Teaching interventions
Our research of student drawing was achieved in two teaching interventions. First, a pilot study involving nine postgraduate students who were enrolled in a one-year Master’s programme (September 2013–August 2014): ‘Experimental Integrative Pharmacology and Physiology’ and who, as part of that, were required to take a three-week teaching course about leukocyte recruitment. This involved six hours of lectures and one three-hour practical class, designed and led/delivered by the second author of this paper. In this pilot study we simply asked our students ‘please draw an image of the leukocyte cascade’: (a) before the lecture series; (b) at the end of those lectures; and (c) at the close of the laboratory practical. No other advice or guidance was given.
With only one exception (shown in ) the students’ drawings showed little development in the three-week course (except that occasionally some newly taught information was added at the second or third drawing-stage), and from the beginning, most of these students’ drawings reproduced the elements and organisational patterns of the review-type images which had been encountered in their previous undergraduate courses. The student’s drawings shown in were novel from the start (part a), however, and particularly the image which they made at the end of the practical class (part c) had exchanged abstract and idealised representational devices for depiction of the material ‘things’ they encountered in the laboratory.
Figure 4. The drawings of one student in the pilot study: (a) before the teaching; (b) after two weeks of lectures and independent reading; and (c) after a subsequent three-hour experimental class.
An extract from an interview with that student (the author/illustrator of the drawings shown in ) sheds light on the ways in which laboratory work brought about the productive difference of their final image:
This was after the practical, which I really enjoyed, because I actually got to visualise the cell. That is why I have drawn what I saw under the microscope. Strangely enough, I sort of felt like I forgot about the theory of cascade and was just so intrigued by the cell itself. So I haven’t even mentioned the cascade. I haven’t said anything about rolling or adhesion or any of those processes. I’ve more drawn about an acute cytokine model, which is the LPS driven model [i.e. a model of infection which is instigated by artificial inoculation with lipopolysaccharide derived from the cell-wall of gram-negative bacteria]. I have not gone for how the leukocyte is activated. I don’t see any of those stages. All I see, if I remember correctly; I challenged with LPS; then I collected a broncho-alveolar lavage; and then I quantified leukocyte number where I noted that leukocyte number increased. To me, that is like saying – Okay, the number of leukocytes in the lavage cell have increased – well, they’ve obviously got there through the processes of leukocyte activation and the cascade: So the two come together perfectly because you have the activation and then they migrate to the site of inflammation … the two make perfect sense in that regard … . What I recorded isn’t receptors, it’s not cell surface expression of markers, its not molecular crosstalk between cells. What I learnt in the practical is that when you challenge with an inflammatory agent, you see an infiltration of cells. So that is effectively what I’ve drawn: An infiltration of cells into the particular cavity.
We were encouraged by this student’s drawing-work and commentary, but also somewhat dismayed by the reproductive stance of most of the other students’ drawings which in interviews tended to be described as being only abstract information records rather than recognising their own drawings or the images of review-type papers as being concrete models with an epistemic function. Moreover, given that laboratory work would not be a part of our subsequent teaching for a group of third-year undergraduates (the setting of our second intervention) we thought it necessary to develop a teaching programme for these students which would include a more deliberate focus on the graphic and material interoperations of science data-making; modelling; and synoptic re-arrangement.
The second teaching and assessment intervention
Our second teaching intervention was with 28 third-year undergraduates taking a module with the title: ‘Pharmacology of Inflammation’, and different from our pilot study this involved the summative assessment of our students’ drawing-work: allocating 5% of the total marks available for the module to their drawings. This was an alternative to the written library-based information project which was the equivalent assignment task in previous years. The teaching comprised the same graphic and verbal lecture content as that given to the Master’s students of the pilot study, but the teaching was now spread out over eight weeks and augmented with eight additional teaching hours in which the first author of this paper used lecture style presentations and led discussion and/or workshop-type activities exploring the visual cultures of science and giving the students opportunities to develop, exhibit, critique, and re-work their drawings using feedback from their peers and from ourselves. The teaching about scientific image-making used several of the references included by this article already: particularly the work of Michael Lynch (Citation1988, Citation2006); Luc Pauwels (Citation2006); Laura Perini (Citation2005, Citation2012a, Citation2012b); Hans-Jörg Rheinberger (Citation2010); Michael Weisberg (Citation2012); and Barbara Whittmann (Citation2013).
Student drawing choices
We report our students’ drawing-work using the thematic categories of Weisberg’s framework, organising our analysis in terms of student drawing choices. We begin by focussing on reproduction versus novelty: illustrating how novel image-making inevitably involved a risk.
Novelty and risk
Just two (of the 28) student drawings we collected were thorough reproductions. shows one example which used the graphic elements and organising scheme common to the images of Ley et al. (Citation2007) and Kolaczkowska and Kubes (Citation2013) with little new development (compare with parts (a)–(d) of ). Most of the other students’ drawing compositions were much more novel, however, and while they drew on the literature and teaching which was their source material, they tended to develop their own, more particular assignments (–).
Figure 5. An image comprising the reproduction of existing review-type images.
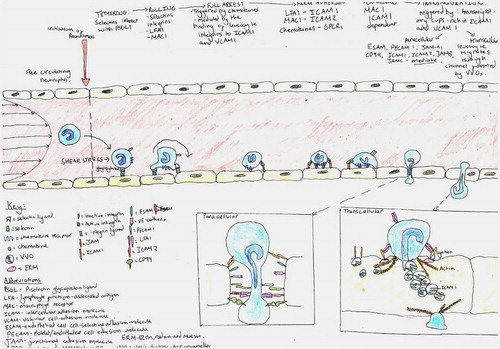
Figure 6. A drawing which while risking novelty lacked similarity to the target system.
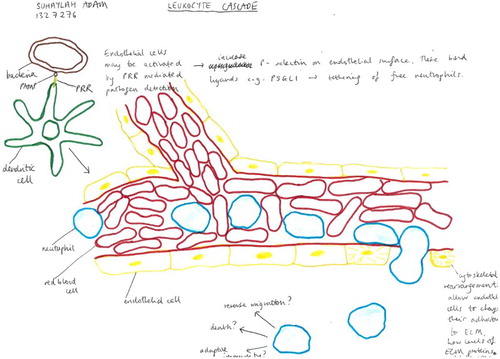
Figure 7. A composition with a broad assignment which also tended to rely on writing to achieve its purpose.
Figure 8. A drawing in which graphic elements of cell and tissue size, shape, time, position, relative abundance, and force, all contribute to creating a ‘realistic’ process model.
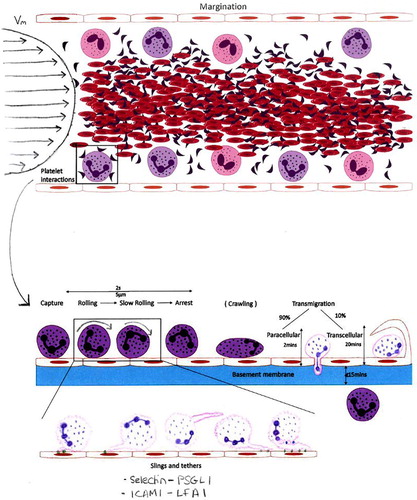
Figure 9. An image with a narrow scope which explains the causal processes of bringing cells together where, like , the sizes; shapes; positions; and the timing of different events all matter to the depiction of the potential phenomenon the model makes.
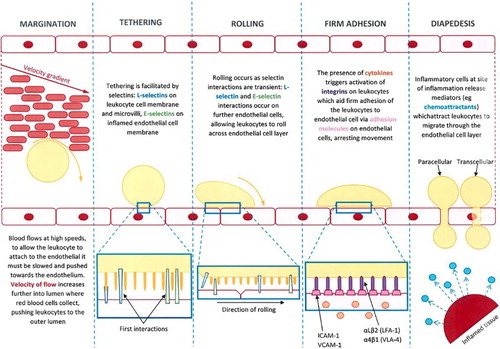
Figure 10. One student drawing which used telescoping graphic method to achieve different assignment goals in the different parts of its total composition.
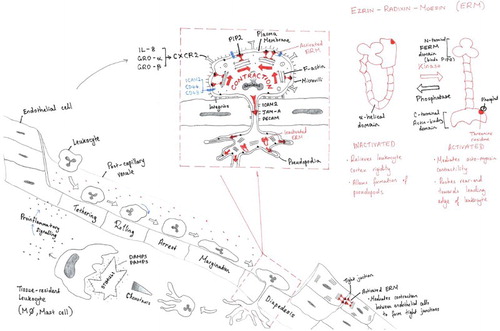
Figure 11. One particularly novel drawing of leukocyte–platelet interactions evoking a material ‘reality’ rarely depicted in conventional reviews.
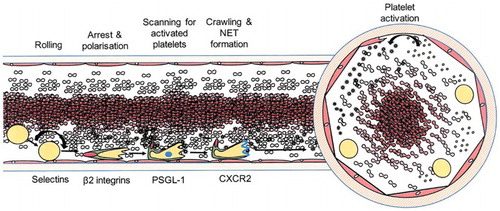
Figure 12. A drawing which achieves a sense and feel for the material components of its depicted process, choosing judicious use of colour/shading to create textures which embody cause.
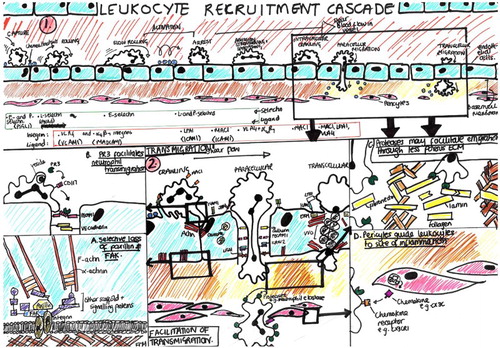
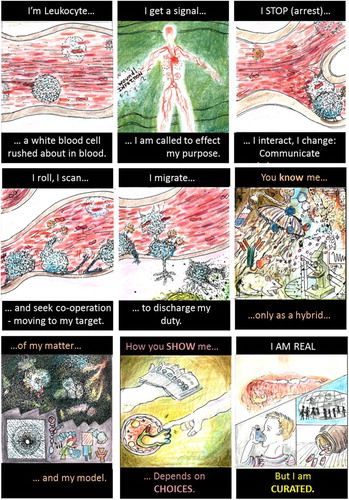
Figure 13. A student drawing which showed a leukocyte “talking” of its own intentions.
Making novel drawings was a risk, however, and one drawing (shown in ) is an example where while aiming at a more original and simple/causal model (potentially invoking recruitment and cell–cell communication events as consequences of the branched and irregular structure of blood vessels), the image failed to achieve its intended similarity because its mainstay graphic elements showed necrotic (dead or dying) cells and tissues, rather than giving body to the living and dynamic entities/interactions of the leukocyte cascade.
Assignment scope
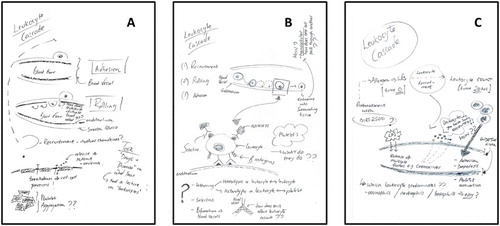
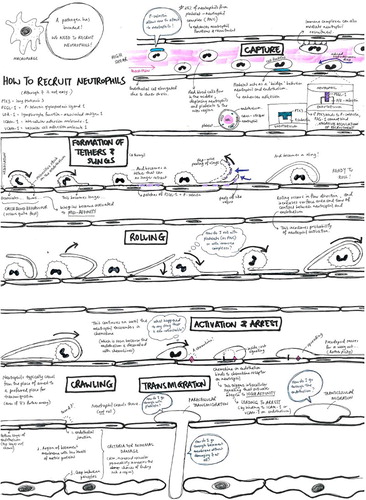
After vital choices regarding the alternatives of novelty or reproduction, the most conspicuous drawing choice our students made was in regard to assignment scope, sometimes combined implicitly with the fidelity goals of their models. shows a composition with broad scope, including much of the known information as well as listing some of the gaps in experimental data which are likewise described in the pre-existing review-type literature.
The drawings shown in and had more narrow assignments, however, and while the picture of used writing to achieve completeness, the drawing of used hardly any written words at all. The different representational achievements of these models ( versus and ) illustrate the ways in which simpler and more graphic images were more successful in achieving target similarity. Notwithstanding the similarity achieved in some graphic parts of , the more complete achievements of that ‘picture’ were a consequence of verbal lists and tables (or of graphic icons which were exchangeable for written labels like ‘the brain’ or ‘lung’), so that while this composition wrote about a set of relevant issues, it did not model its potential object(s)/system(s) in concrete ways. The more narrow assignment choices of and were more successful in this regard because of implicating the material ‘stuff’ of their targets where space; time; size; position; and force all matter as physical constituents of a process and its putative causes.
Thus the drawing of presented a plausible model of blood flow/force operating differently on cells of different sizes; densities; and distributions, thereby isolating a set of causal physical elements and channels regarding the initiation of the leukocyte recruitment: and likewise, the image of embodied the constraints of the interaction distances between leukocytes and endothelial cells: showing the relative molecular size (length) of different receptors as cause; bringing cells together over different distances; at different times; and places.
Managing the tensions of fidelity
Like the successful drawing shown in and , many other student drawings managed the inherent tensions of fidelity by using telescopic graphical devices which allowed alternative parts of their drawing to achieve distinct representational goals. The drawing shown in is a good example, where complete goals were achieved by borrowing from the drawings made by Ley et al. (Citation2007) and Kolaczkowska and Kubes (Citation2013) to achieve broad scope and coverage; while the inset parts (enlarged and highlighted with judicious use of red colour against an otherwise black-and-white background) showed more novel contentions about the contraction of the leukocyte in the process of migration (top-centre), related to a model of the changing molecular conformity which might be instrumental in bringing this about (top-right). Thus the drawing shown in achieved a novel synopsis, projecting the dynamic contours of the phenomenon it brought to light – selectively.
Similarity
Like the drawing shown in , was selective; novel; and similar. Ostensibly the assignment of this drawing was a simple one: choosing to leave out most of what is already known about the leukocyte cascade (by having narrow scope), in order to model a set of more novel or potential causal channels rarely implicated in the existing literature. First, and most conspicuously, the drawing created a hybrid of the conventional longitudinal view of blood vessels with a coaxial (cross-sectional) viewpoint: achieving similarity to the experimental set-up of many rheological models (in which glass tubes are often used to simulate blood vessels); as well as being similar to the tissues of histological preparations. Second, elements like platelets, often written about in contemporary reviews, but rarely included in their graphic models, were introduced as active/causal elements of the model system. Third, these platelets were shown in their putative (but plausible) relations to leukocytes which changed in time: these leukocytes developing a scanning ‘tail’ and a ‘leading-edge’ with different, changing, but related functions at different times and places. All of these are valid compositions, debated and at least partly realised in some of the recent research literature which this student chose to draw on (i.e. Sreeramkumar et al., Citation2014). The image achieved more than the summary of that research, however: it was synoptic, curating the leukocyte ‘identity’ as a new phenomenal potential with inter-related causal elements shown as different gene-expression maps which drive different interactions with other causal elements (endothelium, platelets, etc.) through changing time and space.
To achieve these goals the student drawing shown in also broke away from the more common convention of showing receptor–ligand interactions as isolated, static (and symbolic) locking-blocks, and it is useful to report some of the things its curator explained about the making of their image:
First I had already spent time in the lab looking at the rush of blood seen with intravital microscopy. I wanted to convey a sense of that – so I drew the density of red blood cells in the middle of my blood-tube and also showed a few leukocytes pushed to the periphery by shear-force. But then I wanted to imagine how this might look in a cross-section. So I added the coaxial view which seemed to bring the system more to life. But I couldn’t use this view alone because it didn’t give a sense of time. I went back to the original longitudinal view to develop that. Then I went on to discover a research paper which talked about leukocyte-platelet interactions and showed the leukocyte as what is called a ‘uropod’: A cell which is polarised by its activation and achieves different movement, scanning and directional activities in different parts of its structure. I began to see that the conventional depiction of cell-cell interactions was somewhat clumsy and not really true to the life of the leukocyte in which the different parts of the uropod are different: Because of the changing gene expression in its different parts at different times. That is why I have shown the system as I have, leaving lots of details out, but aiming at a realistic picture of this aspect of leukocyte behaviour.
In other student interviews, and in focus groups, the development of all the most successful images were reported as this student explained (above) – as reflective/reflexive developments whereby first decisions gradually gave rise to other choices and revisions, frequently requiring new recourse to reading. All the most successful drawings were simple, or while being generally complete, nevertheless, isolated novel causal elements and channels.
Other drawing choices
The choice of drawing by hand versus using graphic software was significant. Nine of our 28 students hand-made sketches on paper to begin with, but finished their drawings on the computer. All of those final productions were narrow in their scope and also simple. Intentionally (or not), choosing to use graphic software brought about a gain because more simple image types were typically associated with the isolation of causal elements and channels.
There was only one drawing () in which a ‘real’ sense and feeling for the system was created because of the press of pen on paper and artistic exchange of colours – creating textures which evoked material experience of leukocytes seeking out the more porous regions of the basement membrane to achieve their migration purpose (highlighted in ).
Unique among the drawings we collected, depicts the leukocyte as a talking subject, using speech or thought-bubbles to give the cell a ‘voice’ or to show its ‘intentions’. While this narrative approach might have led to neglect of similarity and weak sense and feeling for the materiality of its object(s), the student-illustrator used original research-productions to construct the picture and the fine graphic details of their drawing was evocative of research-made ‘things’ and their dynamic processes. Moreover the somewhat novel move of telling the story from the cell’s perspective corresponds to the ways in which researchers sometimes try to place themselves as if they are their objects of inquiry (Damasio, Citation1994; Hay et al., Citation2013) where affective dispositions matter in the image (Flowers, Citation2015) and in relation to the making of the experiment where the contours of the object remain contentions (see Myers, Citation2008, Citation2015, for example).
Focus group data and teaching evaluation
As is action research generally (e.g. Burns, Citation2007), we used focus groups as a teaching method, but also as the opportunity to gather research data about our students’ learning experiences. At the end of the module, but before the students had received their marks and our formal (written) responses to their drawing, we also collected (anonymous) teaching evaluation.
At the start of the teaching, many of the students reported being somewhat unsettled by the novel nature of the teaching and assessment task: ‘I don’t really know what is expected of me’; or: ‘I don’t understand why drawing is important’: by the later stages of our project, however, most of the students were much more confident and positive about the intended goals. Nevertheless, several described the considerable amount of work their drawings entailed: ‘Each and every time you choose to put an element in, or to leave something out, you have to go back to your reading: You have to think – why am I doing this?’ And the most frequent complaint was that: ‘For all this work the drawings should be worth more than 5% [of the module grade]’. Some students stated that the teaching of visual literacy was: ‘Boring and repetitive’, while others were: ‘Excited and engaged by it’. Nevertheless most acknowledged the ways in which the drawing-work: ‘Really meant I learned the leukocyte cascade’. All the students agreed that they would answer an exam question on this topic in preference to any other, because: ‘I really know this now’; while many students also voiced the concern that: ‘If this is what it takes to know a topic properly, how will I manage to know all the topics covered in the module (!)’ – a concern which coincides with contemporary debates about an over-loaded and largely content-led curriculum in university science education (e.g. Dolan & Collins, Citation2015).
Discussion
The students’ drawings we collected ranged from reproduction of pre-existing review-type images through to the novel curation of purposefully selected and sometimes un-conventionally depicted model elements which because of their original and synoptic recombination brought new phenomenal potentials to light. The most successful drawings were simple, and among these the best were those which were able to isolate causal elements or channels while bringing about a plausible sense and feeling for the concrete materiality of their targets. While writing was sometimes useful for achieving completeness it was ‘realistic’ graphic model elements which were most successful because of their similar relations to the objects and the processes which their models made/represented: graphic images connected to ‘reality’ through the sensory experience (or perception) of things/events as categories of substance; space; time; shape; and related cause (see Radder, Citation2012; also Habermas, Citation1978).
It is also relevant to state that while our work demonstrates the ways in which student drawing sometimes brought about new disclosure of phenomenal potentials, some of the most successful drawing-work was also explained in the context of laboratory experience or the witness of ‘things’ (including processes) produced and visualised in experimental settings. The synoptic potential of drawing on the images of others augments laboratory experience and/or the use of experimental video, but it does not replace these learning experiences. Nevertheless As Latour (Citation2006) explains in work which bears the title: ‘Drawing things together’, paper tools (or other graphic media) allow the capture, the summary, and inter-relation of information gathered in different times and places (Callon & Latour, Citation1981), often using different methods, and: ‘It is because all these inscriptions can be superimposed, reshuffled, recombined and summarised that totally new phenomena can emerge, hidden from the other people from whom all these inscriptions have been exacted’ (Latour, Citation2006, p. 29). As we have seen this is the authority (and prestige/economy) which leading scientists sometimes achieve in the images of their review-type articles, and by degrees this is also the achievement of several of our students’ drawings.
Our analysis exhibits the importance of a set of model-making choices: decisions to take risks (or not); or to propose complete versus simple goals where sometimes the virtues of simplicity help to implicate novel causal elements or channels. We began this paper explaining some of our doubts about the ‘blank slate’ of learner-generated models: but we have appropriated the phrase ‘curating knowledge’ to describe the ways in which while drawing on already published images, science students may participate in modelling, bringing new phenomenal potentials to light as lead researchers do. Researchers ‘draw to learn’ and the lab books and the manuals of bioscientists are littered with ‘graphematic traces’ (Rheinberger, Citation2003): hybrid drawing/scribble-marks, written annotations, and the outlines of mathematical descriptions which constitute the tentative and perhaps ephemeral projections of potential scientific objects and novel techno-epistemic arrangements (Rheinberger, Citation2009, Citation2010). Drawing is particularly important in bioscience where concrete models aim to achieve similarity towards material targets (Weisberg, Citation2012) and where deliberate attention to the contours of non-verbal ‘stuff’ comprises the development of potential ‘epistemic things’ as well as developing the research potential of those people who produce/arrange them (Stafford, Citation2011).
Teaching implications
We acknowledge that the development of our paper is most relevant to higher education, depending on the judgements of lead researchers/teachers who by virtue of their own research experience have the ability to critique the plausibility of models which might be different from what is drawn already. Nevertheless, we also suggest that Weisberg’s model-making framework (Weisberg, Citation2012) has utility for organising related drawing-work in schools: providing a structure for teaching scientific drawing in the context of modelling; and furnishing criteria for attaching grades to novel learner-generated models. Most importantly, we have linked model-drawing to the epistemic practices of research, suggesting that synoptic graphic modelling is one important way in which curriculum can be made more relevant to the actual practices of research in science. We list (below) some of the ways in which student drawing exercises achieve research-related goals, briefly describing the teaching implications of this purpose:
The combination of different graphic elements exacted by many different people using many different (model) systems develops the propensity for curating knowledge so that students may learn to practice science using paper tools (e.g. Klein, Citation2001; Latour, Citation2006), sometimes achieving the power (and authority/prestige/economy) of research per se.
Models (of one kind or another) are epistemic devices (Barberousse, Citation2013; Gelfert, Citation2011; Knuuttila, Citation2011) guiding but also shaping the ways in which science brings new phenomenon about (Hoffmann & Whittmann, Citation2013), so that in contemporary science practice modelling is also inseparable from ‘objectivity’ (Daston & Galison, Citation2007) and model-making is therefore one of the most encompassing bioscience teaching methods (Gilbert, Boulter, & Elmer, Citation2000; Manthey & Brewe, Citation2013).
Model-drawing work is often restorative (Lynch, Citation1988), having the potential to return a scientific object, fractured and broken by the process of its (experimental) render, to its more original and ‘living’ state – ‘giving body’ (Hopwood, Citation1999) to objects and processes which are otherwise static (see Maerker, Citation2011).
A material sense and affective feeling (Ahmed, Citation2004) for the hidden contours of ‘things’ (like tissues; cells; molecules; and processes) are vital determinants of experimental science (Fox Keller, Citation2002), and model-drawing is one important way in which students may develop the ‘haptic vision’ which is necessary when the potential scientific object is not yet fully realised (Myers, Citation2015).
Choices between image reproduction versus novelty are particularly conspicuous in student drawing-work; perhaps more so than in writing (Hay, Weller & Ashton, Citation2015), and while novelty constitutes a risk, it might be encouraged and justifiably rewarded, even where sometimes the potential achievements of a novel drawing-project are not entirely successful.
Teaching about model-making frameworks (e.g. Weisberg, Citation2012) introduces dialogue about the interoperation of ‘things’ and models while also introducing issues of ‘design’ in science (Knorr-Cetina, Citation1999). While complete goals prioritise information gathering, simple models are often more successful when used to isolate potential causal elements and channels (Hoffmann et al., Citation1996) and sometimes grading student drawings may legitimately entail awarding marks for what is purposefully left out.
While model drawing-work might sometimes be protracted and painstakingly ‘finished’, it may also be rapid; tentative; and deliberately recursive, allowing teachers to inspect successive drawings, perhaps to visualise the moments in which new threshold-knowledge (or practice) is encountered (e.g. Mayer & Land, Citation2003), and to record students’ model-making choices as a chart of their development (Hay et al., Citation2015). Drawing on the scientific data-images elicited by others has a very different function to ‘self-authorship’ in writing (Baxter Magolda, Citation2014), but visualising the course of learner-generated models may achieve comparable gains to those of ‘academic literacy’ in the writing disciplines, developing future scientists in the making of ‘future science’ (Rheinberger, Citation2010).
Concluding comments
At the time of writing many high impact bioscience journals (Cell; Cell Calcium; Cell Reports; E-Life; and Nature Communications, for example) require their authors to provide a graphical abstract to complement the more conventionally written summary of their claims and findings. This approach attests to the importance which the community of science attributes to the role of graphic image-making in research and its communication. As others have explained, however, drawing tends to be neglected by current education policy.
Carl Linnaeus is sometimes accused of having been unable or reluctant to draw, but he routinely used visual representational devices in the publications which led to the settlement of species nomenclature (e.g. Charmantier, Citation2011). Ramon Cajal’s drawings of brain cells unified ‘the cell concept’ as an organising principle in biology as well as introducing modern neuroscience (Rapport, Citation2005). Charles Darwin drew and employed others to make observational drawings continuously and also his own notebooks comprise tentative models such as his outline sketches of the ‘evolutionary tree of life’ (see ‘Darwin online’: http://darwin-online.org.uk/contents.html). In 1900, Paul Erlich, perhaps the founding figure of modern immunology, chose to present his ‘Antibody Theory’ to the Royal Society as a set of graphic images (Cambrosio, Jacobi, & Keating, Citation1993) and Linus Pauling’s ‘Lock-and-Key’ hypothesis was almost exclusively brought about on paper (Cambrosio, Jacobi, & Keating, Citation2006). These are just a handful of prominent examples, but they serve to illustrate the importance of drawing in making bio-scientific knowledge. To paraphrase DiCarlo (Citation2005): ‘Science should be taught as science is practiced’ and ‘drawing to learn’ (cf. Ainsworth et al., Citation2011) deserves much closer attention in bioscience education. Compared with writing and speaking (or ‘argument’; cf. Osborne, Citation2010), ‘non-discursive articulations suffer from the fact that they do not say nor read’ (Stafford, Citation1993, p. 6). Nevertheless, non-linguistic practice has an important place in science (Radder, Citation2012, p. 111), where silent, physically embodied, and essentially kinaesthetic or affective sensitivities are intrinsically linked to the realisation of phenomenon (Myers, Citation2015; Stafford, Citation2007). While scientific drawings ‘communicate’ (as multimodal discourse: cf. Kress & van Leeuwen, Citation2001) their relevant production also depends upon deliberate attention to the contours of material ‘things’ and processes (Dupré, Citation2012; Rheinberger, Citation2010). The propensity of drawing for the development of future scientists includes the development of a silent attention to and of the corporeal body (Flowers, Citation2015; Henderson, Citation1999; Stafford, Citation2007) where the deliberate re-combination of images elicited by others invites a new and dynamic encounter with the shapes; the forms; and processes, making up the living world (Habinek, Citation2011).
Acknowledgements
Paul Ashwin suggested the title of this paper; Anna Maerker pointed us towards the work of Michael Weisberg; and Richard Wingate is acknowledged for many productive discussions about the use of images in science and its teaching. Our work is an ensuing consequence of the ‘Academic Practice’ programme in our university while also the ‘Changing Classrooms’ project there made resources available to us for enhancing teaching through research. We thank the students who gave permission for exhibit of their drawings and our public commentary on their drawing-work. This research was approved by the ethics committee of King’s College London: REC Reference: REP/13/14-106.
Our teaching resources (graphic images and verbal explanation of the leukocyte cascade, as well as visual materials, student-study packs and reading lists about drawing and model-making in research of bioscience) are available on request: to the first author (contact details in the front-piece of this paper)
Disclosure statement
No potential conflict of interest was reported by the authors.
References
- Ahmed, S. (2004). The cultural politics of emotion. Edinburgh: Edinburgh University Press.
- Ainsworth, S., Prain, V., & Tytler, R. (2011). Drawing to learn in science. Science, 333, 1096–1097. doi: 10.1126/science.1204153
- American Association for the Advancement of Science. (2011). Vision and change in undergraduate biology education: A call to action. Retrieved May 2016, from http://visionandchange.org/files/2011/03/Revised-Vision-and-Change-Final-Report.pdf
- Barberousse, A. (2013). What is the use of diagrams in theoretical modelling? Science in Context, 26(2), 345–362. doi: 10.1017/S0269889713000082
- Baxter Magolda, M. B. (2014). Self-authorship. New Directions for Higher Education, 166, 25–33. doi: 10.1002/he.20092
- Bruner, J. S. (1961). The act of discovery. Harvard Educational Review, 31, 21–32.
- Burns, D. (2007). Systemic action research: A strategy for whole system change. Bristol: Policy Press.
- Callon, M., & Latour, B. (1981). Unscrewing the big leviathan: How actors macro-structure reality and how sociologists help them to do so. In K. D. Knorr & A. V. Cicourel (Eds.), Advances in social theory and methodology: Towards the integration of macro and micro sociologies (pp. 277–303). Boston, MA: Routledge.
- Cambrosio, A., Jacobi, D., & Keating, P. (1993). Ehrlich’s ‘beautiful pictures’ and the controversial beginnings of immunological imagery. Isis, 84, 662–699. doi: 10.1086/356636
- Cambrosio, A., Jacobi, D., & Keating, P. (2006). Arguing with images: Pauling’s theory of antibody formation. In L. Pauwels (Ed.), Visual cultures of science: Rethinking representational practices in knowledge building and scientific communication (pp. 153–194). Hanover, NH: Dartmouth College Press.
- Charmantier, I. (2011). Carl Linnaeus and the visual representation of nature. Historical Studies of Nature Science, 41(4), 365–404. doi: 10.1525/hsns.2011.41.4.365
- Coopmans, C., Vertesi, J., Lynch, M., & Woolgar, S. (2014). Introduction: Representation in scientific practice revisited. In C. Coopmans, J. Vertesi, M. Lynch, & S. Woolgar (Eds.), Representation in scientific practice revisited (pp. 1–14). Cambridge, MA: MIT Press.
- Damasio, A. (1994). Descartes’ error: Emotion, reason, and the human brain. New York, NY: Putnam.
- Daston, L., & Galison, P. (2007). Objectivity. New York, NY: Zone.
- DiCarlo, S. E. (2005). Cell biology should be taught as science is practiced. Nature Reviews Molecular and Cell Biology, 7(4), 294–296.
- Dolan, E. L., & Collins, J. P. (2015). We must teach more effectively: Here are four ways to get started. Molecular Biology of the Cell, 26, 2151–2155. doi: 10.1091/mbc.E13-11-0675
- Downes, S. M. (1992). The importance of models in theorizing: A deflationary semantic view. Philosophy of Science Association, 1, 142–153.
- Dupré, J. (2012). Processes of life: Essays in the philosophy of biology. Oxford: Oxford University Press.
- Elkins, J. (2007). Introduction. In J. Elkins (Ed.), Visual practices across the university (pp. 9–57). München: Verlag.
- Flowers, E. (2015). Drawing bodies/drawing students: Making up relationships in curriculum reform. Sisyphus Journal of Education, 3(1), 96–135.
- Fox Keller, E. (2002). Making sense of life: Explaining biological development with models, metaphors and machines. Cambridge, MA: Harvard University Press.
- Gelfert, A. (2011). Model-based representation in scientific practice: New perspectives. Studies in History and Philosophy of Science, 42, 251–252. doi: 10.1016/j.shpsa.2010.11.032
- Gilbert, J. K., Boulter, C. J., & Elmer, R. (2000). Positioning models in science education and in design and technology education. In J. K. Gilbert & C. Boulter (Eds.), Developing models in science education (pp. 3–17). Dordrecht: Kluwer.
- Habermas, J. (1978). Knowledge and human interests: A general perspective. London: Heinemann.
- Habinek, T. (2011). Tentacular mind: Stoicism, neuroscience, and the configuration of physical reality. In B. M. Stafford (Ed.), A field guide to a new meta-field: Bridging the humanities-neuroscience divide (pp. 64–83). Chicago, IL: University of Chicago Press.
- Hay, D. B., Weller, S., & Ashton, K. (2015). Researcher-led teaching: Embodiment of academic practice. Higher Education Review, 48, 25–39.
- Hay, D. B., Williams, D., Stahl, D., & Wingate, R. J. (2013). Using drawings of the brain cell to exhibit expertise in neuroscience: Exploring the boundaries of experimental culture. Science Education, 97, 468–491. doi: 10.1002/sce.21055
- Heckman, S. (2010). The material of knowledge: Feminist disclosures. Bloomington, IN: Indiana University Press.
- Henderson, K. (1999). On line and on paper: Visual representations, visual culture, and computer graphics in design engineering. Cambridge, MA: MIT Press.
- Hoffmann, C., & Whittmann, B. (2013). Introduction: Knowledge in the making: Drawing and writing as research techniques. Science in Context, 26(2), 203–213. doi: 10.1017/S0269889713000033
- Hoffmann, R., Minkin, V. I., & Carpenter, B. K. (1996). Ockham’s razor and chemistry. Bulletin de la Société Chimique de France, 122, 117–130.
- Hopwood, N. (1999). Giving body to embryos: Modelling, mechanism, and the microtome in late nineteenth-century anatomy. Isis, 90, 462–496. doi: 10.1086/384412
- Karino, T., & Goldsmith, H. L. (1987). Rheological factors in thrombosis and haemostasis. In A. L. Bloom & D. P. Thomas (Eds.), Haemostasis and thrombosis (pp. 739–755). London: Churchill Livingstone.
- Klein, U. (2001). Paper tools in experimental cultures. Studies in History and Philosophy of Science Part A, 32, 265–302. doi: 10.1016/S0039-3681(01)00010-3
- Knorr-Cetina, K. (1999). Epistemic cultures: How the sciences make knowledge. Cambridge, MA: Harvard University Press.
- Knuuttila, T. (2011). Modelling and representing: An artefactual approach to model-based representation. Studies in History and Philosophy of Science Part A, 42, 262–271. doi: 10.1016/j.shpsa.2010.11.034
- Kolaczkowska, E., & Kubes, P. (2013). Neutrophil recruitment and function in health and inflammation. Nature Reviews Immunology, 13, 159–175. doi: 10.1038/nri3399
- Kress, G. (2003). Literacy in the new media age. London: Routledge.
- Kress, G., & van Leeuwen, T. (2001). Multimodal discourse: The modes and media of contemporary communication. London: Hodder Education.
- Kress, G., & van Leeuwen, T. (2006). Reading images: The grammar of visual design. London: Routledge.
- Latour, B. (2006). Visualisation and cognition: Drawing things together. In H. Kuklick (Ed.), Knowledge and society: Studies in the sociology of cultures past and present (pp. 1–40). Bingley: Jai Press.
- Latour, B., & Woolgar, S. (1986). Laboratory life: The construction of scientific facts. Princeton, NJ: Princeton University Press.
- Lea, M. R., & Street, B. V. (1998). Student writing in higher education: An academic literacies approach. Studies in Higher Education, 23(2), 157–172. doi: 10.1080/03075079812331380364
- Ley, K., Laudanna, C., Cybulsky, M. I., & Norshargh, S. (2007). Getting to the site of inflammation: The leukocyte adhesion cascade updated. Nature Reviews Immunology, 7, 678–689. doi: 10.1038/nri2156
- Lynch, M. (1988). The externalized retina: Selection and mathematization in the visual documentary of objects in the life sciences. Human Studies, 11(2/3), 85–101.
- Lynch, M. (2006). The production of scientific images: Vision and re-vision in the history, philosophy, and sociology of science. In L. Pauwels (Ed.), Visual cultures of science: Rethinking representational practices in knowledge building and scientific communication (pp. 26–40). Hanover, NH: Dartmouth College Press.
- Maerker, A. (2011). Model experts: Wax anatomies and enlightenment in Florence and Vienna, 1775–1815. Manchester: Manchester University Press.
- Manthey, S., & Brewe, E. (2013). Towards university modelling instruction-biology: Adapting curriculum frameworks from physics to biology. CBE Life Sciences Education, 12, 206–214.
- Mayer, J., & Land, R. (2003). Threshold concepts and troublesome knowledge: Linkages to ways of thinking and practising within the disciplines. Enhancing Teaching-Learning Environments in Undergraduate Courses: Occasion Report 4. Retrieved May 2016, from http://www.etl.tla.ed.ac.uk//docs/ETLreport4.pdf
- Myers, N. (2008). Molecular embodiment and the body-work of modelling in protein crystallography. Social Studies of Science, 38(2), 163–199. doi: 10.1177/0306312707082969
- Myers, N. (2015). Rendering life molecular: Models, modellers, and excitable matter. Durham: Duke University Press.
- Osborne, J. (2010). Arguing to learn in science: The role of collaborative, critical discourse. Science, 328, 463–466. doi: 10.1126/science.1183944
- Pauwels, L. (2006). A theoretical framework for assessing visual representational practices in knowledge building and science communication. In L. Pauwels (Ed.), Visual cultures of science: Rethinking representational practices in knowledge building and scientific communication (pp. 1–25). Hanover, NH: Dartmouth College Press.
- Perini, L. (2005). Explanation in two dimensions: Diagrams and biological explanation. Biology and Philosophy, 20, 257–269. doi: 10.1007/s10539-005-2562-y
- Perini, L. (2012a). A semiotic analysis of figures in biology textbooks. In N. Anderson & M. R. Dietrich (Eds.), The educated eye: Visual culture and pedagogy in the life sciences (pp. 235–254). Hanover, NH: Dartmouth College Press.
- Perini, L. (2012b). Image interpretation: Bridging the gap from mechanically produced image to representation. International Studies in the Philosophy of Science, 26(2), 153–170. doi: 10.1080/02698595.2012.703478
- Pickering, A. (1995). The mangle of practice: Time agency and society. Chicago, IL: Chicago University Press.
- Quillin, K., & Thomas, S. (2015). Drawing-to-learn: A framework for using drawings to promote model-based reasoning in biology. CBE-Life Sciences Education, 14, 1–16.
- Radder, H. (2012). The material realization of science: From Habermas to experimentation and referential realism. Amsterdam: Springer.
- Ranaweera, A. P. N., & Montplaisir, L. M. (2010). Students’ illustrations of the human nervous system as a formative assessment tool. Anatomical Science Education, 3, 227–233. doi: 10.1002/ase.162
- Rapport, R. (2005). Nerve endings: The discovery of the synapse. New York, NY: Norton.
- Rheinberger, H.-J. (2003). Scripts and scribbles. Modern Language Notes, 118(3), 622–636.
- Rheinberger, H.-J. (1988). Towards a history of epistemic things: Synthesizing proteins in the test tube. Stanford, CA: Stanford University Press.
- Rheinberger, H.-J. (2009). Recent science and its exploration: The case of molecular biology. Studies in History and Philosophy of Science, 40, 6–12. doi: 10.1016/j.shpsc.2008.12.002
- Rheinberger, H.-J. (2010). An epistemology of the concrete: Twentieth-century histories of life. Durham: Duke University Press.
- Snudd, P., Gutierrez, E., Koltsova, E. K., Kuwano, Y., Fukdua, S., Pospieszalska, M. K., … Ley, K. (2012). ‘Slings’ enable neutrophil rolling at high shear. Nature, 488, 399–405. doi: 10.1038/nature11248
- Sreeramkumar, V., Adrover, J. M., Ballesteros, I., Cuartero, M. I., Rossaint, J., Bibao, I., … Hidalgo, A. (2014). Neutrophils scan for activated platelets to initiate inflammation. Science, 346, 1234–1238. doi: 10.1126/science.1256478
- Stafford, B. M. (1993). Body criticism: Imagining the unseen in enlightenment art and medicine. Cambridge, MA: MIT press.
- Stafford, B. M. (2007). Echo objects: The cognitive work of images. Chicago, IL: University of Chicago Press.
- Stafford, B. M. (2011). Crystal and smoke: Putting image back in mind. In B. M. Stafford (Ed.), A field guide to a new meta-field: Bridging the humanities-neuroscience divide (pp. 1–63). Chicago, IL: University of Chicago Press.
- Trujillo, C. M., Anderson, T. R., & Pelaez, N. J. (2015). A model of how different biology experts explain molecular and cellular mechanisms. CBE Life Sciences Education, 14, 1–13.
- Weisberg, M. (2012). Simulation and similarity: Using models to understand the world. Oxford: Oxford University Press.
- Whittmann, B. (2013). Outlining species: Drawing as a research technique in contemporary biology. Science in Context, 26(2), 363–391. doi: 10.1017/S0269889713000094
- Wingate, R. J. (2010). What does research-led teaching mean? In S. Lygo-Baker (Ed.), Proceedings of the excellence in teaching conference 2009, King’s College London (pp. 89–96). London: King’s Learning Institute.
- Wingate, R. J. (2011). Art, science and imagination: Visions of the brain cell. In L. Kesner (Ed.), Images of the mind (pp. 96–114). Dresden: Stiftung Deutches Hygiene-Museum.
- Wingate, R. J., & Kwint, M. (2006). Imagining the brain cell: The neuron in visual culture. Nature Reviews Neuroscience, 7, 745–752. doi: 10.1038/nrn1973