
 ?Mathematical formulae have been encoded as MathML and are displayed in this HTML version using MathJax in order to improve their display. Uncheck the box to turn MathJax off. This feature requires Javascript. Click on a formula to zoom.
ABSTRACT
Can governments contract out school management at scale? In 2016 the Government of Punjab transferred management of over 4,000 failing primary schools to private operators. Schools remained free to students. Private operators received a government subsidy per enrolled student of less than half per-student spending in government schools. This paper evaluates the effects on performance of converted schools. Comparing early converters to later converters, we estimate that enrolment in treated schools increased by over 60 percent, and test scores declined sharply.
1. Introduction
Enrolment in private schools more than doubled in low- and middle-income countries between 2000 and 2015. This represents growth of five percent per year (compared to 0.2 percent per year in government schools).Footnote1 Though private schools may offer some perceived benefits over government schools, they are typically not accessible to the very poorest due to charging higher fees. Some governments have responded by using public financing to enable poor students to access private schools.
Do such public-private partnerships (PPPs) provide fair access to privately managed schools? And if so, what type of arrangements are most cost-effective? One important distinction is between public schools that are privately managed (such as Charter schools in the US or Academies in the UK), and private schools that receive public subsidies or vouchers. There is growing evidence on voucher schemes, but much less on charter-style public school management programmes, particularly at scale and particularly in low and middle-income countries. This matters as findings from high-income contexts may not hold in lower-income countries in which the capacity of the state to provide effective procurement and regulation are likely to be particularly low.
In this study we present causal estimates of a large-scale ‘contract management’ school public-private partnership in a developing country. The Punjab Public School Support Programme (PSSP) involved the largest ever contracting out of government schools to private management in a single year. Management of 4,276 ‘failing’ government schools was contracted to a range of non-profit educational organisations and experienced individuals. Eligibility criteria for non-profit organisations included experience working in the education or social sector at sufficient scale, and for individuals included higher education and professional experience in education, or ownership of existing registered private schools. School enrolment grew by 57,514 students in the first converted schools, which represents an increase of 78 percent. We use a difference-in-difference approach to estimate the effect of school conversion on enrolment and test scores, comparing schools that converted at the start of the first school year (Phase 1) with those that converted at the start of the second year (Phase 3. We omit the Phase 2 schools that converted in the middle of the first school year).
Due to the timing of our data, we use two different approaches for estimating the effects of school conversion. In the first instance and focused on enrolment, we have data for before and after conversion by both phase 1 and phase 3 schools. We thus focus on the period in which the phase 1 schools were treated, and the phase 3 schools were not yet treated for comparison. Second, when we focus on learning outcomes, we have data for only before and after the conversion of the phase 3 schools. Thus in this case we compare the change in outcomes in phase 3 schools before and after treatment, with the change in outcomes for phase 1 schools as a comparison, as these schools are always treated throughout the period for which we have data.
We find a large increase in enrolment in the year after conversion, relative to similar schools that would only convert later. This increase is concentrated in Katchi grade (Kindergarten), suggestive of new enrolment of previously out of school children. Following conversion, schools increase their staffing levels and reduce pupil-teacher ratios. We also see a reduction in test scores in newly converted schools. More research is needed to see how much of this fall is a negative treatment effect and how much is due to sorting (for example the new enrolment of weaker students). Further follow-up could also tell us how enduring the fall in test scores is, and whether this is a temporary adjustment shock or persistent lower quality.
We contribute to a growing literature estimating the effects of different forms of public-private partnerships in education. Several papers have estimated the effects of programmes in Pakistan providing vouchers for children to attend private schools or other forms of subsidies to private schools, generally finding positive effects on both enrolment and learning (Alderman, Kim, and Orazem Citation2003; Amjad and MacLeod Citation2014; Andrabi et al. Citation2018; Barrera-Osorio et al. Citation2017; Barrera-Osorio and Raju Citation2015; Kim, Alderman, and Orazem Citation1999).Footnote2 Public-private partnerships in Pakistan have been shown to target districts with greater numbers of out of school children, and enrol poorer students than government schools (Ansari Citation2020). The programme that we study in this paper (the Punjab Public School Support programme) is different to earlier studies of subsidies to private schools, as in this case private individuals and organisations are taking over management responsibility for public schools, that remain publicly owned and free for students to attend. Under this programme over ten percent of government primary schools in the province were transferred to private management in its first year.
Evidence from high-income countries suggests that private management of public schools may be more promising than providing vouchers for private schools (Epple, Romano, and Urquiola Citation2017; Epple, Romano, and Zimmer Citation2016). The number of such schools has grown significantly in the US (to around 7,000 charter schools over 26 years – Epple, Romano, and Zimmer Citation2016), and in the UK (to around 5,000 ‘academies’ over 16 years – Eyles, Machin, and McNally Citation2017). In developing countries the evidence is more positive on vouchers and subsidies (Aslam, Rawal, and Saeed Citation2017; Shakeel, Anderson, and Wolf Citation2016), but there are fewer studies on private management of public schools.
Two studies evaluate the Partnership Schools for Liberia (PSL) pilot that involved 93 schools in its first year. A randomised evaluation found positive effects on learning, but with high and potentially unsustainable costs, and from a sample of schools that were relatively easier to access than the average school in the country (Romero, Sandefur, and Sandholtz Citation2020; Romero and Sandefur Citation2019). Two studies have looked at the Colombia Colegios en Concesión (CEC) programme that involved 25 newly built schools in Bogotá. Both studies suggest that these schools outperform traditional public schools in test scores, driven by a longer school day (Bonilla-Angel Citation2011; Termes et al. Citation2015). Another study looks at the ‘Adopt a School’ programme in Pakistan, a precursor of the programme we study in this paper. This programme involved around 1,000 schools in Punjab and 500 schools in Sindh. The study though presents only descriptive analysis without making claims for causal inference (Malik et al. Citation2015).
2. Schools in Punjab
Punjab is the largest of the four provinces in Pakistan, with a population of 110 million people. Education service delivery is largely decentralised from the federal government to the provincial governments. Like many low- and middle-income countries, Pakistan faces a learning crisis. Nearly half (43 percent) of Grade 3 children in rural Punjab are unable to read a sentence in Urdu at Grade 2 level (ASER Pakistan Citation2017). Only 73 percent of primary-aged children (6–10 years old) are in primary school, with a further 11 percent in pre-primary and 16 percent never having attended any kind of school.Footnote3 Overall enrolment rose by four percent between 2016 and 2017, or more than 450,000 students.
Private schooling began to expand in Pakistan in the 1990s. The share of private schooling in total enrolment doubled from 15 to 30 percent between 1991 and 2001 (Andrabi, Das, and Khwaja Citation2008), and continued to rise through 2011 (Nguyen and Raju Citation2014). Teachers at private schools are more likely to be female, are paid less than government teachers, and have less security of tenure (Andrabi, Das, and Khwaja Citation2008).
Pakistan has a long history of government engagement with the non-state sector in education. The federal education policy of 1972 declared ‘education will be made free and universal up to Class X [Ten] for all children throughout the country … in both Government and privately-managed schools. Private schools will be suitably supported for the loss of fees incurred by them’ (Bengali Citation1999). This position was repeated in 1992 when a new policy ‘declared the State's intent for emphasizing the private sector's role in education through “viable partnership[s]”’ … and reiterated strongly in 2001: ‘Acknowledging the shift in government's role from being a provider to a facilitator […] it is vital to rethink the parameters of public private partnership in the provision of education’ (Malik et al. Citation2015). More recently the 2017 National Education Policy has outlined specific objectives to ‘encourage, facilitate and regulate private sector education’ and to ‘promote regulated and monitored Public-Private Partnership[s] for educational development.’ The policy also recommends that ‘Innovative programmes such as “Adopt a School” programme shall be continued’ (Government of Pakistan Ministry of Federal Education and Professional Training Citation2017).
Education Public-Private Partnerships in Punjab are primarily managed by the Punjab Education Foundation (PEF), itself a quasi-independent body. PEF was established in 1991, and made autonomous in 2004. PEF has three main programmes of support for private schools, all of which have grown over the past decade. The largest programme is the Foundation Assisted Schools, through which 1.9 million children are educated in registered private schools, with fees paid by PEF. The Education Voucher Scheme supports 500,000 children. This scheme differs in that the vouchers are targeted at low-income households, and the rules state that participating school principals must accept all students holding a voucher (whereas admission discretion to Foundation Assisted Schools remains with the school). The New School Programme has contracted private organisations to build around 2,000 schools in remote and under-served areas, enrolling 250,000 students.
2.1. The Public School Support Programme (PSSP)
Most Public-Private Partnerships in Pakistan are either subsidies for private schools to accept pupils at reduced cost, or vouchers provided to students to enable them to pay the fees at private schools. Provincial governments have only more recently begun to explore ‘contract management’ arrangements similar to US Charter schools, in which private organisations are contracted to take over the management and operations of existing public schools, which remain government owned, financed, and regulated.
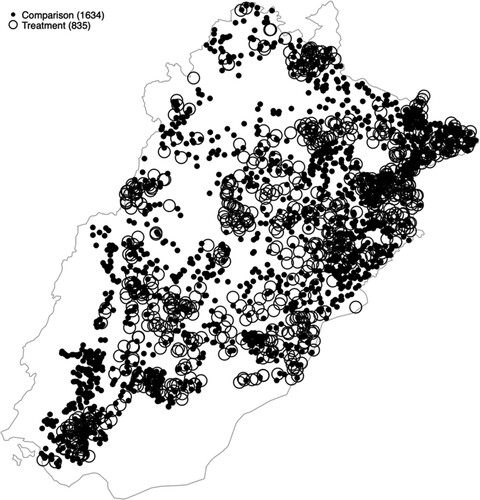
In December 2015 the Punjab government announced that it would transfer management of 5,000 failing government schools (12 percent of all primary schools) to private operators. The ‘Public School Support Programme’ (PSSP) began just four months later. Phase 1 started with the next school year in April 2016. Phase 2 began after the summer break in August 2016, and Phase 3 at the start of the following school year in April 2017. So far, 4,276 schools with over 500,000 students have been transferred. The Punjab Education Foundation (PEF) tendered schools competitively, with eligibility criteria laid out for two categories of bidders – organisations and individuals. Organisations could be existing school operators or non-governmental organisations (NGOs). Organisations must have had at least five years of experience in the education sector, and commit to taking on at least ten schools. Private individuals must have had an undergraduate level degree and at least five years of teaching experience, or own existing private schools registered with the government for at least two years. Each applicant could select the specific schools that they wanted to apply to manage, with a maximum of five schools for individuals, and minimum of ten schools for organisations. Government received 19,000 applications for the first phase of 1,000 schools. An ‘Applications Scrutiny Committee’ sat to ensure that applicants met the minimum qualifications, and then a ‘Match-making committee’ sat to select the best applicant for each individual school. Organisations were prioritised over individuals in this match-making process. Organisations with experience running schools were prioritised further. There are now around 2,600 schools contracted to organisations (each organisation has at least ten schools) and 1,700 schools contracted to individuals. Organisations are paid 700 Pakistani Rupees ($4) per child per month, and individual operators 550 Rupees.Footnote4 This is equal to less than half of government per pupil spending in public schools, which is 1,507 Rupees per pupil per month.Footnote5 Students may enter Katchi grade (Kindergarten) at age four. Each PSSP school has a 2-year contract, with renewal subject to adequate performance on ‘Quality Assurance Tests’ (QATs). In the initial phase PSSP schools fell under the remit of PEF, but have since been transferred to a separate authority, the Punjab Education Initiative Management Authority (PEIMA). PSSP schools are spread across the province, as shown in .
Figure 1. Treatment (Phase 1) and comparison (Phase 3) Schools.
Note: This figure demonstrates that there is no geographical clustering of schools by phase. We refer here to Phase 1 schools as ‘treatment’ and Phase 3 as ‘comparison’.
PSSP schools are not allowed to charge fees, make profit, or select their students, though anecdotally some schools may have engaged in some selective admissions (Afridi Citation2018). Incumbent government teachers were transferred to other government schools, with PSSP schools expected to hire their own teachers and head teachers at market salaries. Teacher salaries in private schools are typically less than half of those in government schools. Private school teachers in Pakistan are typically young unmarried women with less formal education, whereas public school teachers are more likely to be older men with more formal education. Despite the difference in teacher qualifications, private schools are typically able to elicit greater effort from their teachers, and achieve comparable or better results (Andrabi, Das, and Khwaja Citation2008). A small sample of PSSP schools reported in Afridi (Citation2018) suggests that teachers in PSSP schools are similarly qualified to those in other PEF-supported private schools. PSSP schools teach the regular curriculum, and their students sit both the standard Grade 5 exams administered to students in both public and private schools by the Punjab Examinations Commission (PEC), as well as the Quality Assurance Test (QAT) exams administered to PEF-partnering private schools for all grades. PSSP schools must meet minimum standards in the QAT for continued participation in the programme, and may be eligible for financial bonuses for good performance. The School Education Department (SED) maintains ownership of buildings and responsibility for maintenance. PSSP school operators are required to submit quarterly expenditure statements detailing how income from government was spent. Payments are made monthly to school bank accounts. For the first six months schools are due a fixed amount regardless of enrolment – after this period they are due a variable amount based on the number of enrolled students (regardless of grade). Schools continue to teach in the existing medium of instruction, using textbooks provided by the Schools Education Department (SED) or PEF. Students wear the same uniforms as those worn in government schools.
Schools were eligible to be selected into the PSSP if they met any one of five criteria – being (a) overcrowded, (b) under-utilised (with two teachers and fewer than 30 students), (c) with low enrolment (fewer than 21 students), (d) low exam pass rates, or (e) entirely non-functional (see for further detail). Overall 10,664 schools met at least one of these criteria, leaving a large number of schools that may still be selected into any future Phase 4. Executive District Officers (EDOs) were responsible for selecting which schools to recommend for transfer. The selection criteria are broadly consistent across the 3 phases, with one change being the expansion of the definition of poor learning outcomes from a 0 percent pass rate in Phase 1 to below 25 percent from Phase 2, as few schools met this criteria in Phase 1. As we show in however, this slight change in the eligibility criteria does not lead to a difference in average pass rates between the two groups in our data. Our results are also robust to excluding schools selected according to this criterion altogether (Table A2). Eligibility is laid out in . Official data reports on the aggregate number of schools selected according to each criteria, but does not specify in our school-level data which criteria each individual school was selected based on. We instead estimate this for each school, based on prior enrolment, number of teachers, and test scores in 2015–16. Our estimate performs well for criteria 1–3, but over-estimates schools selected on criteria 4 and underestimates schools selected on criteria 5. Criteria 4 (poor learning outcomes) was 0 percent for Phase 1 and then increased to 25 percent for Phase 2 and 3 due to low numbers of schools with a 0 percent pass rate.
Table 1. PSSP selection criteria.
3. Data and method
3.1. Enrolment data
We use data on enrolment from three sources; the Government Annual School Census, independent monthly monitoring data, and data collected from the Annual Status of Education Report (ASER). The timing of data collection across each source and the stages of the PSSP reform are shown in .
Table 2. Data and programme timing.
The primary source is the annual Government of Punjab School Census data (also known as the Education Management Information System or EMIS). Head teachers report in October each year. The data includes student enrolment by grade, school facilities, staffing, and location. The main weakness of the EMIS data for our purpose is that the outcome variable of interest (enrolment) is self-reported by schools. We address this by cross-checking the data against other sources. We compile EMIS data for all schools from 2012–13–2017–18.
Monitoring and Evaluation Assistants (MEAs) from the School Education Department Programme Monitoring and Implementation Unit (PMIU) visit schools each month. Assistants observe student enrolment, teacher presence, and the availability of utilities. A team of 856 assistants covers 47,725 government schools (an average of 56 schools each). Assistants enter data using a tablet-based mobile app, allowing for built-in validation checks. We only have data from this source for part of 2017, after the conversion of Phase 1 schools, so we don’t use it for our main analysis, but do use this independently collected source of data as a validation check for the self-reported EMIS data where there is overlap. Enrolment for PSSP schools reported by the monitoring and evaluation assistants is on average 1.8 students lower than that self-reported by head teachers through the EMIS. The correlation between the two measures is 0.89. Several steps are taken to ensure the reliability of data collected. Assistants are rotated across districts to discourage collusion with school staff. Third-party validation exercises have been conducted by both the School Education Department and the UK aid agency. Finally, the results of each assessment is attached to an individual assistant, whose performance is reviewed by a manager (Khan Citation2018).
The Annual Status of Education Report (ASER) is a citizen-led survey of students and schools. The survey covers over 250,000 children each year, tested at their home rather than at school to capture those not enrolled. The survey also gathers basic data about the government and private schools that are available to children, including school enrolment. The survey is conducted between September and November each year. The ASER dataset is limited to a sample of 734 schools in Punjab (of 37,078 total primary schools). Of these, there are only 28 PSSP Phase 1 or 3 schools in the ASER dataset. This is too few to be well-powered to estimate the effect of the programme. Nevertheless, we do produce very similar results to our main estimates with this small sub-sample (Table A2). The ASER dataset also allows for the validation of enrolment figures for the 734 Punjab schools that do appear in both datasets. Enrolment for PSSP schools reported in ASER is slightly higher than enrolment reported in the EMIS, though this difference is not statistically significant. The correlation between the two measures is 0.69.
3.2. Learning data
For estimating effects on learning there are two sources of data available.Footnote6 The primary source we use are the Literacy and Numeracy Drive (LND) data, collected on a monthly basis from all schools. This test is low-stakes for students and schools but high-stakes for local government. Independent School Monitoring Officers visit all public schools monthly and test a sample of five students selected at random from Grade 2 and five students from Grade 3, using a tablet-based app. Each student is given seven randomly selected multiple choice question items in Urdu, English, or Mathematics. The majority (83 percent) of schools are tested at least five times in the seven months for which we have data. We have question item-level data on 309,000 responses from students in 2,801 PSSP schools.
Second, PEF collects test data from all private schools that receive public funds under its jurisdiction as part of its accountability framework. Tests are high-stakes for schools but low-stakes for students. In primary schools tests are conducted in two randomly selected classrooms. Students sit a two-hour exam covering four subjects; English, Urdu, Science, and Mathematics. Schools that fail two consecutive QATs lose their entitlement to public funds. For a school to pass, at least half of students must pass the exam. For students to pass they must get at least 40 percent of the available marks. In our data, we have the average pass rate for all students at each school. The majority of schools in the PSSP first phase are managed by non-governmental organisations. Of these schools, 43 percent passed the QAT (Table A3). PEF provides schools with model papers and past exam papers to enable them to prepare students for the exams.
3.3. Method
The key challenge in estimating the causal effect of school conversion is finding an appropriate counterfactual. As schools were selected for PSSP based on low enrolment and exam scores, they are not comparable to all non-PSSP schools. However, schools were selected in multiple phases, allowing us to compare early and later converters, selected according to similar criteria. We thus use a standard difference-in-difference strategy, with treated and comparison schools, before and after the treated schools are treated.
Due to the differences in the data that is available for our two main outcomes (enrolment and learning), we switch which set of schools we focus on receiving treatment.
Phase 1 schools began operation at the start of the school year in April 2016, and Phase 3 schools in April 2017 (we omit Phase 2 schools that began operation mid-school year and so may have faced considerable disruption).
In the first instance looking at enrolment, where we have data on before and after both Phase 1 and Phase 3 schools are converted, we compare the change in outcomes for early converting schools with the change in outcomes for later converters. We treat schools converted in Phase 1 as treatment schools, and schools selected later in Phase 3 as comparison schools. The change in outcomes is then presented for the one school year when Phase 1 treatment schools had already been converted and Phase 3 comparison schools had not yet. In the second case focused on learning the best data is available for the period before and after the Phase 3 schools are treated, but when the Phase 1 schools have all already been treated. Thus in this latter case we consider the Phase 3 schools as the treatment schools, and the Phase 1 schools that had already been converted as the comparison schools. In both cases, we are estimating relatively short-term outcomes, a few months after school conversion.
Both treatment and comparison schools were selected into the programme according to similar criteria (with just some expansion of one threshold). Whether schools were selected into Phase 1 or Phase 3 was essentially arbitrary, as the programme was launched quickly with little preparation – just four months after being announced. shows that there is no geographical clustering of Phase 1 and Phase 3 schools, which are evenly spread across the Province.
We estimate the following standard difference-in-difference equation in which T is a binary indicator for treatment status, ‘Post’ is a binary indicator for pre or post status, are school fixed effects, and
are year fixed effects. Our main coefficient of interest is
looking at the effect of the interaction between being treated and in the post-treatment time-period. We cluster standard errors at the level that treatment is assigned – individual schools, following Abadie et al. (Citation2017).
For
to be an unbiased estimator of the true causal effect, we need two assumptions. First, that there is no time-variant group-specific unobservables – something unobserved that is specific to treatment schools, that also determines student outcomes. Second, we assume that T the effect of time on outcomes is the same for both groups. This second assumption is the parallel trends assumption. Whilst we cannot test whether trends would have been parallel in the absence of the treatment, we can test a corollary of the assumption – that pre-trends before treatment assignment should also be parallel.
4. Results
We first present descriptive statistics prior to any schools being treated. Phase 1 schools were slightly larger (average 79 pupils) than Phase 3 schools (average 72 pupils). More importantly for our purposes, the trends in enrolment for these two groups are not statistically significantly different. There are statistically significant but very small quantitatively differences between the two groups in terms of number of teachers (0.1), classes (0.1), classrooms (0.3), years in operation (1.8), and number of grade 5 exam candidates (0.5). There is no statistically significant difference between average grade 5 test scores or pass rates ().
Table 3. Baseline descriptive statistics (2015–16).
In the following analysis, we first focus on enrolment as an outcome before moving to learning outcomes. For each outcome, we present graphs of the average outcomes over time showing the degree of parallel prior trends, and regression results.
4.1. Enrolment
The first outcome we consider is the total number of enrolled students, as reported by the head teacher through the EMIS system. We estimate the overall effect to be an increase of 51 pupils (). Most of this growth (38 pupils) comes in Katchi (Kindergarten). The growth in Grade 5 is just one additional student in treatment over comparison schools.Footnote7 This increase in Grade 5 is corroborated by an independent data source – the number of exam entrants to the Grade 5 PEC exam, which also increases by one student. The increase in enrolment in Katchi is somewhat unsurprising given low baseline enrolment in preschool grades. The official entry age for Katchi is 3–4 years old, and overall enrolment of 3–4 year olds was just 21 percent according to the 2016 ASER survey. This is because limited resources at most schools means that they don’t have separate Katchi teachers or classrooms (LaRocque and Sipahimalani-Rao Citation2019).
Table 4. Effect of treatment on enrolment by grade.
Serial correlation in both the outcome and the independent variable of interest may be a concern, biasing our standard errors. We address this concern by We also clustering standard errors at the school level, and also showing robustness to collapsing the data into a single pre- and post- reform period (following Bertrand, Duflo, and Mullainathan Citation2004). We also report consistent estimates based on independently collected data (albeit with a very small sample size) from the ASER survey (Table A2). In this survey NGO staff and volunteers visit schools and record enrolment numbers taken directly from individual class registers. As a robustness check, we also estimate our main result excluding schools selected according to criteria 4 (low test scores), due to the change in the threshold used between rounds, with minimal change to the result (Table A2).
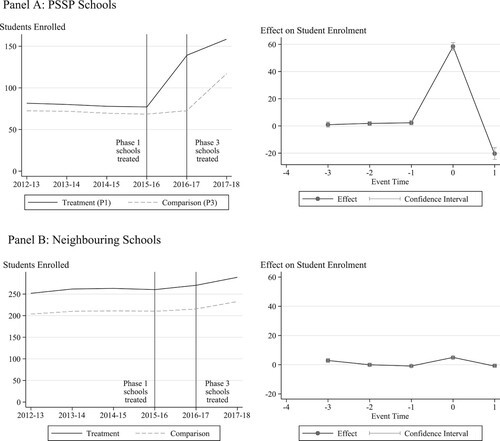
We observe a parallel trend in enrolment for treatment and comparison schools between 2012 and 2015, with a break between 2015–16 and 2016–17 when Phase 1 schools are treated and their enrolment rises. In the 2017–18 school year, enrolment continues to rise in Phase 1 schools. Phase 3 schools are also treated in 2017–18, and their enrolment begins to increases in parallel with the earlier treated Phase 1 schools. The visual inspection of the parallel trends is confirmed by statistical test, which shows that the interaction between treatment status and the year indicator is insignificant in the pre-treatment period ().
Figure 2. Enrolment trends in treatment & comparison schools. Panel A: PSSP Schools. Panel B: Neighbouring Schools.
Note: The left panel A presents trends in average student enrolment numbers for treatment (Phase 1) schools and comparison (Phase 3) schools. The right panel A presents estimated treatment effects by year (comparing Phase 1 and Phase 3 schools). Data for 2012–2016 is self-reported by head teachers in annual school census carried out in October. Data for 2017 is collected by independent monitors from the school register in August. Panel B repeats this analysis for the closest neighbouring public school of each PSSP school.
4.2. Enrolment spillovers
While we find a large effect of treatment on enrolment at PSSP schools, an important policy question is whether total enrolment increased. Did PSSP schools attract students who would not otherwise have attended school at all, or who were already enrolled in other schools? That most of the new enrolment is in Katchi grade rather than higher grades does suggest that many new students were not yet in school. But we don't know how many of those would have otherwise enrolled elsewhere. Schools may also have more actively recruited younger children, as it may be more difficult to encourage children to change schools, and schools may also want to avoid recruiting new children that would immediately be included in Quality-Assurance Tests (QATs) in grades two to five which are high-stakes for the school.
To test the likelihood of spillovers from nearby schools, we first consider heterogeneity in enrolment gains by the number of nearby schools. Whilst we don’t have panel data on enrolment at private schools, we do have data on the number of private schools within each village (Union Council) prior to the PSSP reform, from a 2015 private school census. We add this to the number of government schools. We then estimate the effect of treatment interacted with a dummy indicator for whether there are any nearby schools (in the same Union Council) or not before treatment occurs. The effect on enrolment is not statistically significantly different in villages with other schools than in villages with no other school ().
Table 5. Tests for spillovers.
We next consider spillovers from nearby government schools. We identify all non-PSSP schools within 1–3 km of each PSSP school. The median PSSP school is 2.1 km from a non-PSSP public schools. We then estimate the effect of neighbouring a PSSP school on enrolment at nearby non-PSSP schools. Results suggest that neighbouring a treated school rather than a comparison school is associated with a small increase in enrolment – the opposite of the negative effect that we would expect if enrolment in PSSP schools was driven by recruitment of students from neighbouring schools. This increase is larger for neighbouring schools that are closer (within 1 km) to a PSSP school than those that are further away (). We see similar patterns in heterogeneity in teacher numbers. The effect on neighbouring schools is largest for Katchi grades, as it is for PSSP schools themselves (Table A4).
4.3. Heterogeneity and mechanisms
Next we looking at heterogeneity by school type. Enrolment increases by more in single-sex schools than in mixed schools – 17 pupils more in male-only schools and 12 pupils more in female-only schools (). We find no difference in effect size on enrolment by other prior school characteristics, including the criteria by which they were selected into the programme, their initial size, or their age.Footnote8 Schools contracted to an NGO increased their enrolment by less than those contracted to individuals.
How and why do schools increase student enrolment? First, schools have a strong incentive to maximise enrolment as they are funded on a per student basis. This incentive is balanced against a possible risk of enrolling too many weak students who might fail the QAT test on which continued funding is contingent. Parents face no change in price that remains zero, so schools are forced to compete on quality (or at least indicators of quality that are visible to parents). One clearly visible indicator of quality is class sizes. We observe large increases in the number of teachers (from two to five), reducing pupil-teacher ratios from 35 to 25, despite the concurrent increase in student enrolment (). This increase in teachers is enabled by the substantially lower market rate for salaries in private schools – 1,407 rupees ($12) per month, compared to 7,671 rupees ($66) in government schools (Bau and Das Citation2017). Analysis of MEA data by McKinsey (Citation2017) found no change in teacher presence rates for PSSP Phase 1 and 2 schools after conversion, and no change in school facilities (boundary walls, toilets, electricity, drinking water).
Second, there are some reports that some school operators passed on some of their subsidy directly to parents. One provider, the Punjab Rural Support Programme, is reported to have offered parents 500 rupees a month per child.Footnote9 Other providers conducted weekly parent teacher meetings and events to involve parents in the school, or involved the local mosque leader to generate community buy-in. Third, some schools switched from being girl-only schools to being mixed, increasing their market size (Afridi Citation2018).
Table 6. Heterogeneity and mechanisms.
We have data from six of the eleven NGO operators from Phase 1 that allow us to identify their schools in the data. These six are all major NGOs in operation for 20–30 years. Several have fundraising offices in the United States and United Kingdom, operate large-scale community development projects, and some already operated hundreds of schools before this programme began. Here we present results disaggregated by school operator for enrolment and number of teachers. For the NGO operators as a whole, they raise enrolment by around half the amount of individual operators (). Each of the NGO operators either already ran schools (CARE and TCF) or other large social sector programmes. Individual operators were either existing private school owners, teachers, or government administrators with educational experience.
Table 7. Treatment effects by operator.
4.4. Student performance
How do schools perform on learning? Overall we see a decline in average performance in treated schools. At Grade 2 and Grade 3, a sample of students is tested each month through the Literacy and Numeracy Drive (LND). We have data for 2017, spanning the pre and post conversion period of phase 3 schools, which can be compared to phase 1 schools that had converted the prior year ().
Table 8. Effects on test scores.
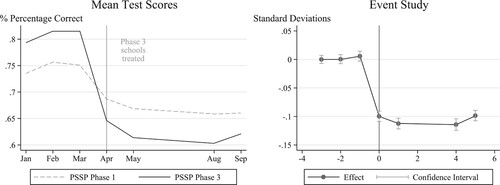
We estimate a large negative effect on average test scores (−0.26 standard deviations). We are unable to discern the extent to which this fall is due to a negative treatment effect, or an increase in enrolment of weaker students in the treatment schools. We can estimate Lee (Citation2009) Bounds by trimming the best and worst performers in the treatment schools in the post-treatment group sample. These bounds are wide – from −0.6 to +0.1 standard deviations. This effect is similar in grade 2 and grade 3, and across Maths, Urdu, and English (). There is evidence from other contexts that new school programmes can have negative short-term effects due to disruption but positive medium-term effects (Lafortune and Schönholzer Citation2021). We are unable to speak to medium-term effects in this context.
shows a parallel prior trend followed by a sharp decline in Grade 2–3 test scores for students in treated schools. Note that test scores also decline in always treated schools as a new cohort enters school in April, and are less familiar with the test items than the previous cohort was at the end of the prior school year. This decline though is much steeper in newly converted schools. Only one of the six operators (Muslim Hands) operated schools in both phase 1 and 3, allowing us to compare their performance with other schools. Their performance closely tracks the average for all Phase 3 schools (Figure A7). Trends are also similar across Math, Urdu, and English (Figure A8).
Figure 3. Trends in test scores.
Note: The left panel presents trends in average student test scores for PSSP and all schools. Phase 1 schools were converted in the prior year, and Phase 3 schools in April. The right panel presents estimated treatment effects by year, in this case treating the Phase 3 schools (newly converting) as the treatment group and Phase 1 schools (already converted) as the comparison group. Data is from the MEAs for grades 2 and 3.
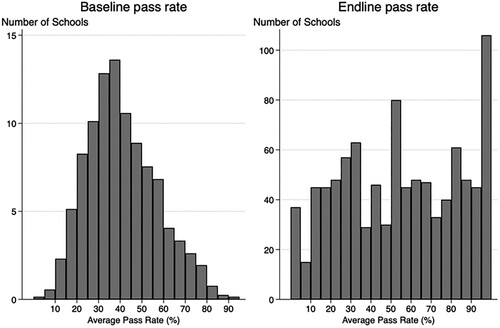
Whilst this does not affect our estimates, we also see clear evidence of gaming by schools on the high stakes QAT test. These tests are conducted at the start and end of the school year for all PSSP schools. The only publicly available data is the Endline data for Phase 1 schools (from March 2017) and the Baseline data for Phase 3 schools (from April 2017). For schools to pass the QAT test, at least 50 percent of students must pass the test. Prior to treatment, the average pass rate in schools is 41 percent, and pass rates are normally distributed across schools. After a year of operation, when tests become high-stakes, pass rates are uniformly distributed across schools, with an average pass rate of 55 percent. 31 schools report an Endline pass rate of exactly 50 percent of students (the accountability threshold), and zero schools report a pass rate of 49 percent of students. There is also a large spike in schools with 100 percent pass rates ().
Figure 4. Quality assurance tests (QAT) (2017).
Note: This figure presents the frequency of schools reporting each student pass rate on the QAT test. ‘Endline’ pass rates on the right refer to the end of the school year for schools in Phase 1, conducted in March 2017, and ‘Baseline’ pass rates on the left refer to the start of the school year for schools in Phase 3, conducted in April 2017.
5. Conclusion
In this paper we have estimated the effect of the fastest ever programme of contracting out government schools to private management. We find a large increase in enrolment, which is concentrated in Kindergarten and does not seem to be driven by recruitment for neighbouring schools. Test scores decline in contracted schools, but we are unable to say how much of this observed decline is due to a negative treatment effect or a purely compositional effect – the Lee Bounds are wide.
We are also unable to determine whether the effect on school enrolment is inherent to private management, or simply a function of a system of school financing in which schools are reimbursed on a per student basis.
Future research could usefully identify and track students who were enrolled in schools before transition, in order to get a clearer estimate of the actual treatment effect on learning outcomes.
Given the size of the non-state school market in Pakistan, it seems likely that there could be sufficient operator supply response if the government chose to further scale-up the programme.
PSSP schools reduce annual per pupil spending by government from 1,507 rupees to 550 rupees. Whilst this is a large margin, the total saving for 400,000 students is only 382 million rupees ($3.6 m USD), or around 0.14 percent of the total provincial education budget (296 billion rupees or $2.5bn USD).
This small potential saving has not actually been realised as existing teachers from PSSP schools were moved to other government schools rather than laid off. Hence an important question is how effectively those teachers are used in other schools and whether they fill gaps or duplicate existing effort. A further caveat is whether the payment of market salaries in PSSP schools is sustainable, or whether teachers may manage to lobby to receive regular government teacher salaries, as contract teaching assistants in Kenya (Bold et al. Citation2018) and India have done.Footnote10
Acknowledgements
The authors are grateful for comments and advice to Maryam Akmal, Ahmad Jawad Asghar, Jishnu Das, Edward Davis, Imtiaz Dossa, Rahila Fatima, Iftikhar Hussain, Andy McKay, Nadia Naviwala, Panu Pelkonen, Justin Sandefur, Abhijeet Singh, Anna Vignoles, participants at the International Goettingen Labour and Development Conference and Lahore School of Economics Applied Development Economics seminar series, and two anonymous referees. All errors are our own.
Disclosure statement
No potential conflict of interest was reported by the author(s).
Notes
1 World Bank World Development Indicators.
2 We also summarise this literature in Table A1.
3 Pakistan Social and Living Standards Measurement Survey 2014–15.
4 550 Rupees is the same amount provided to private schools through the Foundation Assisted Schools (FAS) programme (reaching 1.8 million students), and the Education Voucher Scheme (EVS) (reaching 0.5 million students).
5 Institute of Social and Policy Sciences report on Public Financing of Education in Pakistan 2010–11 to 2016–17.
6 A third possible source of data is the Punjab Examinations Commission (PEC) Grade 5 and Grade 8 exams. We don’t use this to estimate effects on learning however as we don’t see parallel pre-treatment trends. These exams are though a criteria for eligibility for PSSP, so we use the 2015–16 PEC scores to predict which schools would have been eligible according to this criteria. PEC exams are high stakes for students but low stakes for schools. All students in both government and private schools must pass to progress to the next level of schooling. Exams are sat in February each year. The exam is 90–150 min long for each subject, with 34 items (questions). 30 items are multiple-choice focused on knowledge, and four are open-ended focused on comprehension. PEC reports average percentage marks (from 1–100) for all exam candidates from each school in five subjects; Urdu, Mathematics, English, Science, and Islamiat.
7 We do not have access to data on student attendance, but unpublished analysis by McKinsey (Citation2017) of MEA data suggests a slight decrease in the student attendance rate of Phase 1 schools after conversion.
8 Our data does not include which school was selected according to which criteria, and so we reconstruct an estimate for each school of which criteria they were selected according to, based on available data. A comparison with actual aggregate numbers for each criteria and numbers based on our reconstruction are shown in .
References
- Abadie, A., S. Athey, G. Imbens, and J. Wooldridge. 2017. “When Should You Adjust Standard Errors for Clustering?” arXiv:1710.02926 [econ, math, stat].
- Afridi, M. 2018. Equity and Quality in an Education Public-Private Partnership: A Study of the World Bank-Supported PPP in Punjab, Pakistan. Oxfam. doi:10.21201/2018.3002.
- Alderman, H., J. Kim, and P. F. Orazem. 2003. “Design, Evaluation, and Sustainability of Private Schools for the Poor: The Pakistan Urban and Rural Fellowship School Experiments.” Economics of Education Review, doi:10.1016/S0272-7757(02)00051-1.
- Amjad, R., and G. MacLeod. 2014. “Academic Effectiveness of Private, Public and Private–Public Partnership Schools in Pakistan.” International Journal of Educational Development 37: 22–31. doi:10.1016/j.ijedudev.2014.02.005.
- Andrabi, T., J. Das, and A. I. Khwaja. 2008. “A Dime a Day: The Possibilities and Limits of Private Schooling in Pakistan.” Comparative Education Review 52: 329–355. doi:10.1086/588796.
- Andrabi, T., J. Das, A. I. Khwaja, S. Ozyurt, and N. Singh. 2018. Upping the Ante: The Equilibrium Effects of Unconditional Grants to Private Schools (No. WPS8563). The World Bank.
- Ansari, A. H. 2020. “Cream Skimming? Evaluating the Access to Punjab’s Public-Private Partnership Programs in Education.” International Journal of Educational Development 72: 102126. doi:10.1016/j.ijedudev.2019.102126
- ASER Pakistan. 2017. Annual Status of Education Report (ASER) 2016.
- Aslam, M., S. Rawal, and S. Saeed. 2017. Public Private Partnerships (PPPs) in Education in Developing Countries: A Rigorous Review of the Evidence. London: Education Partnerships Group.
- Barrera-Osorio, F., D. S. Blakeslee, M. Hoover, L. Linden, D. Raju, and S. P. Ryan. 2017. Delivering Education to the Underserved through a Public-private Partnership Program in Pakistan. National Bureau of Economic Research.
- Barrera-Osorio, F., and D. Raju. 2015. “Evaluating the Impact of Public Student Subsidies on Low-Cost Private Schools in Pakistan.” The Journal of Development Studies 51: 808–825. doi:10.1080/00220388.2015.1028535.
- Bau, N., and J. Das. 2017. “The Misallocation of Pay and Productivity in the Public Sector: Evidence from the Labour Market for Teachers.” Presented at the Policy Research Working Paper 8050, World Bank. doi:10.1596/1813-9450-8050.
- Bengali, K. 1999. “History of Educational Policy Making and Planning in Pakistan.” Sustainable Development Policy Institute.
- Bertrand, M., E. Duflo, and S. Mullainathan. 2004. “How Much Should We Trust Differences-In-Differences Estimates?” The Quarterly Journal of Economics 119: 249–275. doi:10.1162/003355304772839588.
- Bold, T., M. Kimenyi, G. Mwabu, A. Ng’ang’a, and J. Sandefur. 2018. “Experimental Evidence on Scaling up Education Reforms in Kenya.” Journal of Public Economics 168: 1–20. doi:10.1016/j.jpubeco.2018.08.007.
- Bonilla-Angel, J. D. 2011. “Contracting out Public Schools and Academic Performance: Evidence from Colombia.” Dissertation submitted to the Faculty of the Graduate School of the University of Maryland, College Park in partial fulfillment of the requirements for the degree of Doctor of Philosophy. University of Maryland.
- Epple, D., R. E. Romano, and M. Urquiola. 2017. “School Vouchers: A Survey of the Economics Literature.” Journal of Economic Literature 55: 441–492. doi:10.1257/jel.20150679.
- Epple, D., R. Romano, and R. Zimmer. 2016. “Charter Schools: A Survey of Research on Their Characteristics and Effectiveness.” In Handbook of the Economics of Education, edited by E. A. Hanushek, S. Machin, and L. Woessmann, 139–208. Elsevier. doi:10.1016/B978-0-444-63459-7.00003-8.
- Eyles, A., S. Machin, and S. McNally. 2017. “Unexpected School Reform: Academisation of Primary Schools in England.” Journal of Public Economics, doi:10.1016/j.jpubeco.2017.09.004.
- Government of Pakistan Ministry of Federal Education and Professional Training. 2017. National Education Policy.
- Khan, K. 2018. “Punjab, Pakistan: Using Open School Data to Improve Transparency and Accountability (Case Study), Ethics and Corruption in Education Series.” UNESCO International Institute for Educational Planning.
- Kim, J., H. Alderman, and P. F. Orazem. 1999. “Can Private School Subsidies Increase Enrollment for the Poor? The Quetta Urban Fellowship Program.” World Bank Economic Review. doi:10.1093/wber/13.3.443.
- Lafortune, J., and D. Schönholzer. 2021. “The Impact of School Facility Investments on Students and Homeowners: Evidence from Los Angeles.” American Economic Journal: Applied Economics, doi:10.1257/app.20200467.
- LaRocque, N., and V. Sipahimalani-Rao. 2019. “School Education in Pakistan: A Sector Assessment.” Asian Development Bank. doi:10.22617/TCS190039.
- Lee, D. S. 2009. “Training, Wages, and Sample Selection: Estimating Sharp Bounds on Treatment Effects.” Review of Economic Studies 76: 1071–1102. doi:10.1111/j.1467-937X.2009.00536.x.
- Malik, R., F. Bari, I. Muzaffar, and M. S. Khan. 2015. Partnerships for Management: Evidence from Punjab and Sindh. Lahore: Institute of Development and Economic Alternatives (IDEAS).
- McKinsey. 2017. Performance of PSSP Schools – An Independent Perspective.
- Nguyen, Quynh T., and Raju, Dhushyanth. 2014. “Private School Participation in Pakistan.” Lahore Journal of Economics.
- Romero, M., and J. Sandefur. 2019. Beyond Short-term Learning Gains: (No. CGD Working Paper 521).
- Romero, M., J. Sandefur, and W. A. Sandholtz. 2020. “Outsourcing Education: Experimental Evidence from Liberia.” American Economic Review 110: 364–400. doi:10.1257/aer.20181478.
- Shakeel, M., K. P. Anderson, and P. J. Wolf. 2016. The Participant Effects of Private School Vouchers Across the Globe: A Meta-analytic and Systematic Review.” University of Arkansas Department of Education Reform Working Paper.
- Termes, A., X. Bonal, A. Verger, A. Zancajo, L. López, Y. C. Ramírez, and A. Sierra. 2015. “Public-Private Partnerships in Colombian Education: The Equity and Quality Impications of “Colegios en concesión”.” 201ESP5Working Paper Series.