
 ?Mathematical formulae have been encoded as MathML and are displayed in this HTML version using MathJax in order to improve their display. Uncheck the box to turn MathJax off. This feature requires Javascript. Click on a formula to zoom.
ABSTRACT
We analysed the spatial conditions for Car Dependency (CD) in three European cities and their suburbs, to investigate the following research question: What are the potential travel mode alternatives to the car, and how do they relate to actual travel behaviour? We defined CD as the lack of alternative transport modes to the car for reaching daily destinations. We selected three mid-sized city regions with different planning traditions and travel behaviour: Eindhoven, Southampton and Aachen. The results demonstrate that the differences in CD in the three cities are not substantial. The suburbs show a substantially higher CD than the city proper; however, when considering the e-bicycle as an alternative transport mode, this difference decreases. Daily amenities are largely within walking distance, in cities as well as in suburbs. For the daily commute there seems to be great potential for the (e)-bicycle as most employees, living both in the cities and their suburbs, currently live within 15 km of their jobs. Overall, our research shows that the differences in the actual modal split in the three cities cannot be explained by differences in the spatial conditions for CD.
1. Introduction
1.1. An overview of the literature
In the areas of transport policy, transport research and urban planning there seems to be a consensus on the need to provide alternatives to the car in urban areas (e.g.: Rogers Citation1997; Girardet Citation2004). However, to what extent this is possible and how dependent people are on cars in their daily lives needs to be further examined. A considerable body of literature focuses on the relationship between the built environment (land use and infrastructure) and car use (e.g.: Newman and Kenworthy Citation1999, Citation2006; Kenworthy and Laube Citation1999; Wegener and Furst Citation1999; Bagley and Mokhtarian Citation2001; Tayal, Anantuni, and Burns Citation2001; Van Wee and Maat Citation2003; Bento et al. Citation2005; Geurs and Van Wee Citation2006; Van Wee Citation2009a, Citation2009b). However, car use is not the same as car dependency (CD). CD is defined by the lack of alternative transport modes to the car in terms of time, cost and effort in accessing destinations. Jeekel (Citation2013) distinguishes objective and subjective CD. Sometimes people use cars even when compatible alternatives are available; however, other times, compatible alternatives are simply not available, and these are the most challenging situations. In this respect, the relevant question seems whether and to which extent the built environment shapes structural ‘constraints and possibilities’ for behavioural change, or in other words, how the built environment allows ‘potential’ (rather than ‘actual’) travel choices (Handy Citation2017; Urry Citation2004).
Handy (Citation1993) has described the current built environment as resulting from the so-called cycle of CD. In the post-war era, cities in the Western world have been adapted to the widespread use of cars, changing the pattern of daily amenities and economic activities, resulting in ever increasing car dependence, especially in the US but also, to a lesser degree, in European cities and towns. It is, therefore, interesting to explore to what extent this ‘cycle of CD’ has influenced the built environment of cities, which in turn provides a structural barrier to the effort to promote alternative transport modes. Attempts to explore the relationship between the built environment and the CD of urban populations were undertaken by Stradling (Citation2007), for rural and urban areas in Scotland, and Silva and Pinho (Citation2010), for Porto. However, these studies stop short of identifying the underlying spatial determinants of CD. Wiersma et al. (Citation2016) took a first attempt in this direction, comparing travel choices to daily destinations in different urban and suburban areas in the Netherlands, and exploring the potential for utilizing alternative transport modes as determined by the spatial characteristics of these areas. Confronting these results with actual travel behaviour also led to the conclusion that although the use of alternative modes, especially the bicycle, is currently relatively high in Dutch cities, there is still substantial room for improvement (in cities as well as suburbs), especially due to the potential of the e-bicycle (Wiersma Citation2020).
1.2. Knowledge gap and research questions
The research described above is part of a relatively unexplored field of knowledge: the necessary spatial conditions for the potential use of alternative transport modes.
First notable attempts focused on the Netherlands (Wiersma et al. Citation2016, Citation2017; Wiersma Citation2020), and the paper expands this research at the European level, by focusing on mid-sized urban and suburban areas in different European countries. The expanded scope is valuable for several reasons. First, mid-sized cities and their surrounding suburban areas are a particularly relevant case because a large portion of the overall European population lives there, while only a minority lives in large metropolitan areas like London or Paris (Giffinger and Meyers Citation2007, Eurostat). Second, the surrounding suburbs are deliberately included in the research; they form an integral part of the daily urban system of mid-sized cities, while presenting markedly different spatial conditions. Third, we want understand to what extent the Dutch built environment, with its highly urbanized context and shaped by a strong planning tradition, is typical for the European case, i.e. to examine the generalizability of previous research findings.
The following research questions have been formulated:
To what extent does the spatial structure of mid-sized European city regions shape CD conditions?
To what extent are these spatial conditions related to ‘actual’ travel behaviour?
2. Research method
2.1. Research object
In order to examine the research questions, we selected three different European mid-sized cities: Eindhoven (the Netherlands), Southampton (the United Kingdom) and Aachen (Germany). While they are of comparable size and with similar urbanization patterns, all were shaped by markedly different post-WWII planning traditions and are distinguished by unique travel behaviours. The English, German and Dutch planning systems are particularly relevant as cases, due to the different roles that local and regional authorities play in planning practice (Oxley et al. Citation2009). The Dutch and German planning systems are more proactive in guiding spatial development than the English one; however, there are also differences between the Dutch and German system. Dutch planning practice has been determined by the national government (at least until 2005), while Germany is a federal country, where the states (Länder) and their planning systems are more independent from the national level than the Dutch provinces and their planning systems (Oxley et al. Citation2009). It is interesting to see if these differences in planning traditions have resulted in different spatial conditions, and possibly could explain the differences in travel behaviour.
The case study cities (see ) are all mid-sized cities (200,000–250,000 inhabitants), situated in daily urban transport systems that serve around one million inhabitants. For the modal split of all trips, EPOMM data were available for the three cities. For the modal split of commuting we used the available sources for each city.
Table 1. Urban and regional population, modal split, and car ownership in case study cities.
In Eindhoven active modes dominate (53% for all trips, 47% for commuting trips), especially bicycles (40% and 42%, respectively). In Aachen the private car dominates, but active modes still reach about one-third of total trips (34% for all trips, 27% for commuting trips). In Southampton the picture is mixed: for all trips public transport is the second most-used mode after the car, but for commuting active modes reach 28%. The research aims to investigate to what extent the spatial conditions of these urban areas allow their inhabitants to use alternative transport modes as a ‘potential’ alternative to car use for accessing destinations, irrespective of their current actual use.
2.2. Research method
2.2.1. Daily and incidental destinations
To explore the relationship between the built environment and CD, it is useful to define different levels of CD. These levels describe not only ‘if’ people are CD, but also to what extent. Our research focuses on the accessibility of ‘daily’ destinations, because having no alternatives to the car for reaching daily destinations like supermarkets, schools and jobs does not only result in extensive use of cars, but also is a strong incentive for car ownership (Cervero, Golub, and Nec Citation2006; Litman Citation2020; Kent Citation2018). Additionally, owners of cars tend to use them also when alternative transport modes are available (Harms Citation2003; Urry Citation2004; Baptista, Melo, and Rolim Citation2014). In contrast, weekly and monthly trips to destinations, for social or leisure purposes, are far less frequent and – even if they would require the use of a car – do not necessarily promote car ownership (e.g. car-sharing or renting provide viable options) (https://ritjeweg.nl).
2.2.2. Necessary and sufficient conditions
This paper seeks to explore the necessary spatial conditions for the potential use of alternative transport modes, irrespective of their actual current use. In this context, we distinguish between basic or ‘necessary’ conditions for car dependency, i.e. patterns of land use and infrastructure, like roads and railways, and additional or ‘sufficient’ conditions, being quality of infrastructure and level of service of public transport (Wiersma Citation2020). For instance, we consider an acceptable distance to destinations as a necessary condition for the use of bicycles: it makes cycling a potential option, but this in itself may not be enough to spur a modal shift towards cycling. When the former condition is present, making roads to destinations safer for bicycles is an example of what could be a sufficient condition. This is a relative cheap and short term measure, nevertheless, it could actually shift travel behaviour towards cycling. This distinction also applies to public transport. A basic or necessary spatial condition for regional public transport would be a rail connection and the presence of activities near stations. Additionally, in order to offer an acceptable alternative for the car the level of service on that rail track is also important. However, this sufficient condition (level of service) is relevant only if, where and when the necessary condition exist (e.g. a rail tracks). Our research focuses on the basic or necessary conditions, as they shape long-term conditions and are difficult and costly to change, whereas the additional or sufficient conditions can be shaped according to short – or mid-term policies. Finally, the presence of necessary and sufficient conditions, offering competitive alternatives to the car in physical terms, such as distance to destinations within walking or bicycling distance, or levels of public transport offering a comparable door-to-door travel time, does not guarantee a modal shift; also elements of a non-spatial nature, such as parking costs, habit, culture and state of awareness and personal characteristics, shape the behavioural change potential. Assessing necessary conditions is fundamental, as they lay the ground to address personal characteristics and other behaviour-related factors.
2.2.3. Alternative transport modes
In the three case cities, we will compare the potential use of alternative transport modes (ATMs) for accessing daily destinations. In our research we consider walking, the bicycle, the e-bicycle, public transport (PT) and their combinations as alternative transport modes. We are aware that, compared to the Dutch situation, the bicycle is used much less frequently in most European countries. Second, the e-bicycle is a relatively new mode of transport, also in the Netherlands. However, and as stated above, we try to explore the necessary spatial conditions for the ‘potential’ use of alternative transport modes, irrespective of their ‘actual’ current use.
2.2.4. Distance to and accessibility of daily destinations
We distinguish two groups of daily destinations: daily amenities and jobs (see ). First, we map the distance to daily amenities (, left). Primary schools and large supermarkets or shopping centres are taken as daily amenities, which are deemed accessible by a reasonable alternative to the car if they are located within 1 km from homes (maximum walking distance). We derive the locations of primary schools and supermarkets from Google Maps (Google Maps), calculating the percentage of inhabitants within a 1 km catchment area. We use the subdivisions of the traffic models of the Städteregion Aachen, of the Netherlands (RWS), and the wards of the UK as units to obtain the number of people and jobs in the catchment areas. The catchment areas of amenities (1 km) are circles and thus do not coincide with administrative boundaries. Some administrative units are fully covered by a catchment area, others only partly. We assume a uniform distribution of populations within these boundaries to estimate the population share within and outside the catchment areas.
Figure 1. Left: % of population CD in accessing daily amenities. Middle: % of employees CD in reaching their workplace. Right: % of population CD in accessing amenities, added up with % of employees who are CD in reaching their workplace.
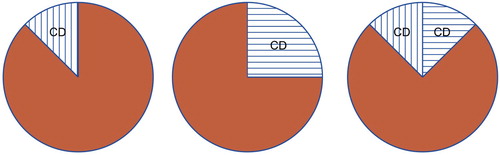
Second, (, middle) we map the distance to and the accessibility of workplaces by ATMs. We calculate the percentages of employees with jobs located within 7.5 km (maximum cycling distance) and 15 km (maximum e-bicycle distance) from their home. We regard these as accessible by a reasonable alternative to the car, as they are considered to be the maximum distances people are willing to travel with these transport modes, based on the fact that 90% of all trips by bicycle resp. e-bicycle takes place within these distances (KPVV Citation2012; Schaap et al. Citation2015). It must be kept in mind that some workplaces located within 7.5 and 15 km could possibly also be accessible on foot or by local PT; however, this opportunity would not change the outcomes for the score of alternative transport modes.
We derive our calculations from the following sources: NTS UK (Citation2011); CBS (Citation2018); Inkar (Citation2013), and Städteregion Aachen (Citation2013). Some caution is needed due to the different sources from different countries. A substantial part of the data for the Southampton case is derived from the 2011 National Travel Survey, while the data for the other two is from more recent years: 2014 for Eindhoven (CBS Citation2018) and 2013 for Aachen (Städteregion Aachen Citation2013). Local public transport (defined by distances up to 15 km, having no separate lanes) is also a potential alternative transport mode. However, firstly, from a theoretical point of view, it may be questionable whether services of local PT are to be considered as spatial necessary conditions for CD in the way we define these. In our definition, local PT services would be defined as sufficient conditions within the spatial framework of the necessary conditions determined by distance (see Section 2.2.2.). Second, from an empirical point of view, it may well be that in some cities these bus services are offering competitive alternatives for car trips, but as we considered all daily amenities within 1 km and workplaces within 15 km as ATM accessible (walking, bicycle, e-bicycle or local public transport), a separate research on the competitiveness of local public transport would not change the outcomes of this study as workplaces within these distances are already considered as not CD. In conclusion, while we believe that a detailed analysis of local PT services would provide relevant information on the sufficient conditions for CD, we also feel that it goes beyond the scope of this paper.
We are aware of the fact that for distances up to 15 km one cannot consider everybody to use the (e-)bicycle and/or for all times (e.g. outside of the summer months or when it rains). In this case, the bus would be a realistic alternative; however, from previous research (Wiersma, Bertolini, and Straatemeier Citation2017) it appeared that in Dutch mid-sized city regions comparable with our three cases, more jobs were accessible by e – bicycle than by public transport in the same door-to door travel time. Compared to the (e-) bicycle longer door-to door travel times by public transport must be assumed, raising questions about the competitiveness of this option. Research shows that in the Netherlands, where users can easily use bicycles, most people see local buses only as a fall-back option (KiM Citation2018). Outside the Netherlands the bicycle is much less used and public transport is often considered as the only alternative for the car for destinations beyond walking distance. Future research could examine these issues in further detail. For commuting distances beyond 15 km within the daily urban system (roughly defined by a 30 km range from the city centre, approximately 30 min by car), we consider the bike-train-walk combination as the most competitive car alternative (Debrezion, Pels, and Rietveld Citation2007; Staps Citation2014; Schakenbos et al. Citation2015; Kager, Bertolini, and te Brömmelstroet Citation2016). In this respect we consider rail infrastructure, or bus infrastructure separated from other traffic (BRT), as a necessary spatial condition, as well as concentration of jobs and residents near stations.
To compare the spatial conditions of the bike-train-walk system, we introduce the concept of ‘origin-destination match’ of commuters and jobs. Within the bike-train-walk option, we assume that jobs within 500 m from a railway or BRT stop (post haulage acceptable walking distance) are accessible for those employees residing within 2.5 km from a railway station (pre haulage acceptable bicycling distance). We further assume that for these employees, the percentage of jobs located near public transport opportunities is the same as the regional average (roughly defined by a 30 km range from the city centre) and that the number of these employees living near public transport opportunities is the same as the regional average. Consequently, the percentage of employees with alternative transport mode options to their jobs per city reflects: (1) those whose actual workplace is within (e-)bicycle distance, and (2) the average chance that those holding jobs beyond these distances can access their workplace by the bike-train-walk combination (, middle). We used the subdivisions of the traffic models of the Städteregion Aachen, the Netherlands (RWS) and the wards of the UK as units to obtain the number of people and jobs in the described catchment areas of stations, assuming the same conditions as above.
Third (, right) we map the necessary spatial conditions for car dependency of the total population of each city and suburban area. We determine the percentage of all inhabitants living beyond 1 km from amenities, who we consider to be CD. Furthermore, from those who are not CD in their access to amenities, some still have to commute to CD locations. To determine the car dependency of the whole population we add up these two groups (, right), using the following formula:
Finally, we compare the car dependency of the inhabitants of these cities with the current modal split, to examine to what extent the spatial layout of these cities provides the necessary conditions for behavioural change (mode shift).
3. Findings
3.1. Distances to daily amenities
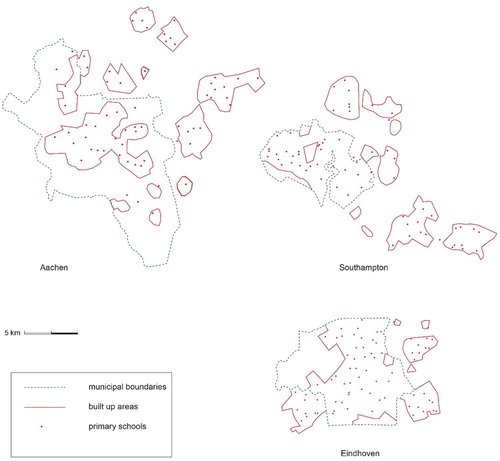
and show the location of supermarkets and primary schools within the built environment of the cities and their suburban areas, excluding large green and industrial areas within municipal borders. We selected the areas of suburban municipalities immediately adjoining central cities, as they are an integral part of the urban transport system for daily trips.
Figure 2. Location of supermarkets within the built-up areas of Eindhoven, Aachen and Southampton and their surrounding suburbs. Source: Google Maps.
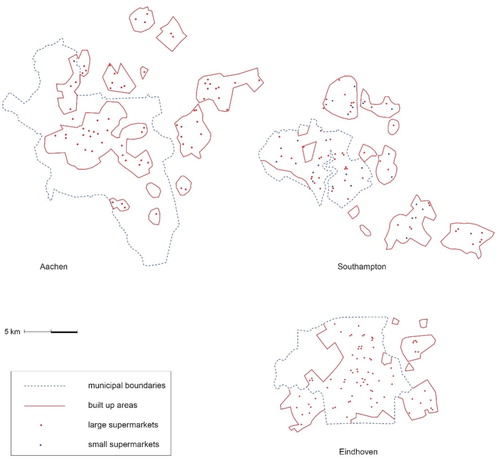
Figure 3. Location of primary schools within the built-up areas of Eindhoven, Aachen and Southampton and their surrounding suburbs. Source: Google Maps.
reports the percentages of inhabitants that have such daily amenities within 1 km from their homes and the percentages of inhabitants using active modes. It must be kept in mind that the data on the use of active modes relate to all destinations, not only daily destinations. Here and elsewhere, we made a distinction between city and suburbs. Cities are defined as the built-up areas within the municipal borders of Eindhoven, Aachen and Southampton, and suburbs are defined as the built-up areas of the municipalities immediately surrounding these cities.
Table 2. Percentages of inhabitants with access to daily amenities within walking distance.
From and 3 and we can conclude that all three cities have comparable distances to amenities – the vast majority of residents (86–95%) lives within 1 km of the nearest primary school and supermarket. In the suburbs this figure lies between 72% and 77%. Second, supermarkets and primary schools are within acceptable cycling distance (2.5 km, see Van de Coevering Citation2013) for all inhabitants of the cities and surrounding suburbs. Third, the differences in the actual use of active modes in the three cities (53% for Eindhoven, 34% for Aachen, and 17% for Southampton) cannot be explained by the differences in CD in relation to daily amenities. The relatively high score for supermarkets in Southampton and its suburbs is partly explained by the recent expansion of Tesco Express, small neighbourhood supermarkets. As they are not quite comparable with the bigger supermarkets in the other cities, we also showed the percentages without Tesco Express.
3.2. Distances to workplaces
The data in show the percentages of employees living within bicycle and e-bicycle distances from their actual workplaces, compared with the actual use of active modes for commuting, derived from . The relatively high proportion of active modes in Eindhoven cannot be explained by differences in workplace – home distance (e.g. in Aachen these distances are even shorter).
Table 3. Percentages of employees with access to their workplace within bicycle and e-bicycle range, and use of active modes.
The noted differences between the individual cities and between the cities and their suburbs are even further reduced when looking at jobs within e-bicycle distance – while the gap between potential use and actual use becomes bigger. This can be explained by the fact that, even in the Netherlands, the e-bicycle is still not widely used. However, the data demonstrate the substantial potentials of the e-bicycle for daily commutes in the case study areas.
3.3. Accessibility of workplaces by the bicycle-train-walking combination
The data in shows (1) the percentage of employees that can reach a railway station by bicycle; (2) the percentage of jobs within walking distance from a railway station (within a 30 km range from their homes); and (1 × 2) an origin-destination match, indicating the percentage of employees that potentially can reach employment by the bicycle-train-walking combination (Kager, Bertolini, and te Brömmelstroet Citation2016). It must be kept in mind that this refers not to actual jobs these employees have, but to the potential jobs they can access.
Table 4. Percentages of employees with access to a workplace within a 30-km range by the bicycle-train-walking combination.
Southampton and suburbs have relatively high scores, partly explained by the fine-grained regional railway network in the Hampshire region. The current level of service (interval, capacity during peak hours, etc.) is not taken into account in this analysis; as we are interested in comparing the necessary spatial conditions, being infrastructure availability and densities of population and jobs around station areas. However, to be competitive with the car, a frequency of 15 min would be an additional sufficient condition.
3.4. Accessibility of workplaces by ATMs
The data from and 4 are combined in . The left column shows how many employees have a workplace within bicycling distance. In principle, all could use the bicycle as a possible ATM for their daily commute. Within this distance, however, some could also have an acceptable or – in their view – even better alternative to the car by walking (if their job is within walking distance) or by using public transport, depending on the quality of local bus services. The middle column shows how many employees can use ATMs for their commute trip within 15 km, if we include the e-bicycle as an ATM. The right column shows how many employees can use an ATM to access workplaces located further than 15 km, when including the bike-train-walk option.
Table 5. Percentages of employees who can access their workplace by ATMs; left walking, PT and bicycle; middle also including e-bicycle; right also including bike-train-walk.
Taking a closer look at Eindhoven city, 25% of employees work at a location beyond e-bicycle distances, and, of these 13% have an origin – destination match accessible by the bike-train-walk combination (see ). The combined results yield a total percentage of 75%+ 25% * 13% = 78% of employees having viable alternatives to the car. The added value of regional rail-based Public Transport in commuting seems modest, compared to the potentials of bicycle and e-bicycle (to be further discussed in the conclusions section below). Second, although in cities the distance to work shows more potential for ATM than in suburbs, including the e-bicycle, this difference becomes substantially smaller, demonstrating the strong potential of the e-bicycle, especially in the suburbs.
3.5. CD in relation to accessibility of workplaces and actual car use for commuting
The data in shows the percentage of car-dependent commuters and actual car use for commuting. By fully utilizing the potentials of the e-bicycle and the bicycle-train combination, car use for commuting in Eindhoven could be reduced by more than half (from 50% to 22%), while in Aachen and Southampton it would fall by almost two-thirds (from 58% to 17% and from 60% to 21%, respectively).
Table 6. Percentages of CD employees due to workplace locations outside bicycle and e-bicycle distance and not served by transit, compared with actual car use as percentage of total commuting trips.
3.6. Accessibility of daily destinations
The data in shows the combined results, giving an overall insight into the level of CD of the population of the three cities and suburbs in their daily activities. As shows, there are slight differences between the accessibility of supermarkets and of primary schools. However, to create an overall view, we based the CD to daily amenities on the accessibility of supermarkets (1) as they concern the total population, whereas the proximity to primary schools is only relevant to households with children up to 12 years old (in Eindhoven only about 10% of households) (CBS Statline), and (2) the proximity of primary schools is higher than that of supermarkets in most cases.
Table 7. Percentages of the total population being CD in reaching daily destinations (amenities beyond 1 km and workplaces beyond 15 km and not accessible by bike-train-walk-combination), confronted with actual car use.
Taking the city of Eindhoven as an example, only 5% of the population lives more than 1 km from daily amenities and is thus CD in this respect. From the remaining 95%, on average 52% are employed. These are data on the percentages of people in employment within the municipal boundaries. Of these employees 22% are CD in relation to these jobs. This means that 21% of the total population in Eindhoven city faces CD for reaching daily destinations (5% + 52% x 95% x 22% = 16%). The low CD in the city of Eindhoven is mainly caused by the relatively short distances to daily amenities (only 5% CD). The percentages in Aachen and Southampton are somewhat higher (14% and 11%, leading to CD of 21% and 23%, respectively). However, if we consider the Tesco Express supermarkets as having a reasonable choice of daily products, Southampton’s percentages (14%) almost equal Eindhoven’s (16%). In all cases, these percentages do not explain the much higher share of car use (more than double) in the three cities. It must be kept in mind, though, that the actual car use includes more trips than only to daily destinations and jobs. The CD of inhabitants of the suburban areas of the three cities is substantially higher, about double, and quite similar across the three cities.
3.7. Accessibility of daily destinations (amenities by bicycle and jobs by the bicycle, e-bicycle and bike-train-walk combination)
Up to now we considered 1 km as a maximum (walking) distance to daily amenities, like shops and primary schools. A common practice in the Netherlands is the use of the bicycle to daily amenities, instead of walking. This changes the necessary spatial conditions for car dependency in the sense that the maximum distance to amenities increases to 2,5 km (Van de Coevering Citation2013). The data in shows the combined results, similar to , with the difference that the bicycle is considered as an alternative transport mode to the car for accessing daily amenities. Following this assumption, the CD to daily amenities is 0% in all cases. This finding highlights the potential of the bicycle for reducing the overall CD of the inhabitants of cities and suburbs substantially.
Table 8. Percentages of the total population CD in reaching daily destinations with alternative modes (amenities beyond 2,5 km, and workplaces above 15 km and not accessible by bike-train-walk-combination), confronted with actual car use.
4. Conclusions and discussion
4.1. Research questions
This study examined (1) to what extent does the spatial structure of mid-sized European city regions shape CD conditions, and (2) to what extent are these spatial conditions related to actual travel behaviour. Regarding the first question, what stands out is that the three European urban areas with their different planning traditions and travel behaviour, seemingly have no major differences in their spatial conditions for CD. Amenities are located within walking distance (1 km) for the vast majority of residents (86% to 95%). In the surrounding suburbs this percentage lies between 72% and 77% (see ). In both cities and their suburbs all supermarkets and primary schools are within cycling distance (2.5 km). Employed persons are on average more CD than people without jobs. The percentage of CD in accessing workplaces varies between 17% and 22% in the city and in the suburbs between 24% and 29% (see ). For the total working and non-working population, we found that the spatial conditions in the three cases account for between 14% and 21% of the total city populations being CD and in the suburbs for between 33% and 38%. However, if Tesco Express is not counted as a full-service supermarket, highest CD is found in the Southampton area, 23% for the city and 43% for its suburbs.
Looking at the second question, the findings indicate that in all three cities there is substantial room for reducing car use. The spatial structure of cities shapes CD conditions for 14% to 21% of their population, falling to between 9% and 11% when considering cycling to amenities instead of walking. However, actual car use in cities varies between 42% and 59% of all trips (see , 7 and 8). Thus, car use in all cities is substantially higher than the recorded CD for daily destinations. It must be kept in mind, however, that the data in on actual use of transport modes (so-called modal spit) include ‘all’ trips (other daily leisure trips, as well as trips to weekly or monthly destinations). As the findings relate to the spatial determinants for CD in relation to daily destinations, we cannot provide an estimate of all (daily and non-daily) avoidable car trips. For commuting, however, a more precise picture emerges: 17% to 22% of employees are CD, while actual car use is between 50% and 60% (see ).
4.2. Reducing car use
The figures reveal the scale of potential changes in travel behaviour; however, they do not prescribe a path towards or predict behavioural change. There seems to be no direct relation between the spatial conditions for CD and actual travel behaviour. This is illustrated by our findings that although the necessary spatial conditions are quite comparable in the three cities, travel behaviour is quite different. We described the basic necessary conditions for CD as distances to destinations as well as density of population and workplaces around transit stops. However, these basic conditions are not always sufficient to make the alternatives competitive with the car. Other conditions, like safe bicycle paths or a lively cycling culture, are likely to be the main explanation for the current differences in the noted modal split and can, in this sense, be seen as ‘sufficient’ conditions. It is often assumed that, apart from short distances, flat surfaces are a condition for the widespread use of the bicycle. It must be kept in mind, however, that in this respect there is an important difference between the potentials of the bicycle and the e-bicycle, as the latter is also suitable for hilly conditions. The question remains whether meeting the above-mentioned conditions (and acknowledging all nuances) would actually lead to a modal shift. This is not a simple question to answer. Travel behaviour change is a complex phenomenon, with many dimensions including, but not limited to, the built environment (Van Acker, Van Wee, and Witlox Citation2010; Mokhtarian, Salomon, and Singer Citation2015). Accordingly, to instigate a modal shift in practice, policy packages that combine many different types of measures are needed (Givoni et al. Citation2013; Van Wee et al. Citation2014).
The e-bicycle shows promising potential in suburbs in relation to the access of jobs and tends to level out the differences in CD between cities and their suburbs, as most commuters live within 15 km of their workplaces. Safe and comfortable infrastructure and the promotion of a cycling culture could realize these spatial potentials, shifting from dominant car use to dominant bicycle and e-bicycle use for daily trips. However, through ongoing specialization workplaces located beyond the 15 km threshold may become more common (Tordoir, Poorthuis, and Renooy Citation2015). In this case, regional public transport (combined with the bicycle or e-bicycle) seems to be the only competitive alternative to the car. Compared to the potentials of bicycles and e-bicycles to replace car trips, the value of the bike-train-walk option in the daily urban system of mid-sized cities and their suburbs seems modest. This is due to the low shares of workplaces situated near stations (19% to 35%) and of inhabitants living within bicycle distance from stations (50%), which severely restrict the travel mode choice for daily commutes. The most obvious policy implication would be the concentration of specialized jobs near railway stations (TOD) or providing BRT services to campuses and research centres at highway locations (Wiersma, Bertolini, and Straatemeier Citation2017; Goudappel Citation2015).
Furthermore, it should also be emphasized that both local and regional Public Transport have an important role to play in meeting the mobility needs of the so-called captives of public transport: those who do not have access to or cannot drive a car, and for whom the bicycle or e-bicycle is also not an option (e.g. seniors or handicapped persons, or visitors from outside the region).
Distance to daily amenities is an important spatial determinant for CD as it affects the entire population (working and non-working). However, distances might increase as a result of upscaling processes (i.e. a shift towards fewer and larger schools and supermarkets), especially in post-growth or shrinking regions (Wiersma, Bertolini, and Straatemeier Citation2017). This threat stresses the importance of avoiding such a possible ongoing upscaling of daily amenities.
4.3. Reducing car ownership
Our research focused on daily trips and did not look at CD for incidental trips (e.g. social or recreational purposes, family visits, cinema, etc.). However, it must be noted that about half of all mobility in the Netherlands is for social-recreational purposes. Recent research has revealed that 57% of these trips in the Netherlands are within 7.5 km (bicycle reach) and 78% fall within 15 km (e-bicycle reach) (Harms et al. Citation2015). Also other trips could very well be car dependent (e.g. travelling with young children, special or heavy loads), and in such cases car use may be necessary. Clearly, avoiding CD in relation to daily destinations does not mean never using a car; however, the resulting data does provide insights into the potentials of a car-free lifestyle (renting or sharing instead of owning). Additionally, car owners tend to use their vehicles also when alternative transport modes are available (Harms Citation2003; Urry Citation2004; Baptista, Melo, and Rolim Citation2014). Weekly and monthly trips for social or leisure purposes, are far less frequent and – even when requiring car use – do not necessarily promote car ownership (e.g. car-sharing or renting are viable options) (https://ritjeweg.nl). Seen from this point of view, the outcomes of this study highlight the potential for reducing car use – and potentially also ownership – which could relieve the built environment from the pressures of large private vehicle numbers.
4.4. Contributions of the study and further research
This study provides a conceptual and operational instrument to measure the impact of spatial conditions on travel choice in different environments. It enables researchers to asses where, for whom, and to what extent local spatial conditions allow for a behavioural shift away from car use. The study demonstrates that despite the fact that during the past decades the spatial structures of European city regions have been adapted to widespread car use, it seems that only a minority of inhabitants are CD, justifying measures that promote alternative modes (cycling) or disincentivize personal car use and ownership (car sharing). Examining to what extent these conditions are present in comparable city regions in other parts of Europe or elsewhere is one potential avenue for future research.
Disclosure statement
No potential conflict of interest was reported by the author(s).
References
- Bagley, M., and P. Mokhtarian. 2001. “The Impact of Residential Neighbourhood Type on Travel Behaviour: A Structural Equations Modelling Approach.” The Annals of Regional Science 36 (2002): 279–297. doi:10.1007/s001680200083.
- Baptista, P., S. Melo, and C. Rolim. 2014. “Energy, Environmental and Mobility Impacts of Car- Sharing Systems. Empirical Results from Lisbon, Portugal.” Procedia – Social and Behavioral Sciences 111: 28–37. doi:10.1016/j.sbspro.2014.01.035.
- Bento, A., M. Cropper, A. Mobarak, and K. Vinha. 2005. “The Effects of Urban Spatial Structure on Travel Demand in the United States.” The Review of Economics and Statistics 87 (3): 466–478. doi:10.1162/0034653054638292.
- CBS Statline regionale kerncijfers. 2018. fromstatweb Banen van werknemers; afstand woon-werk (2006–2014). https://opendata.cbs.nl/statline/#/CBS/nl/dataset/81251NED/table?
- Cervero, R., A. Golub, and B. Nec. 2006. San Francisco City Car Share, Longer Term Travel Demand and Car-Ownership Impacts. Berkeley: Institute of Urban and Regional Development University of California.
- Debrezion, G., E. Pels, and P. Rietveld. 2007. “The Impact of Railway Stations on Residential and Commercial Property Value: A Meta-Analysis.” The Journal of Real Estate Finance and Economics 35 (2): 161–180. doi:10.1007/s11146-007-9032-z.
- EPOMM. http://www.epomm.eu/tems/result_city.phtml?city=74.
- Eurostat. https://ec.europa.eu/eurostat/web/cities/data/database.
- Geurs, K., and B. Van Wee. 2006. “Ex-post Evaluation of Thirty Years of Compact Urban Development in the Netherlands.” Urban Studies 43 (1): 139–160. doi:10.1080/00420980500409318.
- Giffinger, R., and E. Meyers. 2007. City Ranking of European mid-Sized Cities. Vienna: Vienna University of Technology.
- Girardet, H. 2004. Cities People Planet. Chichester: Wiley Academy.
- Givoni, M., J. Macmillen, D. Banister, and E. Feitelson. 2013. “From Policy Measures to Policy Packages.” Transport Reviews 33 (1): 1–20. doi:10.1080/01441647.2012.744779.
- Google Maps. https://www.google.nl maps.
- Goudappel Coffeng. 2015. Bereikbaarheidsstudie Zuid-Limburg. Maastricht: Regio Zuid-Limburg.
- Handy, S. 1993. “A Cycle of Dependence: Automobiles, Accessibility, and the Evolution of the Transportation and Retail Hierarchies.” Berkeley Journal 8: 21–43. doi:10.5070/BP38113081.
- Handy, S. 2017. “Thoughts on the Meaning of Mark Stevens’s Meta-Analysis.” Journal of the American Planning Association 83 (1): 26–28. doi:10.1080/01944363.2016.1246379.
- Harms, S. 2003. “From Routine Choice to Rational Decision Making Between Mobility Alternatives.” Conference paper STRC 2003, Swiss Transport Research Conference 2003.
- Harms, L., Kansen M., and Jorritsma P. 2015. Verduurzaming sociaal recreatieve Mobiliteit. Den Haag: KiM (Kennisinstituut voor Mobiliteitsbeleid).
- Inkar. 2013. https://www.inkar.de.
- Jeekel, H. 2013. The Car-dependent Society. Farnham: Ashgate Publishing Group.
- Kager, R., L. Bertolini, and M. te Brömmelstroet. 2016. “Characterisation of and Reflections on the Synergy of Bicycles and Public Transport.” Transportation Research Part A: Policy and Practice 85: 208–219. doi:10.1016/j.tra.2016.01.015.
- Kent, J. 2018. “Three Signs Autonomous Vehicles Will Not Lead to Less Car Ownership and Less Car Use in Car Dependent Cities – A Case Study of Sydney.” Australia Planning Theory & Practice, 19 (5): 753–778. doi:10.1080/14649357.2018.1537599.
- Kenworthy, J., and F. Laube. 1999. “Patterns of Automobile Dependence in Cities: An International Overview of key Physical and Economic Dimensions with Some Implications for Urban Policy.” Transportation Research Part A 33: 691–723.
- KiM. 2018. Busgebruikers door dik en dun. Den Haag: Ministerie van knfrastructuur en Waterstaat.
- KPPV Dashboard. 2012. Duurzame en slimme mobiliteit. E-bike kan fietsverkeer met meer dan 20% doen toenemen. (http://kpvvdashboard-6blogspot.nl).
- Litman, T. 2020. Autonomous Vehicle Implementation Predictions Implications for Transport Planning. Victoria Transport Policy Institute.
- Mokhtarian, P., I. Salomon, and M. Singer. 2015. “What Moves Us? An Interdisciplinary Exploration of Reasons for Traveling.” Transport Reviews 35 (3): 1–25. doi:10.1080/01441647.2015.1013076.
- Newman, P., and J. Kenworthy. 1999. Sustainability and Cities: Overcoming Automobile Dependency. Washington, DC: Island Press.
- Newman, P., and J. Kenworthy. 2006. “Urban Design to Reduce Automobile Dependence.” Opolis: An International Journal of Suburban and Metropolitan Studies 2 (1). Article 3. http://repositories.cdlib.org/cssd/opolis/vol2/iss1/art3.
- NOMIS. WP101EW –Population (Workplace population). https://www.nomisweb.co.uk/query/construct/submit.asp?menuopt=201&subcomp=#
- NTS UK. 2011. https://www.gov.uk/government/statistics/national-travel-survey-2011.
- Oxley, M., Tim Brown, A. Fernandez-Maldonado, and Lei Qu. 2009. Review of European Planning Systems. Leicester: Centre for Comparative Housing Research.
- Rijkswaterstaat (RWS). Nationaal verkeersmodel Ritjeweg. https://ritjeweg.nl/kosten-auto-huren-of-kopen/.
- Rogers, R. 1997. Cities for a Small Planet. London: Faber &Faber.
- Schaap N., Harms, L., Kansen, M. 2015. Fietsen en lopen: de smeerolie van onze mobiliteit. Den Haag: Kennisinstituut voor Mobiliteitsbeleid.
- Schakenbos, R., L. La Paix Puello, S. Nijenstein, and K. Geurs. 2015. “Valuation of a Transfer in a Multimodal Public,” Master thesis R. Schakenbos TU Twenthe.
- Silva, C., and P. Pinho. 2010. “The Structural Accessibility Layer (SAL): Revealing How Urban Structure Constrains Travel Choice.” Environment and Planning A 2010 Volume 42: 2735–2752. doi:10.1068/a42477.
- Städteregion Aachen. 2013. Mobilität 2013, Zahlen und Daten. Aachen: Stádteregion Aachen.
- Staps, E. 2014. Voor- en natransport bij hoogwaardig openbaar vervoer. Nijmegen: Radboud Universiteit Nijmegen.
- Stradling, S. 2007. Determinants of Car Dependence. Edinburgh: Transport Research Institute, Napier University.
- Tayal, T., K. Anantuni, and E. Burns. 2001. Measuring Auto Dependence in Metro Phoenix Using GIS. Tempe: Arizona State University.
- Tordoir, P., A. Poorthuis, and P. Renooy. 2015. De veranderende geografie van Nederland. Amsterdam: Regioplan.
- UK Census. 2011. https://www.ons.gov.uk “census” 2011census.
- Urry, J. 2004. “The ‘System’ of Automobility.” Theory, Culture and Society 21 (4/5): 25–39. doi:10.1177/0263276404046059.
- Van Acker, V., B. Van Wee, and F. Witlox. 2010. “When Transport Geography Meets Social Psychology : Toward a New Conceptual Model of Travel Behaviour.” Transport Reviews 30 (2): 219–240. doi:10.1080/01441640902943453.
- Van de Coevering, P. 2013. “Mobiliteit en ruimte in de hedendaagse stedelijke regio.” In Mobiliteit en Ruimte, d ewisselwerking tussen mobiliteit en ruimte in de stedelijkeregio, edited by K.Geurs, 50–65. Ede: CROW.
- Van Wee, B. 2009a. “Ruimtelijke Inrichting.” In Verkeer en Vervoer in hoofdlijnen, edited by B. Van Wee, and J. A. Annema, 85–106. Bussum: Coutinho.
- Van Wee, B. 2009b. “Self-selection: A Key to a Better Understanding of Location Choices, Travel Behaviour, and Transport Externalities?” TransportReviews 29 (3): 279–292. doi:10.1080/01441640902752961.
- Van Wee, B., W. Bohte, E. Molin, T. Arentze, and F. Liao. 2014. “Policies for Synchronization in the Transport–Land-use System.” Transport Policy 31: 1–9. doi:10.1016/j.tranpol.2013.10.003.
- Van Wee, B., and K. Maat. 2003. Land-Use and Transport: A Review and Discussion of Dutch Research. Delft: Faculty of Technology, Policy and Management Delft University of Technology Delft.
- Wegener, M., and F. Furst. 1999. Land Use Transport Interaction: State of the Art. Dortmund: IRPUD.
- Wiersma, J. 2020. “Commuting Patterns and car Dependency in Urban Regions.” Journal of Transport Geography 84: 102700. doi:10.1016/j.jtrangeo.2020.102700.
- Wiersma, J., L. Bertolini, and T. Straatemeier. 2016. “How Does the Spatial Context Shape Conditions for car Dependency?” Journal of Transport and Land Use 9 (3): 35–55. doi:10.5198/jtlu.2015.583.
- Wiersma, J., L. Bertolini, and T. Straatemeier. 2017. “Adapting Spatial Conditions to Reduce car Dependency in mid-Sized ‘Post Growth’ European City Regions: The Case of South Limburg, Netherlands.” Transport Policy 55: 62–69. doi:10.1016/j.tranpol.2016.12.004.