
Abstract
Global population growth tremendously impacts the global food industry, endangering food safety and quality. Mycotoxins, particularly Ochratoxin-A (OTA), emerge as a food chain production threat, since it is produced by fungus that contaminates different food species and products. Beyond this, OTA exhibits a possible human toxicological risk that can lead to carcinogenic and neurological diseases. A selective, sensitive, and reliable OTA biodetection approach is essential to ensure food safety. Current detection approaches rely on accurate and time-consuming laboratory techniques performed at the end of the food production process, or lateral-flow technologies that are rapid and on-site, but do not provide quantitative and precise OTA concentration measurements. Nanoengineered optical biosensors arise as an avant-garde solution, providing high sensing performance, and a fast and accurate OTA biodetection screening, which is attractive for the industrial market. This review core presents and discusses the recent advancements in optical OTA biosensing, considering engineered nanomaterials, optical transduction principle and biorecognition methodologies. Finally, the major challenges and future trends are discussed, and current patented OTA optical biosensors are emphasized for a particular promising detection method.
GRAPHICAL ABSTRACTGraphical Abstract
Mycotoxins Introduction
Mycotoxins importance in farming industry
The farming industry and agriculture products are an integral part of the primary sector, playing a significant role in the economy. However, its importance goes beyond mere economic aspects, being transversal to other sectors, such as socio-cultural and environmental. Furthermore, the exponential growth of the population worldwide and its consequent needs can positively impact the farming industry. The food’s quality and conservation emerge as a current requirement since several natural factors (i.e., climate change and soil composition) and biological or chemical processes (i.e., pests, plants invasion, and chemical contamination) severely influence agriculture performance. Despite the introduction of good agricultural practices and innovation of production methods, fungi contamination persists as an agricultural challenge (Ben Taheur et al. Citation2019; Eskola et al. Citation2020). The illness risk in farm animals compromises their productivity, and any contamination in the food chain production causes an increase in product cost, consequently, the decrease in food market value. Therefore, food safety/quality control and monitoring costs may increase significantly (Hussein and Brasel Citation2001; Prieto-Simón et al. Citation2008; Haschek and Voss Citation2013; Agriopoulou, Stamatelopoulou, and Varzakas Citation2020a). A large-scale global survey in farming products identifies mycotoxins contamination as a possible cause of significant economic loss in the food industry (Mitchell et al. Citation2016; Pitt and Miller Citation2017).
Mycotoxins are secondary metabolites produced by several types of fungi genera, such as Aspergillus, Penicillium, Fusarium, and, with a minor scope, Alternaria and Claviceps. Numerous fungi species can produce more than one type of mycotoxin, and a specific mycotoxin can be produced by more than one fungus species. Mycotoxins present a low molecular weight (about 500 g mol−1) and can cause biochemical, physiologic, and pathologic alterations in several species of animals, plants, and other microorganisms (Haschek and Voss Citation2013). Although only 20 of more than 400 identified mycotoxins present a toxic trait, their molecular stability and the capability to survive food processing raise security concerns (Kumar et al. Citation2017). Mycotoxins are biologically dangerous; consequently, extended regulatory restrictions for each mycotoxin were established by several institutions: i) European Food Safety Authority (EFSA), ii) United States (US) Food and Drug Administration (FDA), iii) World Health Organization (WHO) and iv) Food Agriculture Organization (FAO). The acuteness of the toxic effect can be classified as chronic effect or acute toxicity with a severe illness, adequately described as mycotoxicosis (e.g., ergotism, aflatoxicosis, and alimentary toxic aleukia) (Pitt and Miller Citation2017; Agriopoulou, Stamatelopoulou, and Varzakas Citation2020a).
Influence of the agricultural environment on mycotoxins appearance
The agricultural growing environments influence fungus development and the production of mycotoxins (i.e., temperature, relative humidity, rainfall, water activity, pH, soil composition, and texture), atmospheric composition, and the presence of a competitive microflora, but also the cultivation technique and foodstuff conservation (Bennett and Klich Citation2003; Battilani et al. Citation2020). The plants are more susceptible to fungal invasion in periods of stress caused by the amount of water available, the presence of pests, and the absence of pesticide exposure. Therefore, it is expected that Climate Change will lead to new modified forms of mycotoxins, increasing the mycotoxins levels in farming products. The susceptibility of each flora species and their response to climate change define the mycological growth and the rate of mycotoxin production. Consequently, the contamination risk can increase toxic threats to the consumers (Mitchell et al. Citation2016).
Environmental and social-economic interactions play a major role in the dynamics between the fungi presence and mycotoxins contamination in food production and their delivery. The mycotoxigenic fungi can develop in the food product during the plant growth (i.e., crops, cereals, dried fruits, nuts, and spices), both before and/or after harvest, during poor and/or prolonged storage, under the optimal conditions for pathogenic development according to the fungus species (Battilani et al. Citation2020). Already in 1999, FAO reported that the plant pathogenic fungi contamination and, consequently, the presence of mycotoxins was the cause of 25% of the crop’s contamination worldwide. However, Eskola et al. (Citation2020) reported that the occurrence of mycotoxins could be much more prominent in food samples, reaching 60 to 80%, depending on the mycotoxin type.
A large-scale global survey of mycotoxins contamination identifies regional differences in the occurrence of each toxic metabolite (Gruber-Dorninger, Jenkins, and Schatzmayr Citation2019). From 2008 to 2017, feed samples (e.g., maize, wheat, soybean, barley, and rice) were collected in 15 different geographic regions worldwide, and the prevalence and the results showed that 88% of the samples were at least contaminated with one mycotoxin and the co-occurrence of multi-mycotoxins achieved a total of 64% (Gruber-Dorninger, Jenkins, and Schatzmayr Citation2019). However, Global Warming is constantly affecting food security through climate variations, such as the increase of temperatures, alteration of precipitation patterns, and the regular occurrence of extreme meteorological events. Therefore, the relationship between plant growth and mycotoxin development can change from suppressive to beneficial conditions leading to their appearance in new regions worldwide. The climatic conditions of each geographic area influence the presence and type of mycotoxin developed during crop growth and storage. Considering the regional trends and climate, the Mediterranean countries present favorable environmental conditions for developing mycotoxins fungus in the agriculture field. The viniculture in the Mediterranean area presents an important role since more than 53% of the world wine production is concentrated in Southern Europe, according to the International Organization of Vine and Wine (OIV)) (Citation2021). Furthermore, considering the increased risk of mycological contamination and human consumption, Ochratoxin-A (OTA) is the only mycotoxin with established regulatory limits in wine (Kochman, Jakubczyk, and Janda Citation2021). Vitali Čepo et al. (Citation2018) reported that 63% of commercial wines conventionally produced in the Balkan area tested positive for OTA presence. OTA presence can be frequent at lower concentrations, and their food consumption causes health harm. For instance, through a risk assessment study, Mousavi Khaneghah et al. (Citation2018) reported that OTA prevalence in cereal-based products (i.e., bread, cornflakes, breakfast cereals, and pasta) was significantly higher than in other mycotoxins. Beyond coffee and coffee-based products, the global prevalence of OTA was estimated to be 53%, but Southern Europe achieved higher values (Portugal 83%, e.g.) (Khaneghah et al. Citation2019).
Ochratoxin-A critical issues: food safety, standard methods, and the role of biosensors
OTA is the most prevalent and toxic member of ochratoxins due to the chemical structure (i.e., chlorine atom in the substituent group of the molecule), exhibiting a Lethal Dose (LD50) of about 1 mg kg−1 of body weight (bw) in pigs (no LD50 value was defined for humans yet) (Schrenk et al. Citation2020). This mycotoxin is identified as potentially carcinogenic in humans (; IARC Citation1993).
Figure 1. Scheme of the International Agency for Research on Cancer (IARC) monographs evaluation of carcinogenic hazard of mycotoxins, being highlighted the OTA evaluation.

OTA has a molecular weight of 403.8 g mol−1 (El Khoury and Atoui Citation2010). This mycotoxin is a white compound, odorless, chemical, and thermally stable, presenting poor solubility in water and moderate solubility in polar organic solvents (Pohland et al. Citation1982; Pohland, Nesheim, and Friedman Citation1992). The physicochemical properties are defined by the amide bond between L-phenylalanine and the 7-carboxylic group of the dihydroisocoumarin moiety (). However, due to its carboxylic group and phenolic hydroxyl group, the chemical structure can change to monoanionic (OTA-) and dianionic (OTA2-) forms, depending on the pH of the microenvironment (Ha Citation2015; Kőszegi and Poór Citation2016). Therefore, OTA is a weak organic acid, exhibiting a pKa value of 4.3–4.4 (carboxyl group) and 7.0–7.3 (phenolic hydroxyl group) (Ringot et al. Citation2006). After absorption of UV light, OTA exhibits green or blue fluorescence in acid and basic environments, respectively (El Khoury and Atoui Citation2010).
Figure 2. Chemical structure of OTA, IUPAC name N-{[(3R)-5-chloro-8-hydroxy-3-methyl-1-oxo-7-isochromanyl]carbonyl}-3-phenyl-l-alanine. The yellow part represents the chlorine substituent, blue is the phenylalanine part, orange is the dihydro-isocoumaring ring, and green are the acidic hydrogens. Adapted and reprinted with permission from Kőszegi and Poór (Citation2016). Copyright 2016 MDPI, Basel, Switzerland.
![Figure 2. Chemical structure of OTA, IUPAC name N-{[(3R)-5-chloro-8-hydroxy-3-methyl-1-oxo-7-isochromanyl]carbonyl}-3-phenyl-l-alanine. The yellow part represents the chlorine substituent, blue is the phenylalanine part, orange is the dihydro-isocoumaring ring, and green are the acidic hydrogens. Adapted and reprinted with permission from Kőszegi and Poór (Citation2016). Copyright 2016 MDPI, Basel, Switzerland.](/cms/asset/e511be37-8835-417b-8395-29c1a71830f7/bfsn_a_2168248_f0002_c.jpg)
First described in 1965, OTA is a secondary metabolite secreted by several genera of fungi. These fungal species can colonize several food groups and secondary food products, such as cereals (Mousavi Khaneghah et al. Citation2018), coffee (Khaneghah et al. Citation2019) and cocoa beans (Pires et al. Citation2019), grapes (Mehri et al. Citation2020), nuts (Iqbal et al. Citation2018), spices (Zareshahrabadi et al. Citation2020), animal-based foods (Altafini, Fedrizzi, and Roncada Citation2019), wine (Freire et al. Citation2020), beer (Mateo et al. Citation2007), and juice (Dachery et al. Citation2017). OTA is a highly stable molecule capable of surviving the eradication of its host fungi. During food production, the mycotoxin tends to resist the numerous steps of the long process in secondary food elaboration or long-time storage under ambient conditions (e.g., prolonged storage, high temperature, and humidity) (Bennett Citation1987; Fink-Gremmels Citation1999; Studer-Rohr, Schlatter, and Dietrich Citation2000; Ha Citation2015).
The ingestion of food contaminated by OTA can significantly affect human health, increasing the risk of cancer development. The toxicokinetic studies reveal that OTA intoxication occurs not only through a single intake with a high OTA concentration in the contaminated food product (i.e., acute ingestion dose) but also by the combination of several contaminated foodstuffs with lower OTA concentration during a extended period of time (i.e., chronic ingestion dose) (Ratola et al. Citation2005). In 2020, the Chemical Contaminants (CONTAM) panel of EFSA did not recognize that OTA is acutely toxic (Schrenk et al. Citation2020). However, the synergistic effect caused by chronic dietary can potentiate the toxic effect (Popescu et al. Citation2021). There are also reported episodes of food poisoning through physical contact and inhalation (Duarte, Pena, and Lino Citation2009; Pfohl-Leszkowicz Citation2009). The intoxication occurs through the gastrointestinal tract (i.e., stomach, and proximal portion of the jejunum), where the mycotoxin is rapidly absorbed and reaches the highest peak level in blood within a few hours.
The high affinity of nonionized OTA for plasma and serum proteins, particularly to the albumin protein (up to 99.98% in humans) (Studer-Rohr, Schlatter, and Dietrich Citation2000), is one of its most specific pharmacokinetic properties (Schwerdt et al. Citation1999). After 5 days of ingestion, OTA is metabolized in two organs (i.e., liver and spleen), potentiating OTA bioaccumulation in the enterohepatic circulation (Kőszegi and Poór Citation2016). This pharmacokinetic characteristic provides the persistent presence of OTA on the vascular circulation, inhibiting its elimination process, thus, increasing its half-life up to 35 days in humans after a single exposure (Fink-Gremmels Citation1999; Studer-Rohr, Schlatter, and Dietrich Citation2000). Moreover, OTA can persist at the renal level up to 16 days, leading to a severe nephrotoxicity effect (Fuchs et al. Citation1988). Beyond kidneys and liver, OTA can be present also in the intestine, brain, skeletal muscle, and fat tissue in less substantial concentrations (Belmadani et al. Citation1998).
In repeated exposure, the induced DNA lesions become irreversible, leading to persistent mutations, cell apoptosis, necrosis, and malignant tumors (Ringot et al. Citation2006; Kőszegi and Poór Citation2016). Even though OTA does not have a direct genotoxic effect, it can deeply induce oxidative stress potentiating the carcinogenic impact (Sorrenti et al. Citation2013). Moreover, reduction of the immune response, alterations in cellular proliferation response and cell signaling, genomic mutation, and inhibition of protein synthesis might cause carcinogenic characteristics (Sorrenti et al. Citation2013). Balkan Endemic Nephropathy (BEN) and Chronic Interstitial Nephropathy (CIN) diseases, characterized by tumors on renal and kidney organs, can be caused by OTA chronic exposure. Both renal chronic progressive diseases can lead to irreversible organ failure and potentially fatal outcome (Bui-Klimke and Wu Citation2015). Furthermore, the genotoxicity and the epigenetic modulations caused by the activation of several biological mechanisms can lead to the progression of neurodegenerative diseases (i.e., Alzheimer’s disease) (Niaz et al. Citation2020).
Food Regulation and conventional detection
In order to ensure food safety, several worldwide food safety entities defined food control protocols for agriculture production, food processing, and the food market regarding OTA contamination (Official Journal of the European Union Citation2005; European Food Safety Authority (EFSA)) Citation2006; Joint FAO/WHO Expert Committee on Food Additives Citation2007; Schrenk et al. Citation2020). In the European Union, the regulatory limits for OTA levels are extremely well defined based on the Scientific Panel on Contaminants in Food of EFSA. In 2020, the CONTAM panel of EFSA considered that chronic dietary exposure has carcinogenic consequences. However, the genotoxicity effect remains unclear (Schrenk et al. Citation2020). Considering the neoplastic effect, both genotoxic and carcinogenic, the Benchmark Dose (BMDL10) was established at 14.5 µg kg−1 bw per day, with a Margin of Exposure (MOE) below 10.000 times. The non-neoplastic effect only considers the carcinogenic risk. In this case, the limit established is a BMDL10 of 4.73 µg kg−1 bw per day for MOE below 200 (Schrenk et al. Citation2020).
A highly sensitive analysis of mycotoxins, in particular OTA, requires an appropriate and certified detection ability, with accurate quantification, since its toxicity can be revealed at low-dose levels (Agriopoulou, Stamatelopoulou, and Varzakas Citation2020b). For OTA detection, several recommended analysis methods are defined by the Association of Official Analytical Collaboration (AOAC) International or standard practices described by the International Standard Organization (ISO), and the European Committee for Standardization (CEN) (Bueno, Muñoz, and Marty Citation2014). Official procedures for sampling for analytical methods performance consider three important steps: 1) sampling, 2) extraction, and 3) clean-up (Bueno, Muñoz, and Marty Citation2014; Janik et al. Citation2021). In the chosen representative sample, previously homogenized, an extraction protocol is implemented to release the mycotoxin from the sample matrix, using a specific type of extraction solvent (e.g., organic solvents) and extraction methods (e.g., centrifugation and filtration) (Bueno, Muñoz, and Marty Citation2014; Janik et al. Citation2021). Following the extraction, a clean-up procedure is responsible for reducing the matrix effects and removing impurities in the sample extract, which can interfere with mycotoxin detection and thus affecting the detection performance (e.g., specificity, sensitivity, accuracy, and precision). The most used methods for mycotoxins clean-up are Solid-Phase Extraction (SPE) and Immunoaffinity Chromatography (IAC) (Bueno, Muñoz, and Marty Citation2014; Janik et al. Citation2021).
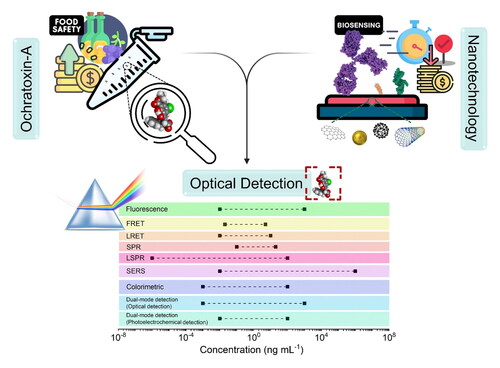
Currently, the food analysis is performed at the final production process, being predominant the use of conventional techniques, such as different types of chromatography combined with various detectors: diode array, fluorescence, and UV, either as a single process or in dual-combination with other techniques (Zimmerli and Dick Citation1996; Blesa et al. Citation2006; Mishra et al. Citation2018). The bioanalytical performance parameters of the standard detection methods are presented in , namely the respective optimal limit of detection (LOD) and limit of quantification (LOQ) (these analytical parameters are described in ). The recommended protocol (AOAC 2001.01) for instrumental analysis and quantification is Immunoaffinity Columns (IAC) clean-up, followed by High-Performance Liquid Chromatography (HPLC) coupled with fluorescent detection for wine and beer (Visconti, Pascale, and Centonze Citation2001). These combined bioanalytical protocols appear reasonably accurate and reproducible in OTA detection, exhibiting a LOD value of 0.006 ng mL−1 for white wine and 0.010 ng mL−1 for rosé and red wines.
Table 1. Conventional detection methods for OTA.
Table 2. Description of bioanalytical performance parameters and bioanalytical requirements.
Standard detection methods can be applied in several real samples, achieving interesting sensitivities. However, these traditional detection approaches reveal some limitations, such as i) pretreatment of sample, ii) time-consuming, iii) laborious sample cleaning and extraction processes, and iv) expensive laboratory equipment requiring well-trained technicians, which are not appropriate for on-site monitoring (Nolan et al. Citation2019; Karami-Osboo Citation2020; López-Puertollano et al. Citation2021). Additional challenges in identifying mycotoxins using analytical techniques fall into the presence of mycotoxins at ultra low concentrations, the coexistence of numerous mycotoxins in the same food matrix, and their various chemical structures (Agriopoulou, Stamatelopoulou, and Varzakas Citation2020b).
An overview of biosensing nanotechnology
The high incidence of food contamination and the significant amount of analytical challenges conducted a research effort in the nanotechnology area to develop more advanced and efficient solutions (Streit et al. Citation2012; Błajet-Kosicka et al. Citation2014; Hosnedlova et al. Citation2020). Thus, advanced nanotechnologies can deliver a great effort to understand customer needs and application scenarios and benchmarking with the existing solution (Cong and Zhang Citation2022).
A revolutionary detection alternative relies on a nanomaterial-based biosensor. A biosensor is an innovative rapid diagnostic platform, that can overcome several detection limitations, and be used as a new approach for food sample analysis (Thakur and Ragavan Citation2013; Bunney et al. Citation2017). Biosensors applied in the food industry are mostly used for two distinct categories, i.e. food safety and food quality control (Rotariu et al. Citation2016). The development of portable label-free devices, with real-time detection, has been creating interest in the food industry, since it opens the capability of on-site monitoring. For instance, optimal detection methods allow for recognizing contaminants (e.g., mycotoxins and pathogenic microorganisms) at all phases of food production (Thakur and Ragavan Citation2013). A faster detection speed in a miniaturized lab-on-chip device for a cost-effective sample analysis is the main drive for developing a proper alternative nanotechnology for food safety monitoring.
The combination of novel nanomaterials enables the development of advanced biosensing approaches (Krishna et al. Citation2018). The small size of a nanomaterial (<100 nm) compels the atoms to be present or near the surface, providing exceptional intrinsic properties (e.g., optical, chemical, thermal, magnetic, and electronic), that contrast with their bulk counterparts. Thus, nanomaterials’ inherent features and their biosensing application enhance the desired analytical parameters (i.e., specificity, selectivity, stability, and portability) (Nayl et al. Citation2020). Hence, the nanomaterial integration in biosensing technology has gradually become more relevant, with the most common nanomaterials used being gold nanoparticles (Au NPs), carbon NPs (CNPs), graphene, graphene-metal, metal oxide NP nanocomposites, and quantum dots (QDs) (Holzinger, Goff, and Cosnier Citation2014; Shan et al. Citation2020).
OTA biosensors aim to perform on-site analysis and provide rapid response time, cost-effective manufacturing, and reliability (i.e., accuracy and precision) (Byrne et al. Citation2009). OTA analysis techniques can be divided into two main approaches, namely i) rapid screening tests, and ii) confirmatory tests (Krska et al. Citation2008; Zhang et al. Citation2018). The first group focuses on qualitative detection (typically responding with a positive or negative result), and the second group provides a more accurate quantitative result.
The potential of an efficient biosensor is defined by several dynamic and static analytic characteristics of the sensing performance, as summarized in . Such analytical sensing parameters can be severely influenced by the detection method, the biosensor’s composition, and its characteristics (Vashist and Luong Citation2018; Santos et al. Citation2019; Naresh and Lee Citation2021). In addition, AOAC International defines the guidelines for standard method performance requirements for food sensing (see ).
Biosensors can be classified according to their detection mode or immobilized biorecognition element (Sawant Citation2017). Firstly, the detection mode of a biosensor can be defined by its transducer type: optical, electrochemical, thermal, and mass-based (Van Dorst et al. Citation2010; Alahi, Eshrat, and Mukhopadhyay Citation2017). Regarding the biorecognition element approach, the mycotoxin sensing strategies focus on immunosensors or aptasensors, which rely on antibodies (Ab) or aptamers as biorecognition components; however, innovative molecularly imprinted polymers (MIPs) have also been applied as synthetic biorecognition elements. Regardless of the bioreceptor molecular structure, the biorecognition element is responsible for recognizing and associating a specific analyte (Yasmin, Ahmed, and Cho Citation2016; Mishra et al. Citation2018). The biological recognition event (transduction), considered by the biorecognition element and analyte interaction (and possible binding), generates a proportional signal, converted through the transducer and amplified to determine the analyte concentration (Naresh and Lee Citation2021).
Current available on-site detection approaches
The importance of mycotoxins detection in the food industry is unquestionable. The economic value of mycotoxin testing was evaluated at USD 1.23 billion in 2021. It is expected to reach USD 1.65 billion by 2026, with an expected annual growth rate of 6.1% (MarketDataForecast Citation2021). Commercial detection kits emerge as a new alternative to mycotoxin detection, providing critical information about food safety products. Most sensitive and selective commercial tests are developed in an immunoassay format, that is, a specific bio-interaction between the immobilized biorecognition element (i.e., Ab) and the biological analyte aimed to detect (Nolan et al. Citation2019). Commonly, the commercial biochemical methods are the direct competitive ELISA and membrane-based immunoassays (i.e., Lateral Flow Immunoassay (LFIA) and Fluorescence Polarization Immunoassay (FPIA)). Commercial tests for mycotoxins detection are available through several industrial companies (e.g., BioSystems, Charm Sciences Inc., Cusabio Technology LLC, EnviroLogix, EuroProxima, Pribolab Pte.Ltd., Romer Labs, R-Biopharm, Vicam, Veratox, among others).
Currently, the most commercialized sensing approach relies on the LFIA biosensor, which provides optical (i.e., colorimetric) detection. Generally, the biodetection strategy occurs on a paper-based portable analytical device, with the most straightforward assay procedure, that can provide a fast qualitative detection and intuitive result (i.e., through visible variations of color in the biosensor’s surface).
The LFIA detection approach is a unidirectional assay used to detect the presence (or absence) of the biological analyte in a potentially contaminated sample in an immunochromatographic strip available on a microfluidic paper-based analytical device. The immunoassay can appear in two formats, i) sandwich assay (two types of Ab are required) or ii) competitive assay (only one type of Ab is required). Mycotoxins cannot be labeled by two types of biorecognition Ab, because they do not possess multiple epitopes, so competitive LFIA is the ideal approach (Li et al. Citation2021). Therefore, the development of a single detectable color (in C line) should be considered favorable for OTA’s presence (Fadlalla et al. Citation2020), assuming that chromogenic detection occurs when the concentration exceeds the determined threshold (i.e., LOD). The labels responsible for the color in the C and T lines are chosen accordingly with the test components’ compatibility.
In qualitative immunoassays, the analysis occurs in a specific portable diagnostic device (i.e., dipstick or cassette format). For example, the LFIA device comprises a sample pad, a conjugate pad (including the T and C line), and an absorbent pad, as represented in .
Figure 3. Schematic representation of the LFIA methodology at (a) and image of LFIA strip devices used for measuring OTA at different concentrations in spiked red wine in (b). Reprinted with permission from Anfossi et al. (Citation2012). Copyright 2012 American Chemical Society.
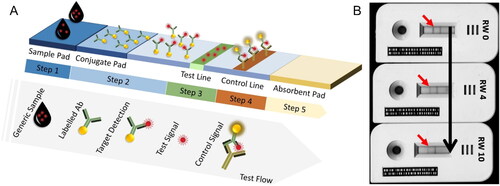
The biochemical analysis begins with dropping a minimal amount of the test sample (liquid state) in the sample pad. After receiving the sample containing OTA, the sample travels in the conjugate pad through the capillary action at the nitrocellulose membrane (, Step 1). As an example, the conjugate pad area is characterized by the presence of Au NPs labeled with specific Ab for the targeting OTA. On the conjugate pad, the target antigen interacts with its corresponding specific labeled Au Ab, creating a bio-complex (i.e., OTA-Au-Ab1 complex) (, Step 2). The OTA present in the sample will occupy the available Ab preventing the bio-interaction between the immobilized OTA and the specific labeled Au-Ab (, Step 3). The control signal is produced by matching a commonly labeled Ab with its partner (Ab3 – Au-Ab1 complex) (, Step 4). The T and C lines contain capture reagents to display the result (Huang et al. Citation2020b). In this case, the visual C line indicates the optimal performance of the sensing test and a positive test. In contrast, the presence of a visual signal from both T line and C line represents a negative result. The absorbent pad helps the sample flow and collects the excess at the end (, Step 5) (Huang et al. Citation2020b). After finishing the assay, all the contaminated material is destroyed or decontaminated by adding sodium hypochlorite solution (5 to 10% v/v). This sensing approach was applied by Anfossi et al. (Citation2012) with different samples (i.e., white and red wine), and the presence of the T line disappeared as the OTA concentration increased, as demonstrated in .
However, this method presents several limitations: i) the inaccurate interpretation of the results caused by the membrane saturation, ii) the characteristics of the tested sample (e.g., reduced concentration of the analyte, viscosity, pretreatment/enrichment process, and matrix interference), iii) limits of shelf-life of the label material, iv) the high cutoff values, and v) naked eye discrimination, among others (Gordon and Michel Citation2008; Posthuma-Trumpie, Korf, and van Amerongen Citation2009; Nolan et al. Citation2019; Andryukov Citation2020). As mentioned previously, OTA has defined thresholds in food safety policy. Therefore, current food safety market necessity leads to the development of miniaturized cost-effective lab-on-chip devices for mycotoxin detection, providing highly sensitivity and selectivity (e.g., qualitative and/or quantitative analyses at an appropriate dynamic range), with faster detection modes.
Recent advances in optical biosensors for Ochratoxin-A detection
Optical biosensors are considered the most common nanotechnological alternative to conventional detection methods, providing high detection sensing’ performance (i.e., fast detection analysis with high sensitivity and specificity), with low noise background and low detection limit, and potential for multiplexing. Beyond, label-free optical biosensors require a low volume of the sample for an on-site and real-time monitoring analysis (Neethirajan et al. Citation2018; Santos et al. Citation2019; Akgönüllü and Denizli Citation2022). This type of biosensors requires a transducer component to convert the interaction between the biorecognition elements and the biological analyte into a precise measurable optical signal (i.e., absorption, transmission, reflection, refraction, phase, amplitude, frequency, or light polarization) (Alahi, Eshrat, and Mukhopadhyay Citation2017).
This review intends to analyze the recent advances in OTA optical biosensors, fabricated using different nanotechnologies, reported in the past two years (from 2020 to 2022), as illustrated in . Beyond, the review aims to understand and discuss sensing nanotechnology strategies, that can overcome the existing gap in on-site food monitoring, contributing to a more efficient and cost-effective food safety guarantee. Also, it will analyze the currently published patents of a particular promising detection technology and will discuss the challenges and future directions of OTA optical biosensors.
Figure 4. General scheme of the main topics addressed in this review, regarding the recent advances in OTA optical biosensor nanotechnologies.
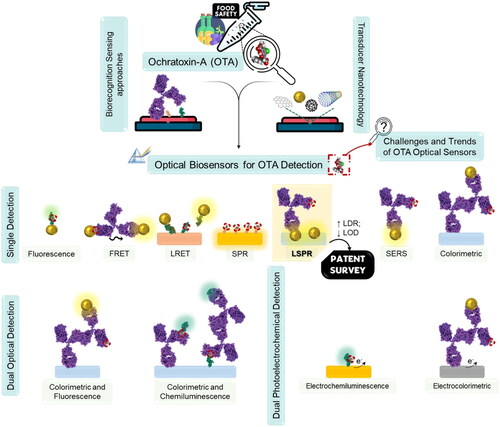
As can be observed in , a diverse variety of biodetection strategies, engineered nanomaterials, optical sensing phenomenon, and biorecognition methods can be employed for OTA detection in real spiked food samples. The final performance of the biosensor can be evaluated through several bioanalytical parameters: limit of detection (LOD), limit of quantification (LOQ), linear dynamic range (LDR), accuracy (i.e., recovery range), and reproducibility (i.e., RSD). The affinity and selectivity of the various biosensors were tested through exposure to other interfering substances (e.g., mycotoxins, or similar chemical molecules). Moreover, the presented detection methods were compared with other conventional methods using real spiked food samples to prove their practicability and reliability.
Table 3. Examples of optical biosensors for OTA detection.
Single and dual-mode optical detection methods
Fluorescence
Fluorescence phenomenon is a photophysical radiative process that results from the transition of electrons from the lowest vibrational level of the first singlet excited state to the different vibrational levels of the ground state emitting photons (Tsia Citation2016). The fluorescence phenomenon occurs in specific molecules named fluorochromes or dyes, and the conjugation of larger macromolecules with a fluorochrome is called fluorophore (Tsia Citation2016). This optical sensing approach is one of the most developed in OTA detection, because it provides high sensitivity, stable signal, and fast detection response (Li et al. Citation2021).
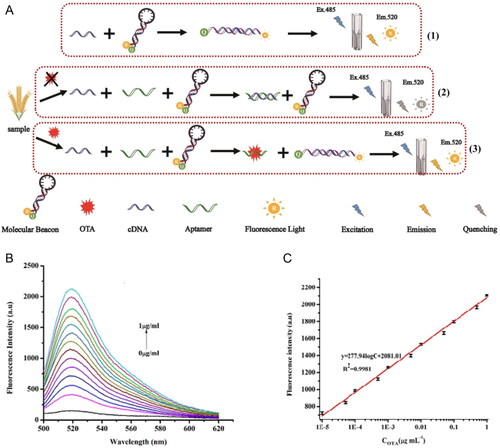
A fluorescence biosensor with a proper biorecognition layer to accurately detect OTA presence was developed by Hitabatuma et al. (Citation2021). The authors developed a competitive fluorescence assay based on free-complementary DNA, and its working mode is represented in . The biosensor was composed by a molecular beacon (i.e., functionalized hairpin) labeled with a fluorophore (i.e., fluorescein) and a quencher (i.e., Dabcyl), and a specific DNA aptamer and its partial complementary strand (cDNA). The quencher had the ability to suppress the fluorescence effect on the biosensor ( (1)). In the absence of the OTA, the biosensor did not exhibit fluorescence ( (2)). However, in this presence, the DNA aptamer bounds preferentially to OTA, creating a DNA aptamer-OTA complex, leading to the release of cDNA. The presence of free cDNA forced the dissociation of a stem hybrid structure, triggering the emission of fluorescence ( (3)). The fluorescence intensity was directly proportional to OTA concentration (). The LOD value was calculated as 0.247 pg mL−1 and the detection range as 10 pg mL−1 to 1 µg mL−1. In the specificity assay, the biosensor was exposed to several mycotoxins, and only OTA induced a significant fluorescence signal. The fluorescent method was tested in real wheat spiked samples and achieved recovery values established between 88.02 and 104.03%, demonstrating the potential biosensing application.
Figure 5. Schematic representation of the working mode of the competitive fluorescence assay based on free-complementary DNA at (a). The fluorescence intensity spectra at various concentrations of OTA at (b) and the linear relationship between the fluorescence intensity (520 nm) and OTA concentration among 10−5 and 1 µg mL−1 in (c). Reprinted with permission from Hitabatuma et al. (Citation2021). Copyright 2021 Elsevier.
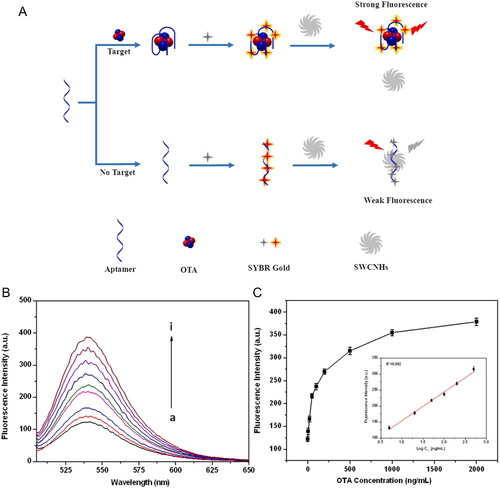
Guo et al. (Citation2021) reported a distinct fluorescence aptasensor for OTA detection. The biosensor is composed by aptamer linked to SYBR gold dye (i.e., DNA bounded to a fluorophore) and adsorbed onto single-walled carbon nanohorns (SWC NHs) used as a quencher, as demonstrated in . In the absence of OTA, the nanocomplex was adsorbed onto SWC NHs, exhibiting a weak fluorescence emission. However, in the presence of OTA, the aptamer changed its conformation and, consequently, was associated with SYBR gold dye, leading to a strong fluorescence emission. The fluorescence intensity was proportional to the OTA content until the saturation occurred at an established concentration, 1 µg mL−1 (). The LOD value was established at 2.3 ng mL−1, and the sensing system covered a range of 5 to 500 ng mL−1. The selectivity of the biosensor was tested through exposure to various OTA analogues (i.e., OTB, NAP, and Warfarin) and other mycotoxins (i.e., AFB1 and ZEN). The selectivity assay results showed that the sensing platform did not respond in the presence of other molecules, proving the biosensor’s affinity and specificity. Spiked red wine samples allowed the evaluation of the recovery and the RSD of the aptasensor with a complex sample matrix. The recovery and RSD ranges were established from 91.5% to 108.3% and 3.3% to 5.6%, respectively.
Figure 6. Schematic representation of the working mode of the label-free aptasensor for “turn-on” fluorescent detection at (a). The fluorescence intensity spectra at various concentrations of OTA at (b), and the fluorescence intensity (540 nm) plotted against OTA concentration; insert of the linear relationship between 0.5 and 3 ng mL−1 in (c). Reprinted with permission from Guo et al. (Citation2021). Copyright 2021 Elsevier.
The development of a fluorescent immunosensor based on magnetic NPs (MNPs) for OTA detection was also developed by Becheva et al. (Citation2020). A competitive immunosensor based on polyclonal Ab or F(ab’)2 fragment immobilization into MNPs was reported. Furthermore, a conjugate of OTA-OVA-FITC (OTA coupled to ovalbumin (OVA), and then conjugated FITC fluorochrome) was assembled. The competition between the aim OTA presented in the test sample and the OTA-OVA-FITC conjugate for binding in the antigen sites, previous immobilized on the surface of the MNPs, led to the release of a certain amount of OTA-OVA-FITC conjugate. In the supernatant, the OTA-OVA-FITC conjugate exhibited fluorescence. In the case of polyclonal Ab, the LOD value was established at 0.1 ng mL−1 and a linear detection range between 0.1 to 2.5 ng mL−1. In turn, when F(ab’)2 fragment was used as the biorecognition element, the established LOD value was 0.08 ng mL−1, and the linear detection range was 0.1 to 7.5 ng mL−1.
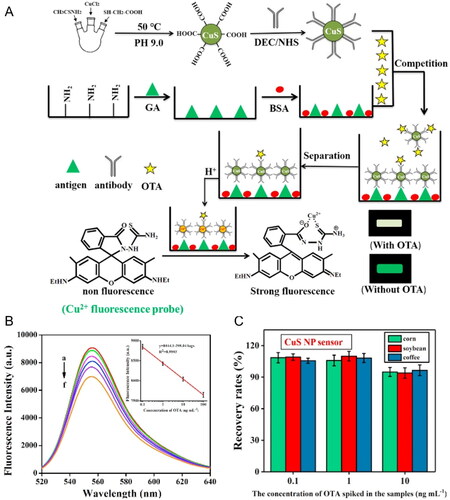
Chen et al. (Citation2021) also developed a fluorescent immunoassay using metallic NPs (i.e., copper monosulfide (CuS NPs)), as demonstrated in . The biosensor was composed by an OTA’s antigen platform. The aim OTA was associated to the Ab-conjugated CuS NPs and added to the biosensor platform. The biosensor approach was based on the interaction of OTA-Ab-conjugated CuS NPs with the OTA’s antigen presented on the biosensor’s surface. From this interaction, a fluorescence emission peak was recorded. The intensity of the fluorescent emission peak was inversely proportional to the OTA concentration, as shown in . Through the linear relationship between the fluorescence intensity and OTA concentration, the LOD value was calculated as 0.01 ng mL−1, and the detection range was limited between 0.1 and 100 ng mL−1. The ultrasensitive platform was able to detect the presence of three concentrations of OTA (0.5, 5, and 50 ng mL−1) in corn, soybean, and coffee samples with a recovery range between 93.89 to 109.96%, as demonstrated in .
Figure 7. Schematic representation of the fabrication and working mode of fluorescent CuS NPs used in the detection assay at (a). The fluorescence intensity spectra at various concentrations of OTA; insert of the linear relationship between the fluorescence intensity (554 nm) and OTA concentration among 0.1 and 100 ng mL−1 at (b). Recovery rates of OTA in several samples (i.e., spiked corn, soybean, and coffee) in (c). Reprinted with permission from Chen et al. (Citation2021). Copyright 2021 Elsevier.
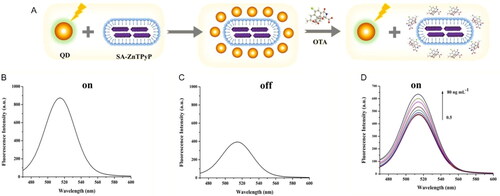
QDs can be applied to develop new approaches in fluorescent biosensing detection. QDs are semiconductor nanocrystals with favorable fluorescent characteristics: i) high photostability, ii) size-adjustable spectrum, iii) wide excitation spectrum, iv) easy modification, and v) significant surface area-to-volume ratio. For example, the “turn off-on” fluorescent sensor based on the ZnCdSe QDs was developed by Liu et al. (Citation2020). The performance of the fluorescent sensor is based on the interaction between the biological analyte and the self-assembled zinc porphyrin (SA-ZnTPyP), leading to the emission of fluorescence by ZnCdSe QDs, as represented in . The fluorescence spectra of the ZnCdSe QDs, named as “on”, and the nanocomplex composed by ZnCdSe QDs linked to SA-ZnTPyP, named as “off”, are represented in , respectively. The SA-ZnTPyP worked as a quencher molecule in the biosensing detection method. The interaction between the OTA and the SA-ZnTPyP molecule led to a significant fluorescence signal change of distanced ZnCdSe QDs, becoming more evident as the OTA concentration increases, as represented in . In 5 minutes, the biosensor detected OTA in real spiked samples (i.e., milk and coffee), reaching a LOD value of 0.33 ng mL−1 in a wide detection range of 0.5 to 80 ng mL−1.
Figure 8. Schematic representation of the working mode of the “turn off-on” fluorescent sensor for OTA detection in (a). The fluorescence intensity spectra of the ZnCdSe QDs, named as “on”, at (b), and the nanocomplex composed by ZnCdSe QDs linked to SA-ZnTPyP, named as “off”, in (c). The fluorescence intensity spectra at various concentrations of OTA in (d). Reprinted with permission from Liu et al. (Citation2020). Copyright 2020 Elsevier.
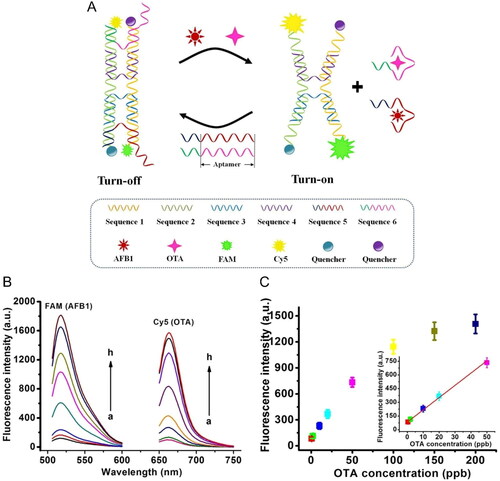
The “turn off-on” fluorescent sensor can be applied as a multi-mycotoxin detection, as reported by Xiong et al. (Citation2021). Dual tweezers nanomachine was developed to detect OTA and another mycotoxin (i.e., AFB1) simultaneously. The turn “off” of the stable sensing platform presented a DNA tweezers configuration linked to fluorophores (i.e., FAM and Cy5) and quenchers. In OTA presence, the bio-interaction between the aimed target and its specific aptamer, DNA tweezers configuration changes. This phenomenon causes an increasing distance of the specific fluorophore-quencher complex and, consequently, the fluorescence emission, as demonstrated in . The sensitivity of the fluorescence aptasensor was tested at different concentrations for both targets, and the fluorescence intensity increased according to the target concentration (). The linear relationship was established between the fluorescence intensity for OTA concentration (), allowing the LOD value determination of 0.1 ppb. The specificity of the aptasensor was tested by exposing it to other OTA analogues and, also, to OTA mixture with various mycotoxins, achieving promising results. Finally, the accuracy and precision of the biosensor were evaluated through exposure to several spiked samples (i.e., corn, olive oil, peanut, peanut oil, sesame, and soybean oil), achieving recovery values between 90 to 110% and a RSD of 5.9 to 9.2%.
Figure 9. Schematic representation of working mode of dual DNA tweezers nanomachine for OTA detection at (a). Fluorescence intensity spectra of the dual DNA tweezers nanomachine at various concentrations of OTA and another mycotoxin at (b), and the fluorescence intensity at a defined wavelength plotted against OTA concentration; insert of the linear relationship between 0.5 and 50 ppb in (c). Reprinted with permission from Xiong et al. (Citation2021). Copyright 2021 Elsevier.
The application of graphene, a material with a single-layer atomic surface, is a susceptible technology for biosensing since the surface plasmon polariton properties provide higher sensitivity to variations in the refractive index (RI) surroundings. Wang, Yang, and Wu (Citation2020) used graphene oxide (GO) to develop a steganographic aptasensor to detect OTA and another mycotoxin (i.e., ZEN) simultaneously. The biosensing method was based on the biosensor’s selective absorption and fluorescence quenching capabilities. Wine samples were spiked, and the sensor detected the presence of OTA with a LOD value of 1.48 ng mL−1 and established recovery values ranging between 91.75 to 103.56%.
Förster resonance energy transfer (FRET)
Another promising tool for developing optical biosensing methods is the Förster Resonance Energy Transfer (FRET) phenomenon. This non-radiative process is based on the transmission of photoexcitation energy from an excited fluorophore (the “donor”) to a nearby quencher molecule (the “acceptor”). FRET can also be named by Fluorescence Resonance Energy Transfer when both “donor” and “acceptor” are fluorescent. For instance, one of the main requirements for the FRET phenomenon to occur is the proximity between the “donor” and the “acceptor”, allowing the transference of energy between them, instead of being dissipated in the surrounding medium. Another essential requirement is the overlap of the acceptor excitation and the donor emission spectra (Parra, Jesús, and Paradinas Citation2014).
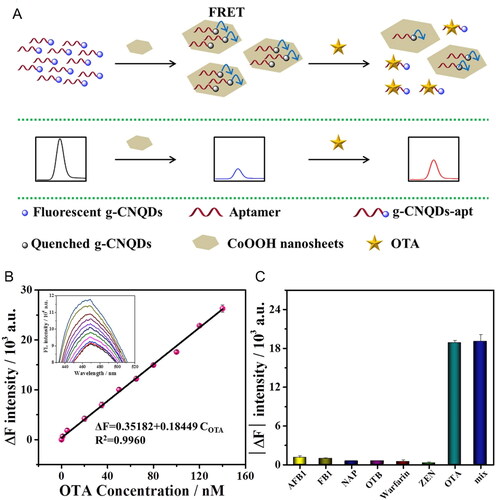
FRET-based aptasensor for OTA detection was reported by Bi et al. (Citation2020), as depicted in . The detection method of the fluorescence aptasensor was based on the quenching phenomenon of cobalt oxyhydroxide nanosheets (CoOOH NSs). The biosensor was composed of “donor-acceptor” pair of graphitic carbon nitride QDs (g-CN QDs) linked to the aptamer and CoOOH NSs. The presence of OTA influenced the FRET process between the “donor-acceptor” pair. The fluorescence emission intensity of g-CNQDs-apt increased according to OTA concentration, as shown in . The LOD value of the biosensor was measured as being 0.5 nM. The exposure of spiked corn and barley flour samples achieved RSD values under 2.24%, with recovery values from 95.4% to 101%. The specificity of the biosensor was tested with other compounds (i.e., OTA analogues and other mycotoxins) and their mixture containing OTA (). In the presence of OTA, the results showed that the fluorescence recovery of the g-CNQDs-apt was reliable, with the results obtained when the OTA content was pure, indicating excellent selectivity.
Figure 10. Schematic representation of working mode of FRET-based aptasensor for OTA detection at (a), and the linear relationship of the recovered fluorescence intensity (ΔF at 469 nm) plotted against OTA concentration between 0 and 160 nM; insert of fluorescence intensity spectra at the various concentrations of OTA at (b). Selectivity evaluation using mycotoxins or similar chemical molecules at (c) Reprinted with permission from Bi et al. (Citation2020). Copyright 2020 Elsevier.
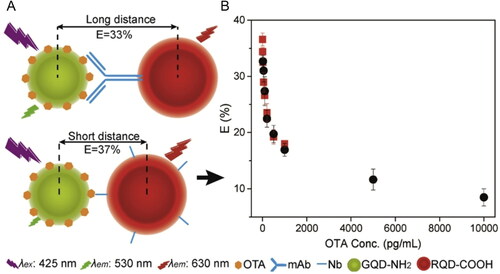
In another study, Tang et al. (Citation2020) proposed the development of a FRET immunosensor based on modified ZnCdSe/ZnS QDs. The biorecognition strategy varied from the nanobody (Nb) and monoclonal Ab (mAb) immobilization. However, the most promising results were achieved in Nb immobilization, due to the extremely small size that provides a more suitable sensitive FRET-based immunoassay. The effective distance between the “donor” (OTA-GQDs-10) and the “acceptor” (Nb-RQDs-5) was a crucial parameter to enhance the energy transfer efficiency and improve the detection limit of the biosensor, as demonstrated in . The competitive binding between both elements reduced the FRET efficiency and, consequently, the fluorescence intensity decreased, as shown in . Regarding the Nb immobilization approach, the LOD value achieved was 5 pg mL−1 with a detection range established between 0.005 to 1 ng mL−1, as shown in (square). Under the same experimental conditions, the mAb-FRET immunosensor exhibited a LOD value of 50 pg mL−1 with a detection range established between 0.05 to 10 ng mL−1, as shown in (circle).
Figure 11. Schematic representation of working mode of FRET-based immunosensor using Nb and mAb immobilization for OTA detection at (a) and the energy transfer efficiency plotted against OTA concentration, between 0.005 and 10,000 pg mL−1, being the Nb biodetection approach represented by the square symbol and the mAb symbolized by the circle, at (B). Reprinted with permission from Tang et al. (Citation2020). Copyright 2020 Elsevier.
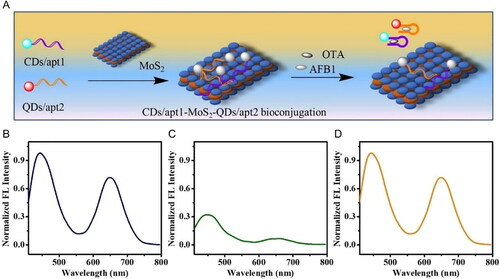
A bi-color FRET effect between a single nano-acceptor (MoS2 NS), and two different nano-donors (carbon dots (CDs) and CdZnTe QDs) was developed by Qian et al. (Citation2020), as demonstrated in . The CDs and CdZnTe QDs were functionalized with two specific aptamers for AFB1 and OTA detection, respectively, and their representative fluorescence spectra are exhibited in . The spectra overlap between the absorption spectrum of MoS2 NSs and the “donors” emission spectra allowed the simultaneous mycotoxin detection, as shown in . The bio-interaction of both mycotoxins and their respective aptamer led to the release of the complex CDs-ap1t-AFB1 and CdZnTe QDs-apt2-OTA from the surface of the MoS2 NS and, consequently, signal variations in the Fourier Transform Infrared (FTIR) spectra were detected. The increasing mycotoxin concentrations also caused an increase in the normalized fluorescence intensity of the biosensor, as shown in . Regarding OTA mycotoxin, the detection range was established between 0.02 to 5 ng mL−1, and the LOD value was calculated as 7.1 pg mL−1. Spiked peanut samples were tested, and the recovery of the biosensor was obtained between a range of 96.7 to 107.0%, with an RSD value below 7.8%.
Figure 12. Schematic representation of fabrication and working mode of the FRET aptasensor for OTA detection in (a). Representative normalized fluorescence spectra of the mixture of CDs/apt1 and QDs/apt2 (b), CDs/apt1-MoS2-QDs/apt2 bioconjugations before (c) and after (d) incubation with AFB1 and OTA. Reprinted with permission from Qian et al. (Citation2020). Copyright 2020 Elsevier.
Luminescence resonance energy transfer (LRET)
The OTA detection based on persistent Luminescence Resonance Energy Transfer (LRET) phenomenon was reported by Jiang et al. (Citation2020). This photophysical radiative process is a derivative of the FRET technique. This phenomenon relies on the transference of energy between two nearby fluorophores when the emission spectrum of the “donor” luminophore overlaps the absorption spectrum of the “acceptor” fluorophore (Bhattacharya, Bernasconi, and Picard Citation2018). Thus, the optical biosensing detection is based on the persistent luminescence NPs (PLNPs) that store excitation energy and emit long-lasting luminescence.
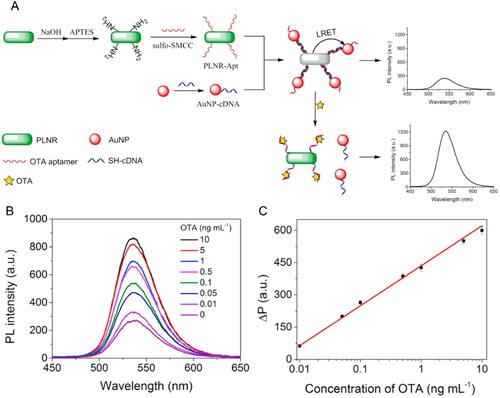
An LRET-aptasensor for OTA detection was developed, using a “donor” complex, OTA aptamer immobilized in a persistent luminescence nanorod (Zn2GeO4:Mn2+ PLNR-Apt), and an “acceptor” complex, a cDNA linked to Au NPs. In the presence of OTA content, the aim target competed with the Au NPs-cDNA to bound at the PLNR-Apt. The Au NPs were released from the complex, causing the persistent emission of the luminescence by PLNR-Apt, as shown in . The aptasensor presented a dynamic performance of luminescence signal when exposed to OTA, as demonstrated in . Through the linear relationship between the recovered PLNR and the OTA concentration, the LOD value was calculated to be 3 pg mL−1 with an RSD value of 2.7% (). The feasibility of the biosensor was tested with real spiked beer samples achieving recovery values between 92.3 to 104%.
Figure 13. Schematic representation of fabrication and working mode of the LRET aptasensor for OTA detection in (a). Persistent luminescence (PL) intensity at different OTA concentrations in (b) and the linear relationship between the recovered PL (ΔP) and OTA concentration among 0.01 and 10 ng mL−1 in (c). Reprinted with permission from Jiang et al. (Citation2020). Copyright 2020 Elsevier.
Surface plasmon resonance (SPR) and localized surface plasmon resonance (LSPR)
Optical biosensors based on Surface Plasmons (SPs) appear as an emerging detection method among traditional signal-transduction mechanisms, since they present several interesting sensing characteristics. The resonance between collective oscillations of the surface conduction electrons in a metal and a incident electromagnetic field is defined as a plasmonic effect. The plasmonic effect can occur on a continuous metallic surface. In this case, the light-matter interaction propagates along the metal-dielectric interface, leading to the well-known Surface Plasmon Resonance (SPR) phenomenon (Zalevsky and Abdulhalim Citation2014). Besides the SPR effect, Localized Surface Plasmon Resonance (LSPR) is characterized by the occurrence of the plasmonic effect in confined metallic nanostructures or NPs. SPR and LSPR-based sensors detect RI changes in the dielectric surroundings at different plasmon decay lengths, generating a detectable wavelength shift or signal intensity of the plasmonic band (Zalevsky and Abdulhalim Citation2014). Therefore, changes in the excitation of plasmons can suggest molecular adsorption of small molecules, ligand-receptor binding, protein adsorption, and nucleic acid hybridization, among others (Peixoto de Almeida et al. Citation2014).
The application of the SPR phenomenon can be a new biotechnology sensing approach (Ravindran et al. Citation2021). A label-free and selective SPR-based sensor was developed by Akgönüllü, Armutcu, and Denizli (Citation2021) to detect OTA. The SPR (Au) biosensor chip was immobilized with a specific MIPs capable of interacting with target OTA molecules. The biosensor performance was divided into several steps: 1) incubation of equilibration buffer, 2) addition of OTA solutions, and 3) desorption of OTA through the addition of cleaning solutions. The interaction between OTA and the polymer surface changed the RI of their surroundings, and, consequently, the resonance angle drifted in refractivity spectra. Several samples (i.e., aqueous solutions, and dried fig) were used for real-time detection. The relationship between the OTA concentration and the reflectivity is proportional. The LOD and LOQ values were calculated at 0.028 and 0.093 ng mL−1 in a linear dynamic range established between 0.1 ng mL−1 and 20 ng mL−1. Real samples (i.e., dried fig) were spiked with several concentrations, and the results confirmed the SPR sensor accuracy with a recovery range between 98 and 100% and an RSD of 1.75 to 2.46%.
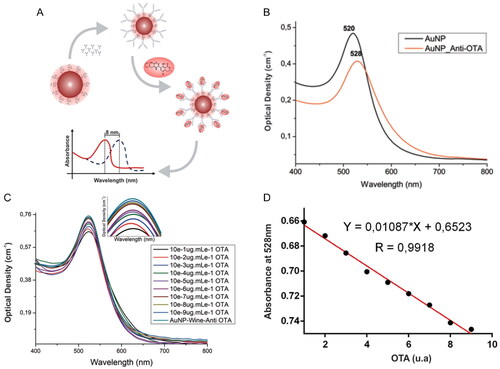
An immunosensor, taking advantage of the LSPR phenomenon, for OTA detection was developed by Pereira et al. (Citation2021). The OTA immunosensor was based on the physical adsorption of the OTA Ab on the surface of colloidal Au NPs. The detection approach was based on detectable variations in the absorption intensity of the LSPR band. The colloidal suspension showed an intense extinction of light at 520 nm. However, the addition of the OTA mAb led to variations of the RI of the surrounding media, causing a maximum extinction shift to 528 nm, as demonstrated in . In the presence of OTA content in white wine, the bio-reaction between the OTA and the immobilized Ab caused a linear decrease in the absorption intensity of the LSPR band at 528 nm, as shown in . The bioanalytical performance parameters were tested in real spiked samples (i.e., water, and wine), and the LSPR nanosensor revealed a final optical response within a minute. Through the linear relationship between the absorption intensity at 528 nm and the OTA concentration (), the LOD value was calculated at 0.001 pg mL−1 with correlation coefficients of 0.99. The linear dynamic range was established between 10−9 to 10−1 µg mL−1.
Figure 14. Schematic representation of working mode of the LSPR immunosensor detecting OTA and this optical response in (a). UV-vis absorption spectra of the colloidal Au NPs before and after adding OTA antibodies in (b). UV-vis absorption spectra at different OTA concentrations in (c) and the linear relationship between the absorbance intensity (528 nm) and OTA concentration in (d), using spiked wine samples. Reprinted with permission from Pereira et al. (Citation2021). Copyright 2021 Elsevier.
Surface-enhanced Raman scattering (SERS)
Surface-enhanced Raman Scattering (SERS) phenomenon is a well-established method for sensitive detection of biological analytes (Langer et al. Citation2020). This non-radiative phenomenon amplifies the common weak Raman signals at many orders of magnitude. The fundament of SERS lies in the surface plasmon resonance (SPR) phenomenon between the noble metallic NP and the incident light. The SERS effect falls in electromagnetic (i.e., LSP excitation) and chemical enhancement (i.e., charge-transference); however, the significant enhancement is played by the electromagnetic effect (Langer et al. Citation2020). When the incident light reaches the nanometallic material, the excitation of the surface plasmon occurs on the metal surface. The strong scattering and absorption of light leads to an enhancement of the electromagnetic field at specific sites of the metallic NP (Rycenga et al. Citation2010). The scattering frequency is different from the incident light frequency, and the Raman scattering is instigated due to the stronger electromagnetic field next to the metal surface (Uskoković-Marković et al. Citation2016). Afterwards, the bio-interaction leads to a change of the surface plasmon energy and, consequently, the detection based on the SERS phenomenon delivers a structural analysis through the complete vibrational information of the aimed analyte molecule (Uskoković-Marković et al. Citation2016). Biosensors based on the SERS phenomenon are commonly used for mycotoxin detection, namely OTA, with an amplification strategy (Rodriguez et al. Citation2020; Huang et al. Citation2020a; Huang et al. Citation2020c).
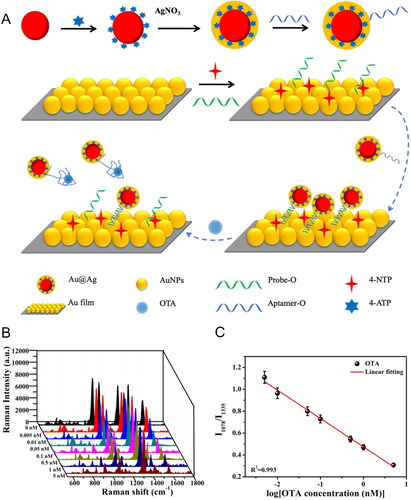
Jing et al. (Citation2020) developed an accurate aptasensor based on the SERS effect in Au Film - Au@Ag core-shell NPs for OTA detection, as demonstrated in . Two standard molecules were used as Raman reporters, one linked to the Au@Ag NPs (i.e., 4-ATP) and the other linked to the Au NPs film (i.e., 4-NTP). The application of Raman reporters is commonly used to deliver information and confirm biological interaction. The Raman reporters’ molecules present a strong enhanced SERS signal, exhibiting a well-known intensity peak of easy detection (Langer et al. Citation2020). The Au Film - Au@Ag core-shell NPs complex was associated by aptamer hybridization (i.e., aptamer and probe linkage). The interaction between the OTA and their specific aptamer caused the release of Au@Ag core-shell NPs from the Au NPs film. Consequently, the intensity of the specific reporter Raman signal (i.e., 4-ATP) at 1078 cm−1 was reduced, and the intensity of another reporter Raman signal (i.e., 4-NTP) at 1335 cm−1 remained stable, as shown in . Through the ratio between the intensity of both Raman signals, the LOD value was established at 5 pM and an RSD value of 0.94% (). The aptasensor was exposed to spiked red wine samples, achieving recovery values from 96.12 to 97.24%.
Figure 15. Schematic representation of fabrication and the working mode of Au Film − Au@Ag core − sell NP structured SERS aptasensor for OTA detection at (a). SERS spectra at different concentrations of OTA in (b) and the linear relationship between the Raman intensity ratio and the logarithmic OTA concentration in (c). Reprinted with permission from Jing et al. (Citation2020). Copyright 2020 American Chemical Society.
A SERS-based competitive immunosensor for OTA detection was reported by Ding et al. (Citation2020). The assay consists of two parts: OTA-BSA-immobilized SERS nanotags and anti-OTA Ab-functionalized magnetic beads (MBs). In the presence of the target OTA, a competitive reaction occurred among the target OTA and the OTA-BSA-immobilized SERS nanotags complex towards the anti-OTA Ab-functionalized MBs. Therefore, the immunosensor responded with the decrease of the intensity of Raman peak in the SERS signal since the amount of SERS nanotags linked to the anti-OTA-Ab decreased. A linear correlation was found in a range of concentrations between 1 pg mL−1 to 1000 pg mL−1, and the LOD value was calculated as 0.61 pg mL−1. The recovery rates obtained in a spiked red wine samples analysis were established between 90.6% to 103.3%, and an RSD value between 2.47% to 2.97%.
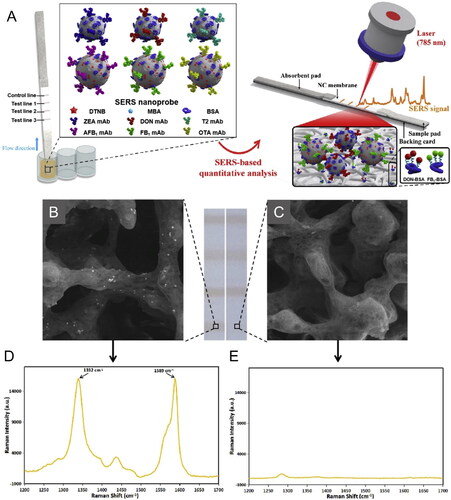
New dual-mode optical detection approaches using an immunochromatographic strip, based on a microfluidic paper-based analytical device, have been successfully developed for OTA sensing. Zhang et al. (Citation2020) developed a LFIA based on the combination between the SERS and fluorescence phenomena for the detection of several mycotoxins. SERS-based Au@Ag core-shell NPs were labeled with two Raman reporters’ molecules (i.e., DTNB and MBA), and six specific hapten-protein conjugates were distributed in the three T-line of nitrocellulose membrane, as demonstrated in . The interaction between the mycotoxin and the nanometallic structure led to variations in the SERS signal intensity. In the absence of OTA content, several SERS nanoprobes were linked to the nanostructure, and the spectral features were detected, as shown in . However, the increase of the specific mycotoxin concentration led to the decrease of SERS signal intensities of each T-line, as shown in . Regarding the OTA detection, spiked maize samples were exposed to the biosensor, and the LOD value was established at 15.7 pg mL−1 with a detection range between 0.027 to 6.7 ng mL−1. Thus, the immunosensor revealed satisfactory sensing performance (i.e., accuracy and precision).
Figure 16. Schematic representation of the working mode of the multiplex SERS-based lateral flow immunosensor for OTA detection in (a). Representative SEM images and Raman spectra from the test lines of negative sample in (b, d) and strong positive sample in (c, e). Reprinted with permission from Zhang et al. (Citation2020). Copyright 2020 Elsevier.
The multi-detection of OTA and another mycotoxin (i.e., AFB1) was achieved through a signal-enhanced SERS biosensor, as Kutsanedzie et al. (Citation2020) reported. This biosensor was based on Ag NPs, with a high analytical enhancement factor, coupled with variable chemometric algorithms. The established LOD value for OTA detection was 2.63 pg mL−1 in spiked cocoa bean samples, with recovery rates between 98.58 and 108.44%.
Colorimetry
Colorimetry have become a promising intuitive detection strategy since the signal outcome can be realized by naked-eye visual recognition. Colorimetric sensing takes advantage of the LSPR phenomenon in metallic NPs (e.g., Ag or Au). Typically, the colorimetric-based biosensor presents an immobilized biorecognition element in a metallic NP. The bio-interaction between the biorecognition element and the aimed target leads to both LSPR spectra shift and color variations due to the surface plasmon coupling induced by aggregation or dispersion of NPs (Wang et al. Citation2019). This optical biosensing method provides several interesting advantages: i) a fast detection speed, ii) cost-effective biodetection device, iii) well-established chemistry assay with a simple result understanding, since the biosensing performance is based on visible variations of the color intensity in the test solution (Alberti et al. Citation2020). However, this method is not appropriate for quantitative detection (Alberti et al. Citation2020). The detection of biological analyte at low concentrations will cause a negligible visual color intensity variation, leading to a short dynamic range for biodetection, besides being extremely sensitive to external conditions (i.e., temperature and pH) (Mauriz Citation2020). Therefore, this biosensing method is usually combined with other sensing approaches, allowing their independent response but mutual confirmation. The independent dual-readout immunoassay can be a relevant alternative to improve the accuracy and precision of this biosensing approach.
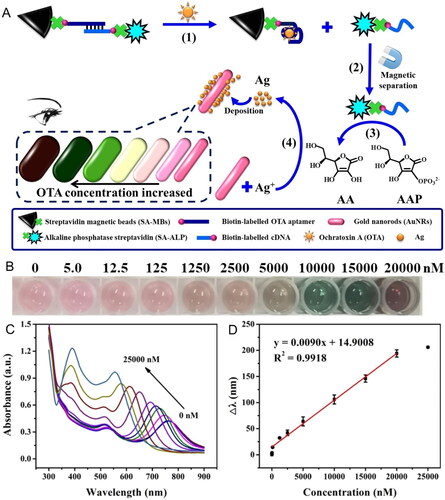
Tian et al. (Citation2020) reported a multi-colorimetric detection method against OTA by developing an enzyme-induced aptasensor in a silver nanoshell on the surface of Au nanorods (Au NRs@Ag), as demonstrated in . Streptavidin MBs (SA-MBs) were immobilized by a biotinylated OTA aptamer (OTA aptamer - SA-MBs), and this aptamer was linked to a biotinylated DNA-alkaline phosphatase enzyme (cDNA- SA-ALP). In the presence of OTA, the bio-interaction between the mycotoxin and its aptamer led to G-quadruplex (GQx) molecular structure creation and, consequently, the release of the DNA-ALP complex. After magnetic separation, the catalysation of ALP created a product that caused the reduction of Ag+ allowing the development of Au NRs@Ag. The biological interaction between the target and the complex generated a longitudinal LSPR peak shift of Au NRs. The increase of OTA concentration caused a visible naked eye change of the solution to darker colors () and a blueshift of the LSPR peak (). In spiked grape juice samples, the quantification method determined the LOD value at 9 nM with a linear detection range of 12.5 to 20000 nM () and an RSD value below 8.3%.
Figure 17. Schematic representation of the working mode of the multi-colorimetric based on the structural switching of aptamer and the enzyme-induced deposition of AuNRs for OTA detection in (a). Photographs of the enzyme-induced aptasensor solutions (b) and UV-vis absorption spectra (c) at different OTA concentrations. The linear relationship between the blueshift of the longitudinal LSPR peak (Δλ) and OTA concentration among 12.5 to 20000 nM at (d). Reprinted with permission from Tian et al. (Citation2020). Copyright 2020 Elsevier.
Zhu et al. (Citation2021b) developed a multi-colorimetric immunosensor through the mimetic enzyme etching of Au nanobipyramids (Au NBPs). In an antigen-coated 96-well plate, a mixture of different concentrations of aimed OTA and fixed concentrations of OTA Ab (Ab1) were added. The immobilized antigen and the free OTA competed for the combination to Ab1. As higher OTA concentration, less of the immobilized Ab1. A Cu2O-labeled with a secondary Ab (Ab2) linked to the remaining free OTA, and TMB was added to the solution to promote the TMB2+ appearance. The TMB2+ content was inversely proportional to Cu2O@Ab2 and, consequently, to OTA concentration. The interaction between TMB2+ and Au NBPs spontaneously changed the solution’s colors identified through naked eye. The LSPR peak of the Au NBPs changed according to the logarithm of OTA concentration. The detection range of this biosensor was established between 1 ng L−1 to 5 µg L−1, and the LOD value was calculated at 0.47 ng L−1. In millet spiked samples, the qualitative detection was well performed through color variations to vivid color in the detection area of the immunosensor, and the quantification method determined a wide recovery rate established between 98.6 and 111.4%.
A direct competitive enzyme immunoassay system for OTA detection compatible with smartphone image processing was developed by Zhang et al. (Citation2021b). The competitive enzyme colorimetric immunoassay based on hydrogel microspheres could detect multi-mycotoxins (i.e., OTA and ZEN). This biosensing method is divided into 3 steps: 1) competitive response between the aimed target and artificial antigen to bound at the immobilized mAb in the solid-phase carrier hydrogel particles, 2) signal amplification through the addiction of urea, previously linked to the artificial antigen, leading to a colorimetric ELISA and 3) smartphone analysis program through average brightness value of the particles delivered the final test result. In 30 minutes, the detection process was entirely performed, and within 10 seconds, the results were evaluated through the smartphone analysis program. The LOD value of this biosensor was calculated as 0.77 ng L−1 for the OTA molecule, and the linear dynamic range was established between 0.001 to 100 ng mL−1. Real spiked samples (i.e., dry corn) were tested in this biosensing platform, and the detection results revealed a recovery range between 80.83 to 115.67% and an RSD of 6.02 to 6.52%.
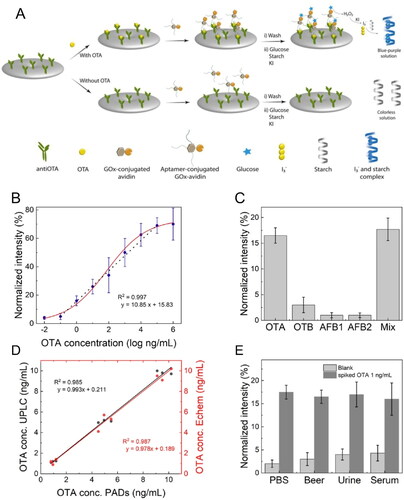
New colorimetric detection approaches have been created using an LFIA paper-based (bio)analytical technique. Typically, the LFIA sensing approach requires the use of metallic NPs (e.g., Ag or Au) to detect OTA, possibly increasing the production cost of the biosensor. Thus, Suea-Ngam et al. (Citation2020) developed an ultrasensitive detection method against OTA based on a non-noble metal colorimetric assay in a paper-based analytical device. The immobilization of OTA Ab in a cellulose surface allowed the OTA capture. In the sandwich mechanism, OTA was labeled with an aptamer-conjugated glucose oxidase (AGOx). With the addition of other chemical compounds, the AGOx released the hydrogen peroxide (H2O2), leading to a distinct color change to blue in a positive test, as demonstrated in . In the absence of the aimed mycotoxin, the solution remained colorless. The color intensity and the OTA concentration quantification were analyzed through a smartphone-captured image process. The linear detection range was established between 10−1 and 105 ng mL−1 () with a LOD and LOQ values of 20 and 320 pg mL−1, respectively. The selectivity evaluation of the biosensor noted negligible responses to other interferents (). To evaluate the assay accuracy, the biosensor system was compared to other detection methods (i.e., Ultrahigh Performance Liquid Chromatography (UPLC) and an electrochemical aptasensor), and the results showed a good agreement with a 95% confidence level, as demonstrated in . The biosensor was tested in several real spiked samples (), performing a recovery range between 95 and 117% and an RSD value lower than 5%. However, artificial serum and urine samples showed a higher signal variance, possibly due to the high concentration of proteins in the samples, which severely influences the sandwich complex formation. Finally, after 30 days of storage, the sensor’s performance was affected by a 20% reduction in signal intensity, possibly due to the denaturation of Ab in the biosensor.
Figure 18. Schematic representation of the working mode of a colorimetric immunosensor based on a paper-based analytical device for OTA detection in (a). Variation of normalized absorbance signal as a function of OTA concentration in (b) and normalized signal intensity was obtained from potential interferents in (c). Detection comparison between the reported biosensor and other sensing detection at several OTA concentrations in (d). Normalized signal intensity was obtained from different several real spiked samples (i.e., beer, urine, and serum) in (e). Reprinted with permission from Suea-Ngam et al. (Citation2020). Copyright 2020 Elsevier.
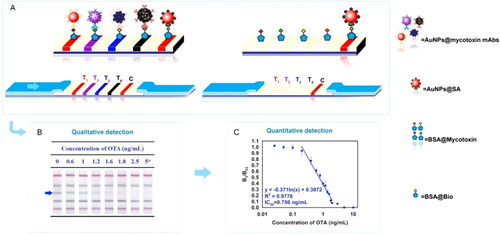
LFIA biosensing can be also developed for simultaneous multi-target detection in a single immunochromatographic test strip, improving the sensing assay to all the possible toxic components present in a representative sample of the food product. The development of a multicolor immunochromatographic test strip nanosensor capable of detecting several mycotoxins was developed by Wu et al. (Citation2020). The sensing device for the simultaneous detection of OTA and other mycotoxins (i.e., FUM1, ZEN, and AFB1) was composed of four T lines and an independent C line, as demonstrated in . The T lines were differentiated by four different structures of Au NPs (i.e., nanospheres, nanocacti, nanoflowers, and hyperbranched blackbodies), with distinct absorption peaks linked to the corresponding Ab. The correspondence between a specific signal from the T line and the target presence allowed the naked eye visual detection, as represented in . The biosensing system presented a LOD value of 0.096 ng mL−1 calculated through the linear relationship between the optical signal and OTA concentration, as shown in . The feasibility was tested with spiked corn samples at different concentrations, achieving high-level sensitivity for the simultaneous mycotoxins detection.
Figure 19. Schematic representation of the working mode of the AuNPs-based multicolor immunochromatographic test strip biosensor in (a). Stereograms of the individual test at different OTA concentrations (marked with an arrow) in (b) and the linear relationship between the optical signal (B3/B03) and OTA concentration in (c). Reprinted with permission from Wu et al. (Citation2020). Copyright 2020 Elsevier.
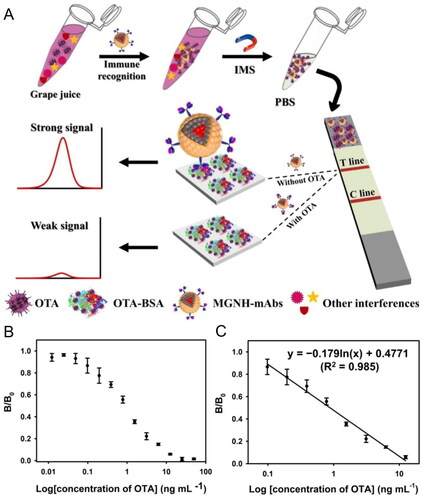
As previous shown, this sensing approach has significant limitations on real sample foodstuff. First, the grape juice was prepared by crushing and blending grapes into purple liquid juice. The Au NPs-LFIA sensing technique cannot be used as an OTA detection method in juice grapes since it has inadequate resistance to background matrix and color interference. To overcome this limitation, Hao et al. (Citation2021) created an alternative using bifunctional magneto-Au nanohybrids (MGNHs) by encapsulating oleylamine-coated AuNPs (OA-AuNPs) with oleic acid-coated iron oxide NPs (OC-IONPs) into polymer nanobeads. The MGNHs were conjugated with an mAb and exposed to a grape juice deliberately contaminated with several concentrations of OTA (between a range of 0.39 to 3.12 ng mL−1). After the immunoreaction, the MGNH-Ab-OTA complex and the MGNH-mAb free were collected to run the competitive LFIA test strip, as demonstrated in . In the presence of target OTA, the MGNH-mAb-OTA complex could not generate the signal from the T line in the LFIA device. Thus, the concentration of OTA in the sample had the opposite effect on the optical density value of the T line (). The LOD value was calculated as 0.094 ng mL−1, through the determination of the competitive inhibition curve for OTA concentration ranging from 0.098 ng mL−1 to 12.5 ng mL−1 (). The selectivity of the developed biosensor was successfully tested against other mycotoxins; moreover, the detection results from this MGNH-LFIA approach corresponded nicely with the current LC-MS detection method.
Figure 20. Schematic representation of the fabrication and working mode of the magneto-Au nanohybrid-enhanced LFIA biosensor for OTA detection in (a). Optical response at different OTA concentrations in (b) and the linear relationship between the optical signal (B/B0) and the logarithm of OTA concentration in (c). Reprinted with permission from Hao et al. (Citation2021). Copyright 2021 Elsevier.
Dual-mode optical detection – colorimetry and fluorescence
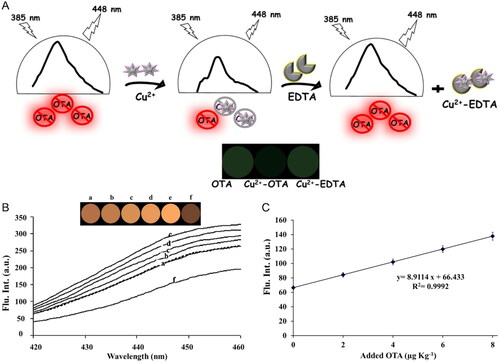
The nanotechnology vanguard outstands the combination of several optical phenomena highlighting its advantages in biosensing detection: i) higher sensitivity, ii) a wider range of detection, iii) a faster detection speed, and iv) a reciprocated validation. An intrinsic characteristic of the biological analyte can be the key to its optical detection since OTA individually exhibits a good fluorescence emission signal at 448 nm. Knowing this particular feature, Alizadeh, Hashemi, and Shahdost-Fard (Citation2021) focused on the spectrofluorimetric study of the OTA-metal cations (i.e., Cu2+) complexation, since the complex formation altered OTA fluorescence intensity. The introduction of Cu2+ enabled the formation of a non-fluorescent complex with OTA. However, the complex formation was reversible, by adding a masking agent (i.e., EDTA) that formed a stronger complex with Cu2+ than OTA. This chemical reaction eliminated the Cu2+-OTA complex, and the fluorescence response recovered its initial signal (). The developed biosensor was based on hybrid fluorimetric and visual detection, exhibiting LOD and LOQ values of 0.4 and 1.2 ng g−1, respectively. The efficiency of the proposed strategy was tested in four different types of non-extracted samples and a moldy sample of wheat flour. The fluorescence spectrum of a non-extracted sample is shown in – a. However, the extracted samples were spiked with different OTA concentrations. The fluorescence intensity increased linearly ( from b – e), allowing the determination of a linear relationship between the fluorescence intensity and OTA concentration (). The hybrid fluorimetric and visual OTA color detection was provided by a color difference map (CDM) extracted from the fluorimetric studies, as shown in . The addition of Cu2+ led to a decrease in fluorescence intensity. Nevertheless, it did not achieve the initial blank sample signal indicating the possibility of OTA contamination in the non-extracted blank samples ().
Figure 21. Schematic representation of the hybrid fluorimetry and visual OTA detection in the absence and presence of Cu2+ and EDTA in (a). Fluorescence intensity spectra of a non-extracted blank sample (b – a), spiked samples with an increased linear concentration in (b from b – e), after the addition of Cu2+ to the spiked sample in (b – f) and their corresponding color difference map (CDM) images. The linear relationship between the fluorescence intensity and OTA concentration is plotted in (c). Reprinted with permission from Alizadeh, Hashemi, and Shahdost-Fard (Citation2021). Copyright 2021 Elsevier.
The development of a fluorescent microsphere in an immunochromatographic test strip (FM-ICTS) allowed OTA dual-optical detection in a single device. Cheng et al. (Citation2020) reported a specific optical sensor based on a similar LFIA technique; however, it provides an improved visible fluorescent signal in a portable device. As the concentration of the OTA increased, the fluorescence intensity decreased. The fluorescence intensity was quantified in a strip reader by establishing the fitting curve. The assay’s sensitivity was tested in rice flour samples achieving a LOD value of 1.27 ng mL−1. In turn, Zhou et al. (Citation2021) developed an improved OTA immunochromatographic test strip based on a fluorescence signal probe of CdSe/ZnS QDs. In 15 minutes, the immunoreaction occurs, and the sensing device provides a qualitative signal characterized by the disappearance of the T line. For the quantification detection, the fluorescence intensity of T and C lines was measured, and its ratio was recorded through an immunochromatographic test strip analyzer. The biosensor was able for qualitative and quantitative detection, achieving LOD values of 2.5 and 0.07 ng mL−1, respectively. The sensing device was tested using several spiked corn samples and responded at a recovery rate ranging from 94.29 to 104.62%.
Zhu et al. (Citation2021a) developed a dual-modal multi-colorimetric and ratiometric fluorescence immunosensor, as demonstrated in . In an antigen-coated 96-well plate, a mixture of different concentrations of free aimed OTA and fixed concentrations of OTA Ab (Ab1) was added. Consequently, the antigen, previously fixed at a 96-well plate, and free aimed OTA competes for the OTA Ab (Ab1) linkage. As the higher the OTA concentration, the less Ab1 was immobilized. Cu2O@Fe(OH)3 NPs, previously bound to a second OTA Ab (Ab2), were added, culminating in an immunoreaction. After the immunoreaction step, an antigen-Ab1-Ab2 complex structure was developed, and the unconjugated solution was collected for both detection assays. A fixed volume of the unconjugated mixture (OTA-Ab2-Cu2O@Fe(OH)3 NPs) was exposed to Au NRs, allowing colorimetric detection. The increasing concentration of the mycotoxin caused a blueshift in the LSPR peak, as demonstrated in . Consequently, it was perceptible alterations in the color of the solution sample, as shown in . The LOD value was calculated as 0.83 ng L−1, through the linear relationship between the LSPR peak shift and OTA concentration, as exhibited in . However, the quantitative method was based on ratiometric fluorescence detection. The unconjugated solution with Cu2O@Fe(OH)3 NPs oxidized the o-phenylenediamine (OPD), colorless, to 2,3-diaminophenazin (DAP), exhibiting yellow color, in the presence of H2O2. Due to the inner filter effect between DAP and CDs, this reaction caused variations in the fluorescence spectra. The fluorescence spectra evolved to the decrease of CDs intensity peak at 424 nm and increase of DAP intensity peak at 563 nm (), and the color of the solution turned from blue to yellow, as shown in . The relation between the fluorescence intensity of both DAP and CDs allowed the LOD value calculation to be 0.56 ng L−1 between a range of 0.1 ng L−1 to 10 µg L−1 through the linear calibration curve, as exhibited in . The potential of the dual-modal strategy was tested in three concentrations of real spiked samples, and the results were promising.
Figure 22. Schematic representation of the working mode of the dual-modal immunosensor for OTA detection: multi-colorimetric and ratiometric fluorescence in (a). UV-vis absorption spectra (b) and fluorescence spectra (c) at different concentrations of OTA and their photographs in (d) and (e), respectively. The linear relationship between LSPR peak shift in (f) and fluorescence intensity ratio in (g) with OTA concentration. Reprinted with permission from Zhu et al. (Citation2021a). Copyright 2021 Elsevier.
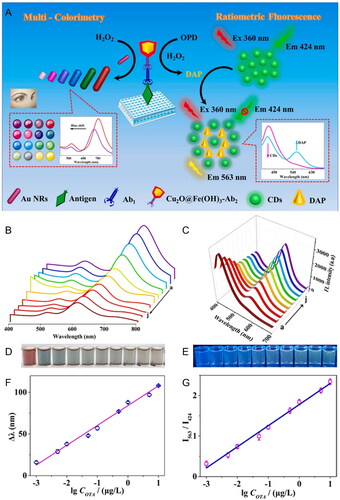
Dual-mode optical detection – colorimetry and chemiluminescence
Chemiluminescence phenomenon relies on the occurrence of luminescence, caused by releasing energy from a chemical reaction. The transition between the electronically excited state of a particular molecule to the ground state leads to light emission with a proper wavelength (G. Li Citation2018). The combination of both colorimetric and chemiluminescence methods for OTA detection was reported by Mukherjee, Nandhini, and Bhatt (Citation2021). The sensing detection was developed through an enzyme-linked apta-sorbent (ELASA) assay coupled with colorimetric and chemiluminescent enzymes. Compared to ELISA, the ELASA assay enhances the sensitivity and specificity of the sensing system due to the dual biorecognition elements. In the presence of OTA, the aptamer was linked to the mycotoxin. The OTA was exposed to an anti-OTA IgG primary Ab followed by anti-rabbit ALP tagged secondary Ab. The colorimetric detection (Co-ELASA) occurred when the anti-rabbit ALP tagged reacted with the substrate (i.e., p-NPP), resulting in a color variation and measurement of absorbance, as demonstrated in . Regarding the chemiluminescent assay (Cl-ELASA), the interaction between the mycotoxin and the anti-OTA IgG complex can be identified by adding a biotinylated OTA aptamer and streptavidin-HRP (streptavidin linked to horseradish peroxidase). The addition of substrate (i.e., luminol and urea-H2O2) permitted the chemiluminescence effect, as represented in . Both sensing performances revealed a wide range of detection between 1 pg mL−1 to 1 µg mL−1. However, the LOD and LOQ values, for both phenomena effect, were distinct. The linear relationship between inhibition (%) and the relative luminescence with OTA concentration allowed the determination of the LOD values at 0.84 pg mL−1 and 1.29 pg mL−1 for Co-ELASA and Cl-ELASA, respectively (). Regarding the LOQ value, Co-ELASA presented a value of 2.54 pg mL−1 and Cl-ELASA of 3.94 pg mL−1. The feasibility of the biosensor was evaluated in real spiked samples (i.e., groundnut, and coffee bean), achieving reliable results. The cross-reactivity assay focused on the aptamer’s affinity to other mycotoxins reached less than 40%.
Figure 23. Schematic representation of the working mode of the colorimetric ELASA (Co-ELASA) and chemiluminescence ELASA (Cl-ELASA) assays for OTA detection in (a) and (b), respectively. Plots of the linear relationship between inhibition (%), in (c), and relative luminescence, in (d), with OTA concentration between 1 pg mL−1 and 1 µg mL−1. Reprinted with permission from Mukherjee, Nandhini, and Bhatt (Citation2021). Copyright 2021 Elsevier.
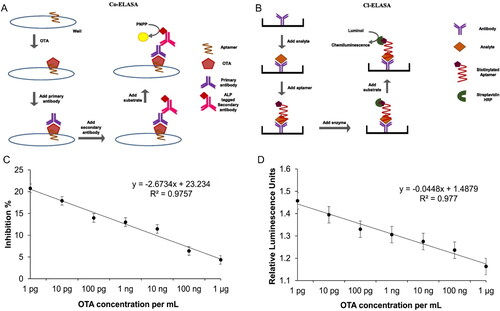
A smartphone-based biosensor composed of LFIA technique coupled with chemiluminescence detection (CL-LFIA) for quantification of OTA in wine, grape must, and coffee samples were reported by Zangheri et al. (Citation2021). The chemiluminescence detection performance occurred through the inclusion of a smartphone camera that worked as both light detector and proper disposable sensing platform (i.e., analytical cartridge), including all the reagents required, represented in . Non-specialized operators could perform the OTA detection using a simple manual operation. The structure of the analytical cartridge, where the immunoassay occurred, is represented in . The immunoassay protocol was divided into 3 steps: 1) injection of the sample in the metering chamber (), 2) loading of the sample and the HRP-OTA conjugate solution to the sample pad of the LFIA strip () and 3) introduction of HRP CL (i.e., luminol/H2O2 and enhancers) substrate (). After finishing the immunoassay, the analytical cartridge was incorporated into the mini dark box connected to the smartphone, and the chemiluminescence signal was detected. The calibration curves were obtained using real spiked samples (i.e., wine, and instant coffee). Being a competitive assay, the intensity of T line is inversely proportional to OTA concentration (). The LOD values were calculated through T line/C line signal ratio corresponding to 0.3 μg L−1 and 0.1 μg L−1 of wine and instant coffee samples, respectively (). Regarding the reproducibility, the RSD value associated with calibration curve was consistently below 12% and 7% for wine and instant coffee, respectively.
Figure 24. Schematic drawing of the dark box with the smartphone adapter in (a) and the photograph of the biosensor device in (b). Schematic representation of assay procedure: the analytical cartridge in (c), sample loading into the proper chamber (d), LFIA strip receiving the sample and the HRP-OTA conjugate solution in (e), the introduction of the HRP CL substrate in (f). Chemiluminescence images obtained by analyzing OTA-free wine and instant coffee samples spiked with known OTA concentrations in (g). Representative calibration curves obtained in spiked wine and instant coffee matrices in (h). Reprinted with permission from Zangheri et al. (Citation2021). Copyright 2021 Elsevier.
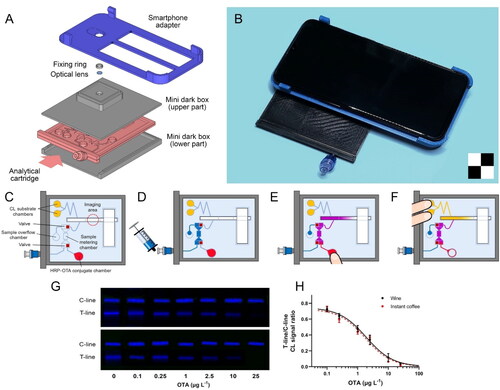
Dual-mode photoelectrochemical detection – chemiluminescence
The development of biosensors with both electrical and optical detection methods is at the forefront of nanotechnology. The introduction of dual detection approaches became relevant, since it confers the ability to detect the aimed target, merging the advantages of electrochemical with optical transducer techniques, achieving high sensitivity and reliability combined with a fast and straightforward visualization detection. Electrochemiluminescence is the combination of electrochemistry and visual luminescence. The application of an electrical current into the surface of an electrode causes the excitation of the luminophore, and, consequently, the return to its fundamental state energy leading to the light-emitting reaction (Martínez-Periñán et al. Citation2020).
A novel bipolar Au-plated electrode-electrochemiluminescence (BPE-ECL) sensing platform was reported by Lu et al. (Citation2021) for OTA detection. The device was composed of a cathode of closed BPE in the functional sensing interface and an anode as a signal collection interface. The ECL signal intensity of the biosensor increased monotonically with OTA concentration, as shown . In this detection approach, the optimization of the pretreatment method of real samples was an essential concern, since the sampling treatment severely influences the aptasensor’s performance (i.e., sensitivity, accuracy, and stability parameters). The analytical performance of the sensor with the simplest pretreatment method presented a LOD value of 3 pg mL−1 with a dynamic range established between 0.01 and 5 ng mL−1 and 5 to 100 ng mL−1. The biosensor was exposed to real spiked grain samples, and the average recovery was calculated at 94.2%.
Figure 25. Electrochemiluminescence (ECL) intensity response of the BPE-ECL biosensor with different OTA concentrations in (a). Variation of ECL signal as a function of OTA concentration; insert of the linear relationship between the ECL intensity signal and logarithm OTA concentration in (b). Reprinted with permission from Lu et al. (Citation2021). Copyright 2021 Elsevier.
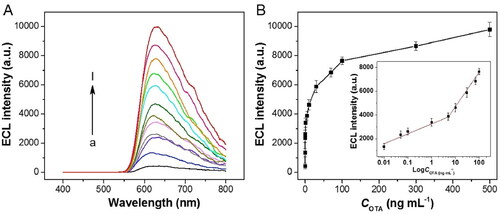
Dual-mode photoelectrochemical detection – colorimetry
A dual-modal electrochemical and optical detection method, based on a paper-based analytical device, was advanced by Zhang et al. Citation2021c and demonstrated in . On the surface of the transducer, a specific aptamer (apta1) allowed the modification of MnO2-Au on the carbon working electrode. After blocking the nonspecific binding site, several concentrations of OTA were included and linked to apta1. The aptasensor was composed by conjugation of apta1-OTA and the second aptamer (apta2) linked to Ch–MoS2-Au@Pt nanocomposite, creating an apta1-OTA-apta2 sandwich-type complex. When the complex was formed, the electrochemical signal increased, as shown in . Using such a detection method, the LOD value was calculated to be 25.2 fg mL−1 with a detection range of 0.0001 to 200 ng mL−1. For the colorimetric detection, the chromogenic reaction led to darker colors with the increase of OTA concentration from 0.1 to 200 ng mL−1, as shown in . The reliability of this method was tested in spiked corn samples achieving an RSD value below 4.10% and an average recovery ratio from 94.8 to 105.0%.
Figure 26. Schematic representation of the fabrication and working mode of the dual-modal electrochemical and optical biosensor for OTA detection in (a). Plots of linear relationship between electrochemical response with OTA concentration displayed in (b from a – h). Plots of linear relationship between colorimetric signal with OTA concentration displayed in (c from a – e). Reprinted with permission from Zhang et al. (Citation2021c). Copyright 2021 Elsevier.
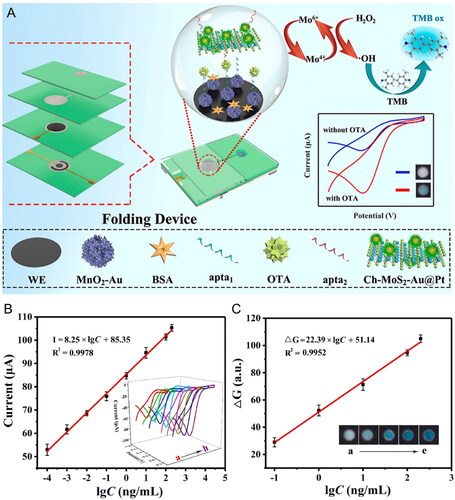
Another dual-modal electrochemical and optical detection system was developed by Hao et al. (Citation2020). The portable solar-driven visualization biosensor was divided into the detection (A) and the reference (B) module, and both modules were also divided into regions (i.e., visual and photoelectric area) in a small graphene-supported cobalt and nitrogen co-doped titanium dioxide (Co,N-TiO2/3DGH) nanocomposite in an indium tin oxide (ITO) electrode, as represented in . The visual area was modified by electrochromic Prussian Blue (PB), present in region 1, and the photoelectric sensing area was composed of Co, N-TiO2/3DGH nanocomposite, at region 2. PB changes from blue to colorless Prussian white (PW) when irradiated with UV light. The interaction between the OTA and the aptamer immobilized in the detection module (A) resulted in a steric hindrance leading to the decrease of the number of electrons injected into the visual area and a slower transformation speed from PB to PW. The reference, module B, remained stable, and it was essential to guarantee feasible detection results. The quantification was based on the absorption intensity ratio of the detection module and the reference module (A2/A1). The UV-visible absorption spectra varied according to OTA concentration, as demonstrated in . Therefore, the absorption intensity ratio increased as the OTA concentration also increased, . The LOD value of the biosensor was determined at 0.29 ng ml−1 with a detection range established between 1 and 500 ng mL−1. In spiked real samples, the RSD value was defined between 2.33% and 3.36%, with a recovery rate calculated to range between 98.0 and 101.2%. The stability of the biosensor was maintained until 20 days in storage. However, this detection platform is sensitive to the intensity of sunlight, weather, and time.
Figure 27. Schematic representation of fabrication of the portable solar-driven ratiometric photo-electrochromic visualization biosensor in (a). The UV-visible absorption spectra at different concentrations of OTA in (b). Calibration curve of absorption intensity A2/A1 ratio and OTA concentration; insert of the linear relationship between absorption intensity A2/A1 ratio and logarithm OTA concentration in (c). Reprinted with permission from Hao et al. (Citation2020). Copyright 2020 Elsevier.
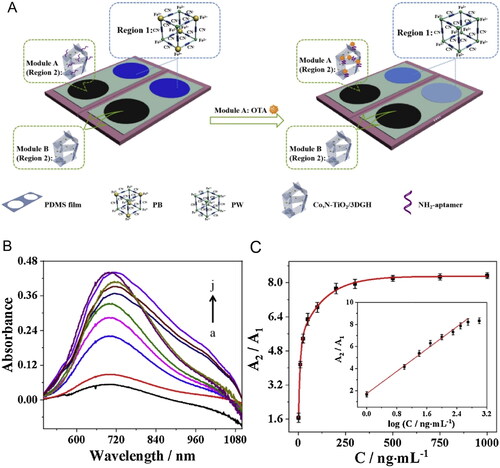
Comparison performance of the different optical biosensors
Innovative nanotechnology-associated detection approaches, with high sensitivity and specificity, have been devised, and should be compared with the standard detection methods, in order to understand the biosensing relevance of the previously described advanced optical detection methods. Therefore, a general scheme identifying the bioanalytical performance parameters (i.e., LOD and LDR) of both conventional detection methods and previously described optical biosensors is shown in . From , it is possible to confirm that the conventional detection methods presented LOD and LDR values limited to a specific concentration range. However, several alternatives of optical detection methods, reported in the previous section, can overlap and widen the detection range to much lower concentrations, confirming the development of high-quality biosensors for OTA detection. The constant advancement of nanotechnology has driven the development of several nanomaterials’ (e.g., NPs, QDs, CDs, GO, and MBs), with distinct features and properties, promising to be employed for a wide variety of biosensing purposes. Thus, the application of nanomaterials in enhanced optical-based detection, taking advantage of optical phenomena (e.g., fluorescence, FRET, LRET, SPR, LSPR, SERS, colorimetry, chemiluminescence, among others) has been revealed as a remarkable biosensing asset for the industrial market.
Figure 28. Schematic representation of the bioanalytical performance parameters (i.e., the limit of detection (LOD) and linear dynamic range (LDR)), converted to ng mL−1, of the conventional detection methods (i.e., HPLC-FD, ELISA, TLC, GC-MS, and LC-MS) and the biosensors described in the previous section ().
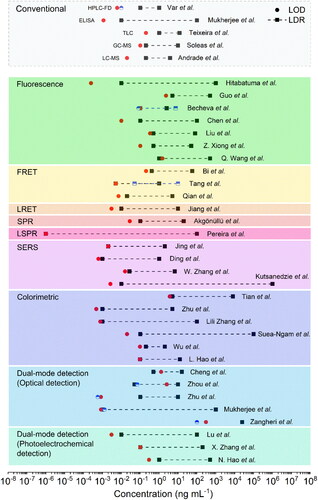
The most popular nanomaterial-based optical biosensors were found to be fluorescence and colorimetric approaches. These detection methods are described as having high sensitivity, specificity, and accuracy, being relevant alternatives compared to other optical sensing techniques. Considering the advantages of these optical methods, a proper multi-sensing approach based on colorimetry and fluorescence combination strategy emerges as an innovative biosensing resource, towards an absolutely reliable detection signal with dual reciprocal validation, beyond the numerous advantages reported. Nevertheless, the biosensing approach based on the LSPR effects of AuNPs conjugated with OTA mAb revealed to be the most suitable biosensor for OTA detection, when dealing with ultra-low concentrations. This optical sensing method provides real-time, highly sensitive monitoring, with a ultra lower detection limit, than the counterparts, and a broad dynamic range convenient for a reliable report of OTA contamination. Therefore, new promising commercial strategies for OTA detection based on the LSPR-biosensing approach encouraged the development of several patents in the past decade, as discussed in the following section.
Patents survey on localized surface plasmon resonance biosensors
Label-free optical transducers using the LSPR phenomenon revealed to be a suitable OTA detection approach. However, from hundreds of patents published involving optical biosensors for OTA detection, only 3 patents focused on the LSPR-biosensing approach have been granted until this moment. These patents were based on several recently published articles and are described below.
An LSPR-based high sensitivity aptamer sensor using an intercalation agent was patented (US201715418100A) by the Gwangju Institute of Science and Technology in Korea on April 23, 2019 (Kim, Jin-Ho, and Byun Citation2018b). The detection strategy of this patented LSPR aptasensor, with enhanced sensitivity, is based on the absorption spectrum changes of the LSPR band of metal NPs (i.e., Au, Pt, Ag NRs). The metallic NPs are fixed to a glass substrate, and, posteriorly, the biorecognition elements (i.e., OTA aptamer) are fixed on the surface of the metallic NPs. The binding event between the aptamer and the mycotoxin creates a GQx molecular structure and, consequently, the RI of the surrounding medium changes, as represented in . After the binding event, the LSPR absorption spectrum of the biosensor suffers a redshift. However, the inclusion of an intercalating agent (i.e., berberine) amplifies the binding effect enabling the detection between a range of 1 pM to 10 µM with an increased sensitivity about 1000 times, as demonstrated in the plots of .
Figure 29. Schematic representation of the working mode of LSPR-based high sensitivity aptasensor for OTA detection in (a). Optical response (LSPR peak shift) of the patented biosensor to increasing OTA concentration, and also to another mycotoxin (i.e., AFB1) in (b). Reprinted from patent application publication no. US201715418100A (Kim, Jin-Ho, and Byun Citation2018b).
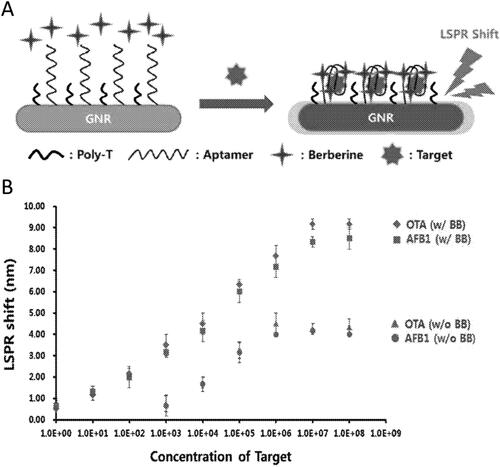
A reusable optical fiber aptasensor based on photo-thermal effect was patented (US201715814312A) on April 20, 2021, by the Gwangju Institute of Science and Technology (Kim et al. Citation2018a). This patent was based on a published article in Biosensor and Bioelectronics Journal in 2018 (Lee et al. Citation2018). The schematic representation of this biosensor is exhibited in . The sensing system is composed of a light output unit, sensor unit, detector, and optical fibers. The light output unit, composed of white light or/and a laser with a specific wavelength (i.e., 786 nm), is transmitted to the biosensor, through the optical fiber, and the refraction of the incident light back to the spectrometer allows the monitoring of LSPR band. The sensor unit is fixed inside a proper optical fiber. The biosensing test consists of the immersion of an optical fiber sensor into a solution containing the target for 30 minutes. The biosensor unit is based on highly sensitive Au NRs (601.05 nm/RIU) functionalized with a specific aptamer for OTA detection on the tip of the optical fiber, as showed in . The interaction between the biosensor and the contaminated liquid sample generates the binding event between the specific aptamer and OTA, leading to the creation of a GQx molecular structure. Consequently, the RI increases at the surrounding medium of the Au NRs. The irradiated light is directed to the optical detector, and the biological response is identified through redshift of the LSPR absorption spectrum of the Au NRs. LSPR band shift is deeply influenced by the number of binding events that occurred and, consequently, the mycotoxin concentration in the contaminated sample. Therefore, a gradual spectral redshift was observed as OTA concentration increased, as confirmed in . The LSPR peak shift displays a linear response to OTA concentrations established between 10 pM to 100 nM, as revealed in . The LOD value of this biosensor was calculated at 12.0 pM (Lee et al. Citation2018). The photo-heating of the Au NRs allows the release of OTA from the GQx molecular structure and the restoration of the LSPR absorption spectrum to its original state. The photo-thermal effect is induced through the absorption of the laser beam. After the sensor’s regeneration (with photo-heating), the detection repeatability achieves good results but is not accurate. Furthermore, the sensor’s temperature can increase, causing the denaturation or destruction of the aim target and, consequently, damage to the sensing system. The selectivity of the biosensor was tested through the exposure of the other two mycotoxins, and the optical response was consistent with the expected. The feasibility of the biosensor was tested in spiked grape juice at different concentrations, and the optical response delivery a good agreement with the standard OTA solutions. The recovery values were established between 85.5 and 116.9%. The present invention is based on the portability of the biosensor with a possible quantitative analysis by the simple procedure of immersing the sensor unit in the contaminated liquid sample with good detection performance.
Figure 30. Schematic representation of the reusable optical fiber LSPR-aptasensor for OTA detection in (a) and the detection assay in (b). The amplified view of the aptamer modified Au NRs chemically attached to the optical fiber core in (c). UV-vis absorption spectra at different concentrations of OTA in (d). The linear relationship between the relative LSPR peak shift (Δλ) and OTA concentration is plotted in (e). Reprinted with permission from Lee et al. (Citation2018). Copyright 2018 Elsevier.
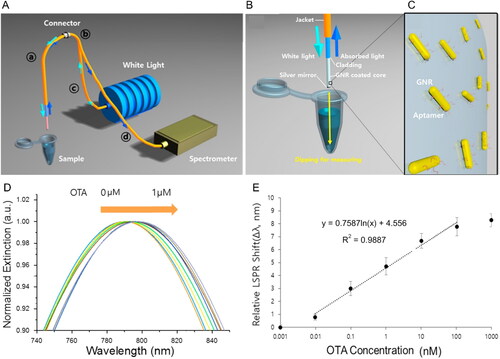
A dual-mode separation immunosensor for a multi-signal sensitive detection was patented (CN201910183819A) on September 21, 2021, by the South China Agricultural University (Yingju et al. Citation2021). This patent was based on scientific work available at ACS Applied Materials and Interfaces Journal in 2019 (Wei et al. Citation2019). Photoelectrochemical detection method combined with a colorimetric approach was applied in this biosensor, and its schematic representation is exhibited in . This biosensor was developed for OTA, OTB and OTC detection. However, the focus is OTA detection. In a 96-well plate, OTA antigen and a blocking molecule (i.e., dopamine) are previously immobilized. A mixture of different concentrations of OTA and a fixed concentration of OTA Ab (Ab1) is added. At this stage, the immobilized OTA antigen, and the free OTA, available in the solution, compete to chemically bind to the OTA Ab (Ab1). The second moment of the biosensing test consists on the addiction of a nanocomplex composed by HRP encapsulated in a liposome and linked to a second Ab (Ab2). The dissolution of the HRP-liposome-Ab2 complex by a surfactant (i.e., Triton X-100) provides a higher amount of secondary Ab and the release of HRP. The free HRP potentiates the oxidation reaction between the H2O2 and the CdS component of the nanocomplex composed by CdS/ZnO NRs on reduced GO (r -GO). The hydroxyl radicals generated by catalytic oxidation can provide alterations in the size and morphology of Au nanocones (Au NCs). The standard Au NCs exhibits a double cone morphology (), becoming more smoothed along with the experiment ( – to ) until accomplishing a spheroidal structure (). The change of the Au NCs’ morphology and size lead to the blueshift of LSPR peak position and, consequently, color variations, from brown to pink, in the test solution, as shown in . The multicolor change and the blueshift of the LSPR peak position correspond to a decrease in OTA content. The colorimetric approach has a total duration of 10 minutes and exhibits a dynamic range established between 1 ng L−1 and 5 µ L−1 with a LOD value was 1.46 ng L−1, as demonstrated in . Regarding the photoelectrochemical detection, the OTA content influences the amount of HRP-Liposome-Ab2 complex immobilized. At higher OTA concentrations, a smaller amount of the HRP-Liposome-Ab2 complex is immobilized, and the HRP release is also lower for the catalytic oxidation resulting in higher photoelectricity. This detection method also shows a good linear relationship between 1 ng L−1 and 5 µ L−1, and the LOD value was 0.79 ng L−1.
Figure 31. Schematic representation of the dual modality immunosensor for OTA detection in (a). TEM images of the morphology and sizy evolution of the Au NCs during the detection assay in (b), and their corresponding UV-vis absorption spectra in (c). UV-vis absorption spectra at different OTA concentrations in (d), and the linear relationship between the blueshift of the longitudinal LSPR peak (Δλ) and OTA concentration. Reprinted with permission from Wei et al. (Citation2019). Copyright 2019 Elsevier.
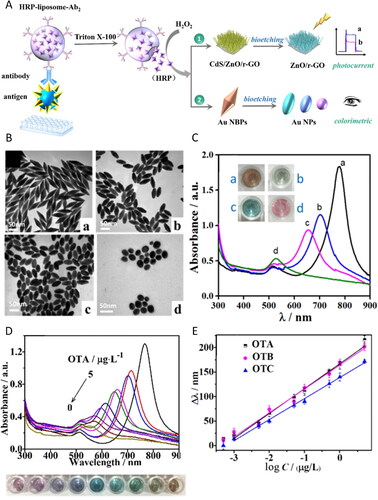
Major challenges and new trends of Ochratoxin-A optical sensors
The food industry focuses on preventing fungus development and mycotoxin presence in agricultural fields. However, the application of sensing detection approaches to verify and confirm food products’ safety is mandatory. Typically, the chemical detection of possible contaminants occurs at the final stages of food production. The delayed OTA detection in the food product can cause high economic losses (e.g., decontamination costs and food waste). Therefore, the performance of biochemical analysis in real-time or in several food production steps can be highly advantageous. The use of new biosensing devices arises from the strategic combination of advanced nanofabrication methods and novel nanomaterials, allowing to overcome the current challenges. The development of an OTA biosensor, with faster detection speed combined with an extended range of biosensing performance, enables an early OTA identification in contaminated food. Consecutively, the primary application of decontamination approaches, according to the food safety entities’ specifications, prevents food waste and ensures food safety.
One of the most critical aspects of OTA detection is the assumption that the mycotoxin present in the specific foodkind maintains its chemical structure. However, from fungus production to food processing, OTA is exposed to several factors (i.e., biological and environmental agents). These possible interactions can develop a "modified mycotoxin" with a new chemical structure naturally developed to restore biochemical stability between the OTA and the surrounding environment (Righetti et al. Citation2016; Freire and Sant’Ana Citation2018). This modified OTA might provide broad exposure and potential toxicity, without being detected in a reasonable time with the existing routine analytic techniques. Consequently, the early detection of this modified OTA through the combination of several biorecognition approaches on a suitable biosensor is essential to ensure food safety.
Optical sensing technology emerges as a powerful resource for biosensing applications, allowing the detection and distinguishing of the target analyte in a variety of contaminated samples. The sensing performance of an optical biosensing detection strategy is variable accordingly to the immobilized biorecognition element or detection mode (i.e., optical-based phenomenon) and defined by several analytical sensing parameters: sensitivity, reproducibility, specificity, precision, and accuracy. Therefore, these analytical sensing parameters for OTA optical detection depend on the specific biorecognition layer (i.e., aptamer or Ab). For example, Ab denaturation, cross-reaction interaction, loss of bioactivity, and poor chemical stability are possible limitations in the feasibility of the biosensor. In addition, accuracy is also a vulnerable point in the development of a biosensor, whereby the adsorption of biomolecules of the test sample in the biosensor surface may interfere with the detection process (Morales and Halpern Citation2018). Therefore, a drawback is the sample pretreatment, which is required to remove undesirable components of food samples through an application of effective cleaning (and concentrating) techniques (Turner, Subrahmanyam, and Piletsky Citation2009; Xu et al. Citation2016).
The biodetection market exhibits undeniable economic impacts on nanotechnology development and, thus, enables biosensing improvement toward the biosensor’s potential commercialization. The development of novel optical-based biosensors reveals several economic drawbacks: high investment (i.e., stable and continuous financial investment) and slow economic return (Cong and Zhang Citation2022). The development of patented commercialized biosensing is laborious and cumbersome, including minor and gradual time-consuming phases. The prolonged process for both regulatory approval and patent licensing, and the delayed transition from laboratory prototyping to industrial scale-up production (i.e., scalability constraints and cost-effectiveness factor) are explicit time-consuming disadvantages, that lead to unattractive financial investment misconceptions (Cong and Zhang Citation2022). The inclusion of novel nanomaterials, an efficient nanocomposites’ modification, and the immobilization strategy creates a new broad range of possibilities in the detection sensing biosystem, with optimal analytical performance in small devices and high-level cost-effectiveness. However, nanomaterials may not be suitable for real world applications and mass manufacturing, since they require complex and challenging production conditions, very often difficult to up-scale. Consequently, it is essential to develop an optimized fabrication process of nanomaterials that can guarantee their reproducibility and stability through inexpensive, easy to prepare, and based on environmentally friendly production techniques (Rhouati et al. Citation2017; Zhang et al. Citation2021a). Moreover, most studies of new biosensing approaches are manufactured by prototyping techniques, and do not refer to the importance of large-scale sample testing, limiting, from one point of view, the development of biosensors and their commercialization. Therefore, it is essential to develop a cost-effective method with standardized bioanalytical protocols for the synthesis and treatment of the sensing platform, including a reliable immobilization efficiency and a long shelf-life (Mahmoudpour et al. Citation2019; Xiong et al. Citation2022).
Currently, these major challenges are being addressed by academic and industry communities, which led to new trends in optical biosensors that aim to enhance biosensors’ analytical performance. Microfluidic devices, which allow analytical assays miniaturization, have emerged as an essential tool for biosensors, due to their numerous advantages: i) precise control of flow, ii) reagents volume, iii) reaction kinetics, iv) high surface area-to-volume and v) compatibility with standard analytical technologies (Barbosa and Reis Citation2017; Barbosa, Castanheira, and Reis Citation2018). The miniaturization combined with microfluidics integration potentializes the sensing performance and speed of analyte detection (Barbosa, Edwards, and Reis Citation2021), promoting the development of multiplexing technologies, that can simultaneously detect several analytes of interest (Castanheira et al. Citation2015).
The sensing improvement, through nanofabrication, and the development of point-of-care platforms, are fundamental for several detection applications (i.e., identification and quantification), especially in food safety and quality. Beyond, other strategies have been applied to enhance the analytical performance of optical biosensors, e.g., fluid mixing and analyte concentrating (i.e., evaporating, thermo- and electrophoresis, and microbubble-based solute accumulation), as physical approaches to increase analyte–biosensor interaction during the incubation (detection step) (Kim, Gonzales, and Zheng Citation2021). However, one of the most common enhancing sensing approaches relies on label-based optical detection, using the specific properties of labels (i.e., enzymes, fluorophores, colloidal Au, or Ag-enhanced particles) for chemical signal amplification (i.e., polymerization and nanocatalysts signal-amplification strategies) (Sang et al. Citation2016; Kim, Gonzales, and Zheng Citation2021). In contrast, a label-free optical detection strategy translates the biological recognition event into a measurable optical signal without using molecular auxiliary structures, facilitating the entire detection process (Sang et al. Citation2016). This optical detection strategy relies on physical signal amplification provided by transducer substrate modification (e.g., including plasmonic metal NPs) (L. Guo et al. Citation2015; Kim, Gonzales, and Zheng Citation2021). In particular, LSPR optical-based biosensors reveal remarkable advantages such as label-free monitoring with real-time analysis that delivers a high sensing performance with the potential to be combined on a cost-effective portable lab-on-chip simple to handle (Akgönüllü and Denizli Citation2022). As disclosed in the review, LSPR-based biosensors have been revealed as an outstanding label-free sensing strategy, particularly for OTA detection. In the biosensing scope, the combination of several enhancing sensitivity approaches concerning sampling, target recognition, and signal transduction can overcome the current limitations and improved biosensor’s performance (Kim, Gonzales, and Zheng Citation2021).
Conclusion
In the food industry, the safety of food products is crucial for preventing foodborne illness and injury. OTA is a possible carcinogenic mycotoxin that suddenly and inevitably occurs in several feed types and foodstuff, leading to harmful health effects and significant economic losses in the agriculture sector. The ingestion of OTA causes progressive tissue damage in some organs of the human body (e.g., liver and kidneys), inducing potentially fatal diseases (i.e., BEN, CIN, and Alzheimer’s). Therefore, several regulatory food safety institutions established the limit of concentration of this mycotoxin on any potentially contaminated foods. Conventional detection techniques (e.g., HPLC-FD and LFIA) are commonly applied; however, they do not meet current needs (e.g., direct, real-time, and quantitative analysis). Considering the worldwide concern in OTA detection, advances in nanotechnology provided suitable alternatives to conventional analytical techniques. Scientific efforts led to the development of portable label-free optical biosensors with real-time monitoring, with outstanding biosensing performances (i.e., LOD below the defined threshold), beyond small-scale devices with high cost-effectiveness. In this review, several reported biosensors overcome the LOD of standard techniques (e.g., HPLC-FD and LFIA), confirming the potential of novel optical phenomena nanotechnologies for a reliable and efficient detection. Despite the most common optical sensing approaches being fluorescence and colorimetric methods, the LSPR-based biosensing approach was revealed to be the most promising nanotechnology for OTA monitorization application, regarding its biosensing parameters. This optical biosensing approach was demonstrated to be the most sensitive, associated with lower detection limits and a significantly broad dynamic range capable of detecting OTA at considerable limits of concentration. Finally, several patents for commercial methods have been reported, validating the LSPR-based biosensing potential as a simplified low-cost selective nanodevice capable of a real-time monitoring of this mycotoxin in diverse types of foodstuffs.
Disclosure statement
No potential conflict of interest was reported by the author(s).
Additional information
Funding
References
- Agriopoulou, S., E. Stamatelopoulou, and T. Varzakas. 2020a. Advances in occurrence, importance, and mycotoxin control strategies: prevention and detoxification in foods. Foods 9 (2):137. doi: 10.3390/foods9020137.
- Agriopoulou, S., E. Stamatelopoulou, and T. Varzakas. 2020b. Advances in analysis and detection of major mycotoxins in foods. Foods 9 (4):518. doi: 10.3390/foods9040518.
- Akgönüllü, S., C. Armutcu, and A. Denizli. 2021. Molecularly imprinted polymer film based plasmonic sensors for detection of Ochratoxin A in dried fig. Polymer Bulletin 79:4049–67. doi: 10.1007/s00289-021-03699-6.
- Akgönüllü, S., and A. Denizli. 2022. Recent advances in optical biosensing approaches for biomarkers detection. Biosensors and Bioelectronics: X 12 (December):100269. doi: 10.1016/j.biosx.2022.100269.
- Alahi, M., E. Eshrat, and S. C. Mukhopadhyay. 2017. Detection methodologies for pathogen and toxins: a review. Sensors (Switzerland) 17 (8):1885. doi: 10.3390/s17081885.
- Alberti, G., C. Zanoni, L. R. Magnaghi, and R. Biesuz. 2020. Disposable and low-cost colorimetric sensors for environmental analysis. International Journal of Environmental Research and Public Health 17 (22):8331. doi: 10.3390/ijerph17228331.
- Alizadeh, N., J. Hashemi, and F. Shahdost-Fard. 2021. Spectrofluorimetric study of the complexation of Ochratoxin A and Cu2+: towards the hybrid fluorimetric sensor and visual detection of Ochratoxin A in wheat flour samples from farm to fork. Food Chemistry 350 (July):129204. doi: 10.1016/j.foodchem.2021.129204.
- Altafini, A., G. Fedrizzi, and P. Roncada. 2019. Occurrence of Ochratoxin A in typical salami produced in different regions of Italy. Mycotoxin Research 35 (2):141–8. doi: 10.1007/s12550-018-0338-x.
- Andrade, M. A., and F. M. Lanças. 2017. Determination of Ochratoxin A in wine by packed in-tube solid phase microextraction followed by high performance liquid chromatography coupled to tandem mass spectrometry. Journal of Chromatography. A 1493:41–8. doi: 10.1016/j.chroma.2017.02.053.
- Andryukov, B. G. 2020. Six decades of lateral flow immunoassay: from determining metabolic markers to diagnosing Covid-19. AIMS Microbiology 6 (3):280–304. doi: 10.3934/microbiol.2020018.
- Anfossi, L., C. Giovannoli, G. Giraudi, F. Biagioli, C. Passini, and C. Baggiani. 2012. A lateral flow immunoassay for the rapid detection of Ochratoxin A in wine and grape must. Journal of Agricultural and Food Chemistry 60 (46):11491–7. doi: 10.1021/jf3031666.
- Artigues, M., J. Abellà, and S. Colominas. 2017. Analytical parameters of an amperometric glucose biosensor for fast analysis in food samples. Sensors 17 (11):2620. doi: 10.3390/s17112620.
- Barbosa, A. I., A. P. Castanheira, and N. M. Reis. 2018. Sensitive optical detection of clinically relevant biomarkers in affordable microfluidic devices: overcoming substrate diffusion limitations. Sensors and Actuators, B: Chemical 258 (April):313–20. doi: 10.1016/j.snb.2017.11.086.
- Barbosa, A. I., A. D. Edwards, and N. M. Reis. 2021. Antibody surface coverage drives matrix interference in microfluidic capillary immunoassays. ACS Sensors 6 (7):2682–90. doi: 10.1021/acssensors.1c00704.
- Barbosa, A. I., and N. M. Reis. 2017. A critical insight into the development pipeline of microfluidic immunoassay devices for the sensitive quantitation of protein biomarkers at the point of care. The Analyst 142 (6):858–82. doi: 10.1039/c6an02445a.
- Battilani, P., R. Palumbo, P. Giorni, C. Dall’Asta, L. Dellafiora, A. Gkrillas, P. Toscano, A. Crisci, C. Brera, B. De Santis, et al. 2020. Mycotoxin mixtures in food and feed: holistic, innovative, flexible risk assessment modelling approach. EFSA Supporting Publications 17 (1):1757E. doi: 10.2903/sp.efsa.2020.EN-1757.
- Becheva, Z. R., M. K. Atanasova, Y. Lukanov Ivanov, and T. I. Godjevargova. 2020. Magnetic nanoparticle-based fluorescence immunoassay for determination of Ochratoxin A in milk. Food Analytical Methods 13 (12):2238–48. doi: 10.1007/s12161-020-01848-7.
- Belmadani, A., G. Tramu, A. M. Betbeder, P. S. Steyn, and E. E. Creppy. 1998. Regional selectivity to Ochratoxin A, distribution and cytotoxicity in rat brain. Archives of Toxicology 72 (10):656–62. doi: 10.1007/s002040050557.
- Ben Taheur, F., B. Kouidhi, Y. M. A. Al Qurashi, J. Ben Salah-Abbès, and K. Chaieb. 2019. Review: biotechnology of mycotoxins detoxification using microorganisms and enzymes. Toxicon : Official Journal of the International Society on Toxinology 160 (March):12–22. doi: 10.1016/j.toxicon.2019.02.001.
- Bennett, J. W. 1987. Mycotoxins, mycotoxicoses, mycotoxicology and mycopathologia. Mycopathologia 100 (1):3–5. doi: 10.1007/BF00769561.
- Bennett, J. W., and M. Klich. 2003. Mycotoxins. Clinical Microbiology Reviews 16 (3):497–516. doi: 10.1128/CMR.16.3.497-516.2003.
- Bhattacharya, K., L. Bernasconi, and D. Picard. 2018. Luminescence resonance energy transfer between genetically encoded donor and acceptor for protein-protein interaction studies in the molecular chaperone HSP70/HSP90 complexes. Scientific Reports 8 (1):2801. doi: 10.1038/s41598-018-21210-6.
- Bi, X., L. Luo, L. Li, X. Liu, B. Chen, and T. You. 2020. A FRET-based aptasensor for Ochratoxin A detection using graphitic carbon nitride quantum dots and CoOOH nanosheets as donor-acceptor pair. Talanta 218 (October):121159. doi: 10.1016/j.talanta.2020.121159.
- Błajet-Kosicka, A., M. Twarużek, R. Kosicki, E. Sibiorowska, and J. Grajewski. 2014. Co-occurrence and evaluation of mycotoxins in organic and conventional rye grain and products. Food Control. 38 (1):61–6. doi: 10.1016/j.foodcont.2013.10.003.
- Blesa, J., J. M. Soriano, J. C. Moltó, and J. Mañes. 2006. Factors affecting the presence of Ochratoxin A in wines. Critical Reviews in Food Science and Nutrition 46 (6):473–8. doi: 10.1080/10408390500215803.
- Bueno, D., R. Muñoz, and J. Marty. 2014. Common methods to detect mycotoxins: a review with particular emphasis on electrochemical detection. Sensing in Electroanalysis 8:85–114.
- Bui-Klimke, T. R., and F. Wu. 2015. Ochratoxin A and human health risk: a review of the evidence. Critical Reviews in Food Science and Nutrition 55 (13):1860–9. doi: 10.1080/10408398.2012.724480.
- Bunney, J., S. Williamson, D. Atkin, M. Jeanneret, D. Cozzolino, J. Chapman, A. Power, and S. Chandra. 2017. The use of electrochemical biosensors in food analysis. Current Research in Nutrition and Food Science Journal 5 (3):183–95. doi: 10.12944/CRNFSJ.5.3.02.
- Byrne, B., E. Stack, N. Gilmartin, and R. O’Kennedy. 2009. Antibody-based sensors: principles, problems and potential for detection of pathogens and associated toxins. Sensors (Basel, Switzerland) 9 (6):4407–45. doi: 10.3390/s90604407.
- Castanheira, A. P., A. I. Barbosa, A. D. Edwards, and N. M. Reis. 2015. Multiplexed femtomolar quantitation of human cytokines in a fluoropolymer microcapillary film. The Analyst 140 (16):5609–18. doi: 10.1039/c5an00238a.
- Chen, R., Y. Sun, B. Huo, X. Zhao, H. Huang, S. Li, J. Bai, J. Liang, and Z. Gao. 2021. A copper monosulfide-nanoparticle-based fluorescent probe for the sensitive and specific detection of Ochratoxin A. Talanta 222 (January):121678. doi: 10.1016/j.talanta.2020.121678.
- Cheng, Y., L. Liu, H. Liu, L. Xu, and H. Kuang. 2020. Rapid and sensitive detection of Ochratoxin A in rice flour using a fluorescent microsphere immunochromatographic test strip assay. Food and Agricultural Immunology 31 (1):563–74. doi: 10.1080/09540105.2020.1745157.
- Cong, H., and N. Zhang. 2022. Perspectives in translating microfluidic devices from laboratory prototyping into scale-up production. Biomicrofluidics 16 (2):021301. doi: 10.1063/5.0079045.
- Dachery, B., F. Fonseca Veras, L. Dal Magro, V. Manfroi, and J. E. Welke. 2017. Exposure risk assessment to Ochratoxin A through consumption of juice and wine considering the effect of steam extraction time and vinification stages. Food and Chemical Toxicology : An International Journal Published for the British Industrial Biological Research Association 109 (Pt 1):237–44. doi: 10.1016/j.fct.2017.09.013.
- Ding, Y., H. Shang, X. Wang, and L. Chen. 2020. A SERS-based competitive immunoassay for highly sensitive and specific detection of Ochratoxin A. The Analyst 145 (18):6079–84. doi: 10.1039/d0an01220c.
- Duarte, S. C., A. Pena, and C. M. Lino. 2009. Ochratoxin A non-conventional exposure sources—A review. Microchemical Journal 93 (2): 115–20. doi: 10.1016/j.microc.2009.06.002.
- El Khoury, A., and A. Atoui. 2010. Ochratoxin A: general overview and actual molecular status. Toxins 2 (4):461–93. doi: 10.3390/toxins2040461.
- Eskola, M., G. Kos, C. T. Elliott, J. Hajšlová, S. Mayar, and R. Krska. 2020. Worldwide contamination of food-crops with mycotoxins: validity of the widely cited ‘FAO estimate’ of 25%. Critical Reviews in Food Science and Nutrition 60 (16):2773–89. doi: 10.1080/10408398.2019.1658570.
- European Food Safety Authority (EFSA). 2006. Opinion of the scientific panel on contaminants in the food chain [CONTAM] related to Ochratoxin A in food. EFSA Journal 4 (6):365. doi: 10.2903/j.efsa.2006.365.
- Fadlalla, M., S. Hassan, R. Ling, X. Wang, J. Li, S. Yuan, K. Xiao, S. Wang, H. Tang, S. Elsir, et al. 2020. Development of ELISA and lateral flow immunoassays for Ochratoxins (OTA and OTB) detection based on monoclonal antibody. Frontiers in Cellular and Infection Microbiology 10:80. doi: 10.3389/fcimb.2020.00080.
- Fink-Gremmels, J. 1999. Mycotoxins: their implications for human and animal health. The Veterinary Quarterly 21 (4):115–20. doi: 10.1080/01652176.1999.9695005.
- Freire, L., P. A. C. Braga, M. M. Furtado, J. Delafiori, F. L. Dias-Audibert, G. E. Pereira, F. G. Reyes, R. R. Catharino, A. S. Sant’Ana, et al. 2020. From grape to wine: fate of Ochratoxin A during red, rose, and white winemaking process and the presence of Ochratoxin derivatives in the final products. Food Control. 113 (July):107167. doi: 10.1016/j.foodcont.2020.107167.
- Freire, L., and A. S. Sant’Ana. 2018. Modified mycotoxins: an updated review on their formation, detection, occurrence, and toxic effects. Food and Chemical Toxicology : An International Journal Published for the British Industrial Biological Research Association 111 (January):189–205. doi: 10.1016/j.fct.2017.11.021.
- Fuchs, R., B. Radić, M. Peraica, K. Hult, and R. Pleština. 1988. Enterohepatic circulation of Ochratoxin A in rats. Periodicum Biologorum 90:39–42.
- Gordon, J., and G. Michel. 2008. Analytical sensitivity limits for lateral flow immunoassays. Clinical Chemistry 54 (7):1250–1. doi: 10.1373/clinchem.2007.102491.
- Gruber-Dorninger, C., T. Jenkins, and G. Schatzmayr. 2019. Global mycotoxin occurrence in feed: a ten-year survey. Toxins 11 (7):375. doi: 10.3390/toxins11070375.
- Guo, L., Joshua A. Jackman, H. H. Yang, P. Chen, N. J. Cho, and D. H. Kim. 2015. Strategies for enhancing the sensitivity of plasmonic nanosensors. Nano Today 10 (2):213–39. doi: 10.1016/j.nantod.2015.02.007.
- Guo, Z., J. Tian, C. Cui, Y. Wang, H. Yang, M. Yuan, and H. Yu. 2021. A label-free aptasensor for turn-on fluorescent detection of Ochratoxin A based on SYBR gold and single walled carbon nanohorns. Food Control 123 (May):107741. doi: 10.1016/j.foodcont.2020.107741.
- Ha, T. H. 2015. Recent advances for the detection of Ochratoxin A. Toxins 7 (12):5276–300. doi: 10.3390/toxins7124882.
- Hao, L., J. Chen, X. Chen, T. Ma, X. Cai, H. Duan, Y. Leng, X. Huang, and Y. Xiong. 2021. A novel magneto-gold nanohybrid-enhanced lateral flow immunoassay for ultrasensitive and rapid detection of Ochratoxin A in grape juice. Food Chemistry 336 (January):127710. doi: 10.1016/j.foodchem.2020.127710.
- Hao, N., Z. Dai, X. Meng, R. Hua, J. Lu, and K. Wang. 2020. A portable solar-driven ratiometric photo-electrochromic visualization biosensor for detection of Ochratoxin A. Sensors and Actuators B: Chemical 306 (March):127594. doi: 10.1016/j.snb.2019.127594.
- Haschek, W. M., and K. A. Voss. 2013. Mycotoxins. In Haschek and Rousseaux’s handbook of toxicologic pathology, 3rd ed., 1187–258. Academic Press. Elsevier. doi: 10.1016/B978-0-12-415759-0.00039-X.
- Hitabatuma, A., Y. H. Pang, L. H. Yu, and X. F. Shen. 2021. A competitive fluorescence assay based on free-complementary DNA for Ochratoxin A detection. Food Chemistry 342 (April):128303. doi: 10.1016/j.foodchem.2020.128303.
- Holzinger, M., A. L. Goff, and S. Cosnier. 2014. Nanomaterials for biosensing applications: a review. Frontiers in Chemistry 2:63. doi: 10.3389/fchem.2014.00063.
- Hosnedlova, B., J. Sochor, M. Baron, G. Bjørklund, and R. Kizek. 2020. Application of nanotechnology based-biosensors in analysis of wine compounds and control of wine quality and safety: a critical review. Critical Reviews in Food Science and Nutrition 60 (19):3271–89. doi: 10.1080/10408398.2019.1682965.
- Huang, D., J. Chen, L. Ding, L. Guo, P. Kannan, F. Luo, B. Qiu, and Z. Lin. 2020a. Core-satellite assemblies and exonuclease assisted double amplification strategy for ultrasensitive SERS detection of biotoxin. Analytica Chimica Acta 1110 (May):56–63. doi: 10.1016/j.aca.2020.02.058.
- Huang, L., S. Tian, W. Zhao, K. Liu, X. Ma, and J. Guo. 2020b. Multiplexed detection of biomarkers in lateral-flow immunoassays. The Analyst 145 (8):2828–40. doi: 10.1039/c9an02485a.
- Huang, X. B., S. H. Wu, H. C. Hu, and J. J. Sun. 2020c. AuNanostar@4-MBA@Au core-shell nanostructure coupled with exonuclease III-assisted cycling amplification for ultrasensitive SERS detection of Ochratoxin A. ACS Sensors 5 (8):2636–43. doi: 10.1021/acssensors.0c01162.
- Hussein, S, and J. M. Brasel. 2001. Toxicity, metabolism, and impact of mycotoxins on humans and animals. Toxicology 167 (2):101–34. doi: 10.1016/S0300-483X(01)00471-1.
- IARC. 1993. Some naturally occurring substances: food items and constituents, heterocyclic aromatic amines and mycotoxins. IARC Monographs on the Evaluation of Carcinogenic Risk of Chemicals to Humans No. 56 http://monographs.iarc.fr/ENG/Monographs/vol56/mono56.pdf.
- International Organization of Vine and Wine (OIV). 2021. State of the world vitinicultural sector in 2020. Paris, France: International Organization of Vine and Wine (OIV).
- Iqbal, S., Zafar, Z. Mehmood, M. R. Asi, M. Shahid, M. Sehar, and N. Malik. 2018. Co-occurrence of aflatoxins and Ochratoxin A in nuts, dry fruits, and nuty products. Journal of Food Safety 38 (4):e12462. doi: 10.1111/jfs.12462.
- Janik, E., M. Niemcewicz, M. Podogrocki, M. Ceremuga, L. Gorniak, S. Maksymilian, and M. Bijak. 2021. The existing methods and novel approaches in mycotoxins’ detection. Molecules 26 (13):3981. doi: 10.3390/molecules26133981.
- Jiang, Y. Y., X. Zhao, L. J. Chen, C. Yang, X. B. Yin, and X. P. Yan. 2020. Persistent luminescence nanorod based luminescence resonance energy transfer aptasensor for autofluorescence-free detection of mycotoxin. Talanta 218 (October):121101. doi: 10.1016/j.talanta.2020.121101.
- Jing, X., L. Chang, L. Shi, X. Liu, Y. Zhao, and W. Zhang. 2020. Au Film-Au@Ag core-shell nanoparticle structured surface-enhanced raman spectroscopy aptasensor for accurate Ochratoxin A detection. ACS Applied Biomaterials 3 (4):2385–91. doi: 10.1021/acsabm.0c00120.
- Joint FAO/WHO Expert Committee on Food Additives. 2007. Evaluation of certain food additives and contaminants. World Health Organization Technical Report Series 940:1–92. http://www.ncbi.nlm.nih.gov/pubmed/17687927.
- Karami-Osboo, R. 2020. Nanofluid extraction of Ochratoxin A in food. Journal of Food Composition and Analysis 87 (January):103425. doi: 10.1016/j.jfca.2020.103425.
- Khaneghah, A. M., Y. Fakhri, L. Abdi, C. F. S. C. Coppa, L. T. Franco, and C. A. F. de Oliveira. 2019. The concentration and prevalence of Ochratoxin A in coffee and coffee-based products: a global systematic review, meta-analysis and meta-regression. Fungal Biology 123 (8):611–7. doi: 10.1016/j.funbio.2019.05.012.
- Kim, M. G., L. Bo Bin, P. Jin Ho, and J. Y. Byun. 2018a. A reusable optical fiber aptasensor based on photo-thermal effect. Korea.
- Kim, Y., J. Gonzales, and Y. Zheng. 2021. Sensitivity-enhancing strategies in optical biosensing. Small 17 (4):2004988. doi: 10.1002/smll.202004988.
- Kim, M.-G., P. Jin-Ho, and J. Y. Byun. 2018b. LSPR-based high sensitivity aptamer sensor using intercalation agent. Korea.
- Kochman, J., K. Jakubczyk, and K. Janda. 2021. Mycotoxins in red wine: occurrence and risk assessment. Food Control 129:108229. doi: 10.1016/j.foodcont.2021.108229.
- Kőszegi, T., and M. Poór. 2016. Ochratoxin A: molecular interactions, mechanisms of toxicity and prevention at the molecular level. Toxins 8 (4):111. doi: 10.3390/toxins8040111.
- Krishna, V. D., K. Wu, D. Su, Maxim, C. J. Cheeran, J. P. Wang, and A. Perez. 2018. Nanotechnology: review of concepts and potential application of sensing platforms in food safety. Food Microbiology 75 (October):47–54. doi: 10.1016/j.fm.2018.01.025.
- Krska, R., P. Schubert-Ullrich, A. Molinelli, M. Sulyok, S. MacDonald, and C. Crews. 2008. Mycotoxin analysis: an update. Food Additives & Contaminants. Part A, Chemistry, Analysis, Control, Exposure & Risk Assessment 25 (2):152–63. doi: 10.1080/02652030701765723.
- Kumar, P., D. K. Mahato, M. Kamle, Tapan, K. Mohanta, and S. G. Kang. 2017. Aflatoxins: a global concern for food safety, human health and their management. Frontiers in Microbiology 7:2170. doi: 10.3389/fmicb.2016.02170.
- Kutsanedzie, F. Y., A. A. Agyekum, V. Annavaram, and Q. Chen. 2020. Signal-enhanced SERS-sensors of CAR-PLS and GA-PLS coupled AgNPs for Ochratoxin A and Aflatoxin B1 detection. Food Chemistry 315 (June):126231. doi: 10.1016/j.foodchem.2020.126231.
- Langer, J., D. Jimenez de Aberasturi, J. Aizpurua, R. A. Alvarez-Puebla, B. Auguié, J. J. Baumberg, G. C. Bazan, S. E. J. Bell, A. Boisen, A. G. Brolo, et al. 2020. Present and future of surface-enhanced raman scattering. ACS Nano 14 (1):28–117. doi: 10.1021/acsnano.9b04224.
- Lee, B., J.-H. Park, J.-Y. Byun, J. H. Kim, and M.-G. Kim. 2018. An optical fiber-based LSPR aptasensor for simple and rapid in-situ detection of Ochratoxin A. Biosensors & Bioelectronics 102 (April):504–9. doi: 10.1016/j.bios.2017.11.062.
- Li, G. 2018. Biosensing technologies for protein assay. Nano-inspired biosensors for protein assay with clinical applications, 313–30. Elsevier. doi: 10.1016/C2016-0-01779-5.
- Liu, L., Q. Huang, Z. Iqbal Tanveer, K. Jiang, J. Zhang, H. Pan, L. Luan, X. Liu, Z. Han, and Y. Wu. 2020. Turn off-on’ fluorescent sensor based on quantum dots and self-assembled porphyrin for rapid detection of Ochratoxin A. Sensors and Actuators B: Chemical 302 (January):127212. doi: 10.1016/j.snb.2019.127212.
- Li, R., Y. Wen, F. Wang, and P. He. 2021. Recent advances in immunoassays and biosensors for mycotoxins detection in feedstuffs and foods. Journal of Animal Science and Biotechnology 12 (1):108. doi: 10.1186/s40104-021-00629-4.
- López-Puertollano, D., C. Agulló, J. V. Mercader, A. Abad-Somovilla, and A. Abad-Fuentes. 2021. Immunoanalytical methods for Ochratoxin A monitoring in wine and must based on innovative immunoreagents. Food Chemistry 345 (May):128828. doi: 10.1016/j.foodchem.2020.128828.
- Lu, L., W. Yuan, Q. Xiong, M. Wang, Y. Liu, M. Cao, and X. Xiong. 2021. One-step grain pretreatment for Ochratoxin A detection based on bipolar electrode-electrochemiluminescence biosensor. Analytica Chimica Acta 1141 (January):83–90. doi: 10.1016/j.aca.2020.10.035.
- Mahmoudpour, M., J. Ezzati Nazhad Dolatabadi, M. Torbati, A. Pirpour Tazehkand, A. Homayouni-Rad, and M. de la Guardia. 2019. Nanomaterials and new biorecognition molecules based surface plasmon resonance biosensors for mycotoxin detection. Biosensors & Bioelectronics 143 (October):111603. doi: 10.1016/j.bios.2019.111603.
- MarketDataForecast. 2021. Mycotoxin testing market analysis—segmented by type (Aflatoxins, Ochratoxin A, Patulin, Fusarium Toxins), by technology (HPLC-Based, LC-MS/MS-based, immunoassay-based), by food and feed, tested & region—Global Forecast to 2027. https://www.marketdataforecast.com/market-reports/mycotoxin-testing-market.
- Martínez-Periñán, E., C. Gutiérrez-Sánchez, T. García-Mendiola, and E. Lorenzo. 2020. Electrochemiluminescence biosensors using screen-printed electrodes. Biosensors 10 (9):118. doi: 10.3390/bios10090118.
- Mateo, R., Á. Medina, E. M. Mateo, F. Mateo, and M. Jiménez. 2007. An overview of Ochratoxin A in beer and wine. International Journal of Food Microbiology 119 (1–2):79–83. doi: 10.1016/j.ijfoodmicro.2007.07.029.
- Mauriz, E. 2020. Clinical applications of visual plasmonic colorimetric sensing. Sensors 20 (21):6214–31. doi: 10.3390/s20216214.
- Mehri, F., M. Esfahani, A. Heshmati, E. Jenabi, and S. Khazaei. 2020. The prevalence of Ochratoxin A in dried grapes and grape-derived products: a systematic review and meta-analysis. Toxin Reviews 41 (1):347–56. doi: 10.1080/15569543.2020.1845739.
- Mishra, G., A. Barfidokht, F. Tehrani, and R. Mishra. 2018. Food safety analysis using electrochemical biosensors. Foods 7 (9):141. doi: 10.3390/foods7090141.
- Mitchell, N. J., E. Bowers, C. Hurburgh, and F. Wu. 2016. Potential economic losses to the US corn industry from aflatoxin contamination. Food Additives & Contaminants. Part A, Chemistry, Analysis, Control, Exposure & Risk Assessment 33 (3):540–50. doi: 10.1080/19440049.2016.1138545.
- Morales, M. A., and J. M. Halpern. 2018. Guide to selecting a biorecognition element for biosensors. Bioconjugate Chemistry 29 (10):3231–9. doi: 10.1021/acs.bioconjchem.8b00592.
- Mousavi Khaneghah, A., Y. Fakhri, S. Raeisi, B. Armoon, and A. S. Sant’Ana. 2018. Prevalence and concentration of Ochratoxin A, zearalenone, deoxynivalenol and total aflatoxin in cereal-based products: a systematic review and meta-analysis. Food and Chemical Toxicology : An International Journal Published for the British Industrial Biological Research Association 118 (August):830–48. doi: 10.1016/j.fct.2018.06.037.
- Mukherjee, M., C. Nandhini, and P. Bhatt. 2021. Colorimetric and chemiluminescence based enzyme linked Apta-sorbent assay (ELASA) for Ochratoxin A detection. Spectrochimica Acta. Part A, Molecular and Biomolecular Spectroscopy 244 (January):118875. doi: 10.1016/j.saa.2020.118875.
- Naresh, V., and N. Lee. 2021. A review on biosensors and recent development of nanostructured materials-enabled biosensors. Sensors 21 (4):1109–35. doi: 10.3390/s21041109.
- Nayl, A. A., A. I. Abd-Elhamid, A. Y. El-Moghazy, M. Hussin, M. A. Abu-Saied, A. A. El-Shanshory, and H. M. Soliman. 2020. The nanomaterials and recent progress in biosensing systems: a review. Trends in Environmental Analytical Chemistry 26 (June):e00087. doi: 10.1016/j.teac.2020.e00087.
- Neethirajan, S., V. Ragavan, X. Weng, and R. Chand. 2018. Biosensors for sustainable food engineering: challenges and perspectives. Biosensors 8 (1):23. doi: 10.3390/bios8010023.
- Niaz, K., S. Z. A. Shah, F. Khan, and M. Bule. 2020. Ochratoxin A–induced genotoxic and epigenetic mechanisms lead to Alzheimer disease: its modulation with strategies. Environmental Science and Pollution Research International 27 (36):44673–700. doi: 10.1007/s11356-020-08991-y.
- Nolan, P., S. Auer, A. Spehar, C. T. Elliott, and K. Campbell. 2019. Current trends in rapid tests for mycotoxins. Food Additives & Contaminants. Part A, Chemistry, Analysis, Control, Exposure & Risk Assessment 36 (5):800–14. doi: 10.1080/19440049.2019.1595171.
- Official Journal of the European Union. 2005. Commission Regulation (EC) No 123/2005.
- Parra, A., M. Jesús, and S. S. Paradinas. 2014. Spectroscopic techniques basedon the use of gold nanoparticles. Comprehensive Analytical Chemistry 66:477–527. doi: 10.1016/B978-0-444-63285-2.00012-2.
- Peixoto de Almeida, M., E. Pereira, P. Baptista, I. Gomes, S. Figueiredo, L. Soares, and R. Franco. 2014. Gold nanoparticles as (bio)chemical sensors. Comprehensive Analytical Chemistry 66:529–67. doi: 10.1016/B978-0-444-63285-2.00013-4.
- Pereira, R. H. A., W. J. Keijok, A. R. Prado, J. Pinto de Oliveira, and M. C. C. Guimarães. 2021. Rapid and sensitive detection of Ochratoxin A using antibody-conjugated gold nanoparticles based on localized surface plasmon resonance. Toxicon: Official Journal of the International Society on Toxinology 199 (August):139–44. doi: 10.1016/j.toxicon.2021.06.012.
- Pfohl-Leszkowicz, A. 2009. Ochratoxin A and aristolochic acid involvement in nephropathies and associated urothelial tract tumours. Arhiv za Higijenu Rada i Toksikologiju 60 (4):465–83. doi: 10.2478/10004-1254-60-2009-2000.
- Pires, P. N., E. A. Vargas, M. B. Gomes, C. B. M. Vieira, E. A. D. Santos, A. A. C. Bicalho, S. d C. Silva, R. P. Rezende, I. S. D. Oliveira, E. D. M. N. Luz, et al. 2019. Aflatoxins and Ochratoxin A: occurrence and contamination levels in cocoa beans from Brazil. Food Additives & Contaminants. Part A, Chemistry, Analysis, Control, Exposure & Risk Assessment 36 (5):815–24. doi: 10.1080/19440049.2019.1600749.
- Pitt, J. I., and J. D. Miller. 2017. A concise history of mycotoxin research. Journal of Agricultural and Food Chemistry 65 (33):7021–33. doi: 10.1021/acs.jafc.6b04494.
- Pohland, A. E., S. Nesheim, and L. Friedman. 1992. Ochratoxin A: a review (technical report). Pure and Applied Chemistry 64 (7):1029–46. doi: 10.1351/pac199264071029.
- Pohland, A. E., P. L. Schuller, P. S. Steyn, and H. P. Van Egmond. 1982. Physicochemical data for some selected mycotoxins. Pure and Applied Chemistry 54 (11):2219–84. doi: 10.1351/pac198254112219.
- Popescu, R., Gabriela, C. Bulgaru, A. Untea, M. Vlassa, M. Filip, A. Hermenean, D. Marin, I. Țăranu, Sergiu, E. Georgescu, A, et al. 2021. The effectiveness of dietary byproduct antioxidants on induced CYP genes expression and histological alteration in piglets liver and kidney fed with Aflatoxin B1 and Ochratoxin A. Toxins 13 (2):148. doi: 10.3390/toxins13020148.
- Posthuma-Trumpie, G. A., J. Korf, and A. van Amerongen. 2009. Lateral flow (immuno)assay: its strengths, weaknesses, opportunities and threats. a literature survey. Analytical and Bioanalytical Chemistry 393 (2):569–82. doi: 10.1007/s00216-008-2287-2.
- Prieto-Simón, B., M. Campàs, J. L. Marty, and T. Noguer. 2008. Novel highly-performing immunosensor-based strategy for Ochratoxin A detection in wine samples. Biosensors & Bioelectronics 23 (7):995–1002. doi: 10.1016/j.bios.2007.10.002.
- Qian, J., H. Cui, X. Lu, C. Wang, K. An, N. Hao, and K. Wang. 2020. Bi-Color FRET from two nano-donors to a single nano-acceptor: a universal aptasensing platform for simultaneous determination of dual targets. Chemical Engineering Journal 401 (December):126017. doi: 10.1016/j.cej.2020.126017.
- Ratola, N., E. Abade, T. Simões, A. Venâncio, and A. Alves. 2005. Evolution of Ochratoxin A content from must to wine in port wine microvinification. Analytical and Bioanalytical Chemistry 382 (2):405–11. doi: 10.1007/s00216-005-3176-6.
- Ravindran, N., S. Kumar, M. Yashini, S. Rajeshwari, C. A. Mamathi, S. N. Thirunavookarasu, and C. K. Sunil. 2021. Recent advances in surface plasmon resonance (SPR) biosensors for food analysis: a review. Critical Reviews in Food Science and Nutrition 1–23. doi: 10.1080/10408398.2021.1958745.
- Rhouati, A., G. Bulbul, U. Latif, A. Hayat, Z. H. Li, and J. L. Marty. 2017. Nano-aptasensing in mycotoxin analysis: recent updates and progress. Toxins 9 (11):349. doi: 10.3390/toxins9110349.
- Righetti, L., G. Paglia, G. Galaverna, and C. Dall’Asta. 2016. Recent advances and future challenges in modified mycotoxin analysis: why HRMS has become a key instrument in food contaminant research. Toxins 8 (12):361. doi: 10.3390/toxins8120361.
- Ringot, D., A. Chango, Y. J. Schneider, and Y. Larondelle. 2006. Toxicokinetics and toxicodynamics of Ochratoxin A, an update. Chemico-Biological Interactions 159 (1):18–46. doi: 10.1016/j.cbi.2005.10.106.
- Rodriguez, R. S., V. M. Szlag, T. M. Reineke, and C. L. Haynes. 2020. Multiplex surface-enhanced Raman scattering detection of deoxynivalenol and Ochratoxin A with a linear polymer affinity agent. Materials Advances 1 (9):3256–66. doi: 10.1039/d0ma00608d.
- Rotariu, L., F. Lagarde, N. Jaffrezic-Renault, and C. Bala. 2016. Electrochemical biosensors for fast detection of food contaminants—trends and perspective. TrAC Trends in Analytical Chemistry 79:80–7. doi: 10.1016/j.trac.2015.12.017.
- Rycenga, M., P. H. Camargo, W. Li, C. H. Moran, and Y. Xia. 2010. Understanding the SERS effects of single silver nanoparticles and their dimers, one at a time. The Journal of Physical Chemistry Letters 1 (4):696–703. doi: 10.1021/jz900286a.
- Sang, S., Y. Wang, Q. Feng, Y. Wei, J. Ji, and W. Zhang. 2016. Progress of new label-free techniques for biosensors: a review. Critical Reviews in Biotechnology 36 (3):465–81. doi: 10.3109/07388551.2014.991270.
- Santos, A., A. Vaz, P. Rodrigues, A. Veloso, A. Venâncio, and A. Peres. 2019. Thin films sensor devices for mycotoxins detection in foods: applications and challenges. Chemosensors 7 (1):3. doi: 10.3390/chemosensors7010003.
- Sawant, S. N. 2017. Development of biosensors from biopolymer composites. Biopolymer composites in electronics, 353–83. Elsevier. doi: 10.1016/B978-0-12-809261-3.00013-9.
- Schrenk, D., L. Bodin, J. K. Chipman, J. del Mazo, B. Grasl-Kraupp, C. Hogstrand, and L. Hoogenboom. 2020. Risk assessment of Ochratoxin A in food. EFSA Journal 18 (5):e06113. doi: 10.2903/j.efsa.2020.6113.
- Schwerdt, G., R. Freudinger, S. Silbernagl, and M. Gekle. 1999. Ochratoxin A-binding proteins in rat organs and plasma and in different cell lines of the kidney. Toxicology 135 (1):1–10. doi: 10.1016/S0300-483X(99)00028-1.
- Shan, H., X. Li, L. Liu, D. Song, and Z. Wang. 2020. Recent advances in nanocomposite-based electrochemical aptasensors for the detection of toxins. Journal of Materials Chemistry. B 8 (27):5808–25. doi: 10.1039/d0tb00705f.
- Soleas, G. J., J. Yan, and D. M. Goldberg. 2001. Assay of Ochratoxin A in wine and beer by high-pressure liquid chromatography photodiode array and gas chromatography mass selective detection. Journal of Agricultural and Food Chemistry 49 (6):2733–40. doi: 10.1021/jf0100651.
- Sorrenti, V., C. Di Giacomo, R. Acquaviva, I. Barbagallo, M. Bognanno, and F. Galvano. 2013. Toxicity of Ochratoxin A and its modulation by antioxidants: a review. Toxins 5 (10):1742–66. doi: 10.3390/toxins5101742.
- Streit, E., G. Schatzmayr, P. Tassis, E. Tzika, D. Marin, I. Taranu, C. Tabuc, A. Nicolau, I. Aprodu, O. Puel, et al. 2012. Current situation of mycotoxin contamination and co-occurrence in animal feed—focus on Europe. Toxins 4 (10):788–809. doi: 10.3390/toxins4100788.
- Studer-Rohr, I., J. Schlatter, and D. R. Dietrich. 2000. Kinetic parameters and intraindividual fluctuations of Ochratoxin A plasma levels in humans. Archives of Toxicology 74 (9):499–510. doi: 10.1007/s002040000157.
- Suea-Ngam, A., L. T. Deck, P. D. Howes, and A. J. deMello. 2020. An ultrasensitive non-noble metal colorimetric assay using starch-iodide complexation for Ochratoxin A detection. Analytica Chimica Acta 1135 (October):29–37. doi: 10.1016/j.aca.2020.08.028.
- Tang, Z., X. Liu, B. Su, Q. Chen, H. Cao, Y. Yun, Y. Xu, and B. D. Hammock. 2020. Ultrasensitive and rapid detection of Ochratoxin A in agro-products by a nanobody-mediated FRET-based immunosensor. Journal of Hazardous Materials 387:121678. doi: 10.1016/j.jhazmat.2019.121678.
- Teixeira, T. R., M. Hoeltz, T. C. Einloft, H. A. Dottori, V. Manfroi, and I. B. Noll. 2011. Determination of Ochratoxin A in wine from the southern region of Brazil by thin layer chromatography with a charge-coupled detector. Food Additives & Contaminants. Part B, Surveillance 4 (4):289–93. doi: 10.1080/19393210.2011.638088.
- Thakur, M. S., and K. V. Ragavan. 2013. Biosensors in food processing. Journal of Food Science and Technology 50 (4):625–41. doi: 10.1007/s13197-012-0783-z.
- Tian, F., J. Zhou, R. Fu, Y. Cui, Q. Zhao, B. Jiao, and Y. He. 2020. Multicolor colorimetric detection of Ochratoxin A via structure-switching aptamer and enzyme-induced metallization of gold nanorods. Food Chemistry 320 (August):126607. doi: 10.1016/j.foodchem.2020.126607.
- Tsia, K. K. 2016. Understanding biophotonics—fundamentals, advances, and applications. ed. Kevin Tsia, 1st ed. New York, NY: Jenny Stanford Publishing. doi: 10.1201/b15596.
- Turner, N. W., S. Subrahmanyam, and S. A. Piletsky. 2009. Analytical methods for determination of mycotoxins: a review. Analytica Chimica Acta 632 (2):168–80. doi: 10.1016/j.aca.2008.11.010.
- Uskoković-Marković, S., V. Kuntić, D. Bajuk-Bogdanović, and I. D. Holclajtner-Antunović. 2016. Surface-enhanced Raman scattering (SERS) biochemical applications. Encyclopedia of spectroscopy and spectrometry, 383–8. Academic Press. Elsevier. doi: 10.1016/B978-0-12-409547-2.12163-8.
- Van Dorst, B., J. Mehta, K. Bekaert, E. Rouah-Martin, W. De Coen, P. Dubruel, R. Blust, and J. Robbens. 2010. Recent advances in recognition elements of food and environmental biosensors: a review. Biosensors & Bioelectronics 26 (4):1178–94. doi: 10.1016/j.bios.2010.07.033.
- Var, I., and B. Kabak. 2007. Occurrence of Ochratoxin A in Turkish wines. Microchemical Journal 86 (2):241–7. doi: 10.1016/j.microc.2007.04.002.
- Vashist, S. K., and J. H. Luong. 2018. Bioanalytical requirements and regulatory guidelines for immunoassays. Handbook of immunoassay technologies: approaches, performances, and applications, 81–95. Academic Press. Elsevier. doi: 10.1016/B978-0-12-811762-0.00004-9.
- Visconti, A., M. Pascale, and G. Centonze. 2001. Determination of Ochratoxin A in wine and beer by immunoaffinity column cleanup and liquid chromatographic analysis with fluorometric detection: collaborative study. Journal of AOAC International 84 (6):1818–27. doi: 10.1093/jaoac/84.6.1818.
- Vitali Čepo, D., M. Pelajić, I. Vinković Vrček, A. Krivohlavek, I. Žuntar, and M. Karoglan. 2018. Differences in the levels of pesticides, metals, sulphites and Ochratoxin A between organically and conventionally produced wines. Food Chemistry 246 (April):394–403. doi: 10.1016/j.foodchem.2017.10.133.
- Wang, H., H. Rao, M. Luo, X. Xue, Z. Xue, and X. Lu. 2019. Noble metal nanoparticles growth-based colorimetric strategies: from monocolorimetric to multicolorimetric sensors. Coordination Chemistry Reviews 398:113003. doi: 10.1016/j.ccr.2019.06.020.
- Wang, Q., Q. Yang, and W. Wu. 2020. Graphene-based steganographic aptasensor for information computing and monitoring toxins of biofilm in food. Frontiers in Microbiology 10 (February) doi: 10.3389/fmicb.2019.03139.
- Wei, J., H. Chen, H. Chen, Y. Cui, A. Qileng, W. Qin, W. Liu, and Y. Liu. 2019. Multifunctional peroxidase-encapsulated nanoliposomes: bioetching-induced photoelectrometric and colorimetric immunoassay for broad-spectrum detection of Ochratoxins. ACS Applied Materials & Interfaces 11 (27):23832–9. doi: 10.1021/acsami.9b04136.
- Wu, Y., Y. Zhou, H. Huang, X. Chen, Y. Leng, W. Lai, X. Huang, and Y. Xiong. 2020. Engineered gold nanoparticles as multicolor labels for simultaneous multi-mycotoxin detection on the immunochromatographic test strip nanosensor. Sensors and Actuators B: Chemical 316 (August):128107. doi: 10.1016/j.snb.2020.128107.
- Xiong, Y., W. Li, Q. Wen, D. Xu, J. Ren, and Q. Lin. 2022. Aptamer-engineered nanomaterials to aid in mycotoxin determination. Food Control 135 (May):108661. doi: 10.1016/j.foodcont.2021.108661.
- Xiong, Z., Q. Wang, Y. Xie, N. Li, W. Yun, and L. Yang. 2021. Simultaneous detection of Aflatoxin B1 and Ochratoxin A in food samples by Dual DNA tweezers nanomachine. Food Chemistry 338 (February):128122. doi: 10.1016/j.foodchem.2020.128122.
- Xu, L., Z. Zhang, Q. Zhang, and P. Li. 2016. Mycotoxin determination in foods using advanced sensors based on antibodies or aptamers. Toxins 8 (8):239. doi: 10.3390/toxins8080239.
- Yasmin, J., M. R. Ahmed, and B.-K. Cho. 2016. Biosensors and their applications in food safety: a review. Journal of Biosystems Engineering 41 (3):240–54. doi: 10.5307/JBE.2016.41.3.240.
- Yingju, L., L. Ying, W. Jie, S. Haoran, and C. Huaming. 2021. Dual-mode separation type immunosensor based on enzyme-induced biological etching and preparation method thereof. China.
- Zalevsky, Z., and I. Abdulhalim. 2014. Plasmonics. Integrated nanophotonic devices, 2nd ed., eds. W. Andrew, 179–245. Elsevier. doi: 10.1016/B978-0-323-22862-6.00006-2.
- Zangheri, M., F. Di Nardo, D. Calabria, E. Marchegiani, L. Anfossi, M. Guardigli, M. Mirasoli, C. Baggiani, and A. Roda. 2021. Smartphone biosensor for point-of-need chemiluminescence detection of Ochratoxin A in wine and coffee. Analytica Chimica Acta 1163 (June):338515. doi: 10.1016/j.aca.2021.338515.
- Zareshahrabadi, Z., R. Bahmyari, H. Nouraei, H. Khodadadi, P. Mehryar, F. Asadian, and K. Zomorodian. 2020. Detection of aflatoxin and Ochratoxin A in spices by high-performance liquid chromatography. Journal of Food Quality 2020:1–8. doi: 10.1155/2020/8858889.
- Zhang, L., X. W. Dou, C. Zhang, A. F. Logrieco, and M. H. Yang. 2018. A review of current methods for analysis of mycotoxins in herbal medicines. Toxins 10 (2):65. doi: 10.3390/toxins10020065.
- Zhang, C., C. Jiang, L. Lan, J. Ping, Z. Ye, and Y. Ying. 2021a. Nanomaterial-based biosensors for agro-product safety. TrAC Trends in Analytical Chemistry 143 (October):116369. doi: 10.1016/j.trac.2021.116369.
- Zhang, W., S. Tang, Y. Jin, C. Yang, L. He, J. Wang, and Y. Chen. 2020. Multiplex SERS-based lateral flow immunosensor for the detection of major mycotoxins in maize utilizing dual Raman labels and triple test lines. Journal of Hazardous Materials 393 (July):122348. doi: 10.1016/j.jhazmat.2020.122348.
- Zhang, L., Z. Zhang, Y. Tian, M. Cui, B. Huang, T. Luo, S. Zhang, and H. Wang. 2021b. Rapid, simultaneous detection of mycotoxins with smartphone recognition-based immune microspheres. Analytical and Bioanalytical Chemistry 413 (14):3683–93. doi: 10.1007/s00216-021-03316-5.
- Zhang, X., H. Zhi, M. Zhu, F. Wang, H. Meng, and L. Feng. 2021c. Electrochemical/visual dual-readout aptasensor for Ochratoxin A detection integrated into a miniaturized paper-based analytical device. Biosensors & Bioelectronics 180 (May):113146. doi: 10.1016/j.bios.2021.113146.
- Zhou, J., Q. Yang, C. Liang, Y. Chen, X. Zhang, Z. Liu, and A. Wang. 2021. Detection of Ochratoxin A by quantum dots–based fluorescent immunochromatographic assay. Analytical and Bioanalytical Chemistry 413 (1):183–92. doi: 10.1007/s00216-020-02990-1.
- Zhu, H., Y. Cai, A. Qileng, Z. Quan, W. Zeng, K. He, and Y. Liu. 2021a. Template-assisted Cu2O@Fe(OH)3 yolk-shell nanocages as biomimetic peroxidase: a multi-colorimetry and ratiometric fluorescence separated-type immunosensor for the detection of Ochratoxin A. Journal of Hazardous Materials 411 (June):125090. doi: 10.1016/j.jhazmat.2021.125090.
- Zhu, H., C. Liu, X. Liu, Z. Quan, W. Liu, and Y. Liu. 2021b. A multi-colorimetric immunosensor for visual detection of Ochratoxin A by mimetic enzyme etching of gold nanobipyramids. Mikrochimica Acta 188 (3):62. doi: 10.1007/s00604-020-04699-5.
- Zimmerli, B., and R. Dick. 1996. Ochratoxin A in table wine and grape-juice: occurrence and risk assessment. Food Additives and Contaminants 13 (6):655–68. doi: 10.1080/02652039609374451.