
ABSTRACT
Inquiry-based learning (IBL) is one of the most important learning strategies. Augmented Reality (AR) is an effective way to support this strategy, which is considered conducive to enhance academic achievements of students during IBL. This paper investigated teacher-student interactions during AR-supported IBL by comparison and case study. First, four video clips carried by two high schools were coded by improved Flanders Interaction Analysis System (iFIAS) with two clips in AR-supported class and others in no AR-supported class. Then, Lag Sequence Analysis (LSA) was used to extract sequence features based on the codes. Finally, suggestions on using AR in IBL and details about study were discussed. Results show that AR-supported IBL has more active responses from students and a higher response rate from teachers. Student responses in AR-supported IBL have more tendency to be approved by teachers. The interactive component of AR software is in positive relation to its capacity of flexible inquiry, but it requires more time to learn to operate and demands more demonstration behavior from teachers. Teachers should develop skills of asking questions to guide and give timely feedback when carrying out IBL supported by AR.
1. Introduction
Inquiry-based Learning (IBL) is an efficient way of fostering learners’ curiosity and motivation by supporting learners acquire, understand, and apply their understanding. It is most commonly done by investigating and collecting scientific data on a specific problem or phenomenon (Edelson et al., Citation1999). For constructive theorists, IBL, when supported by technology, emphasizes the learning mode featuring “autonomy, inquiry, and cooperation”. Technology-facilitated inquiry makes full use of information technologies to assist students’ inquiry, which has been widely used in classrooms (Duffy & Raymer, Citation2010; Kirschner et al., Citation2006; Kuhlthau, Citation2010; Saunders-Stewart et al., Citation2015). This strategy focuses on the development of students’ multiple intelligence, which helps to improve students’ scientific literacy, information literacy, and foster their creativity and science practices.
On the other hand, Augmented Reality (AR) is a 3D technology that integrates the physical world and the digital world in real-time. Many studies show that AR can deepen students’ understanding and strengthen their knowledge construction process during IBL (Bacca et al., Citation2014; Di Serio et al., Citation2013). AR, in the context of inquiry-based learning, is successfully implemented to achieve cognitive, motivational and emotional learning goals (Pedaste et al., Citation2020).
However, AR creates new challenges for educators. In terms of technology, AR in IBL programs is mostly presented in a way that conglomerates the virtual and the real: AR software recognizes pictures or objects in the real environment and displays the corresponding virtual objects on the mobile terminal screen (Zhang et al., Citation2021). AR software with higher interactivity also features relationships between multiple objects, where learners can control variables by touching virtual buttons to enable a process of inquiry (Cai et al., Citation2021). However, there is no clear research on the role and effect of different forms of AR in influencing the IBL classroom. Specifically, for interactive AR, would the differences about the number and types of AR target pictures used in learning be correlated to the classroom interaction process during student inquiry?
In addition to the issue of using the new technology, educators also need to consider how to promote student inquiry in an AR-supported classroom (Drexler, Citation2010). Educators are suggested to master a set of skills so as to promote students’ learning, such as promoting deep learning and effective interaction, or learning process management and environment design (Alalwan et al., Citation2020). At the same time, teacher–student interaction in the classroom may link to student’s learning motivation and academic achievement (Kiemer et al., Citation2015). The quality of teacher–student interactions has become a paramount factor affecting student’s learning quality during instruction (Pianta, Citation2017). Though there are certain number of researches investigating the educational effect of AR, evidence for examining teacher–student interaction in AR-supported class has been relatively limited until now, in particular for the inquiry process which allow students to explore and discover with teachers in interactive AR environment.
Therefore, the research aims to examine the characteristics of teacher–student interactions and different ways to interact in AR-supported IBL based on its positive learning effect.
2. Literature review
2.1. AR for inquiry-based learning
Research shows that AR has many advantages in supporting IBL. They can be explained in the following aspects (a) Support the organization and presentation of learning materials. For example, literature suggests that AR can be better to help students organize learning content (Chen et al., Citation2016). Students benefit from AR by exploring with intuition and by showing phenomenon that are difficult to observe without any technology assistance (Dede, Citation2009; Wu et al., Citation2013). (b) Motivate students to learn. AR can increase student’s motivation and establish a positive attitude (Akçayır et al., Citation2016; Sotiriou & Bogner, Citation2008). (c) Enhance students’ cognitive skills. AR can benefit the development of critical thinking and problem-solving ability (Dunleavy et al., Citation2009), enhance students’ self-regulation (Karagozlu, Citation2018), and enable students with high self-efficacy to deepen the knowledge construction process (Cai et al., Citation2019). Some scholars have carried out the research to understand the cognitive process of students in AR-supported class, such as Chiang et al. (Citation2014a). They use Lag Sequential Analysis (LSA) to examine the learning process in out-of-classroom contexts and find that AR supports learners to build deep knowledge.
Meanwhile, some researchers have noticed the limitations of AR. For example: (a) AR places demands on teacher applications. AR has a higher technology demand for teachers to implement in the classroom (Lin et al., Citation2011). In particular, Cai et al. (Citation2019) pointed out that teachers’ design of AR classroom is critical for the success of AR in the classroom. (b) Barriers to teaching hardware. Hardware requisites are also a barrier when using AR, such as the lack of mobile devices (Wu et al., Citation2013). (c) AR teaching requires additional costs. For instructional purposes, the usage of AR also may take extra time in the classroom (Muñoz-Cristóbal et al., Citation2014).
2.2. Teacher–Student interactions in IBL: facts and method
Previous research has addressed that teacher–student interactions may link to student interest, learning motivation, and academic achievement (Araújo et al., Citation2016; Kiemer et al., Citation2015). Teachers’ language and behavior can support students’ self-regulated learning during reading and writing tasks (Perry et al., Citation2002). Students’ engagement can be fostered with high-quality teacher–student interactions (Pöysä et al., Citation2019), though students have relatively lower self-efficacy (Martin & Rimm-Kaufman, Citation2015). The teacher–student relationship in the IBL classroom is an effective predictor of student scientific literacy and learning outcomes (Kang, Citation2020). It is suggested to some extent that the quality of the interactions between a teacher and students plays an important role during IBL.
The method of classroom observation is the standard protocol to study teacher–student interaction (Perry et al., Citation2002). Classroom teaching behavior research has been a research field for half a century and is becoming an increasingly popular field of education research. Advanced coding technique, qualitative data mining and lag sequential analysis of video clips could generate the behavioral patterns of interactions (Cheng & Tsai, Citation2016; Chiang et al., Citation2014b).
There are many proven methods in terms of research classroom observation. The Flanders Interactive Analysis System (FIAS), proposed in the 1960s, is an analysis method widely used for quantitative analysis of classroom interactions (Flanders, Citation1963). Other new models, such as LICC model, are applicable to traditional teaching (Li et al., Citation2019). LoTi is a technology-supported classroom observation model (Moersch, Citation1995), and it is used to evaluate teachers’ ability to use technology.
In this study, it is necessary to consider a model that incorporates technology using into consideration scope. Gu and Wang (Citation2004) analyzed and improved FIAS to formulate the ITIAS (Information Technology-based Interaction Analysis System), and introduced the use of information technology to adapt to technology-supported classroom teaching better. Fang et al. (Citation2012) improved and adjusted ITIAS to an improved Flanders Interaction Analysis System (iFIAS). The iFIAS code can reflect the behavior of teachers and students in a more comprehensive way, and help to understand more intuitively the characteristics of the interaction between teachers and students in an exploratory classroom based on AR.
2.3. Research purposes and questions
Quasi-experimental research in education is often conducted based on real teaching and learning scenarios and is one of the common research methods used in interaction studies with technological interventions. Some proven classroom implementations used quasi-experimental research include that explore the impact of interactive whiteboards (IWBs) on teacher–student verbal interaction (Yang et al., Citation2015), explore the impact of MEMIS instructional support systems on classroom engagement (Chuang, Citation2017), explore the role of flipped classrooms on teacher–student interaction (He et al., Citation2019). A common idea of these quasi-experimental research is to set up experimental and control groups to conduct classroom activities based on different teaching tools, while keeping other conditions (number of students, level of prior knowledge, instructional design, etc.) as consistent as possible. This study was conducted to give an expository analysis of behavior characteristics and patterns of teacher–student interaction in AR-supported IBL classrooms. Moreover, the study was situated in IBL-based physics classrooms, and conducted the study of classroom interaction differences using experimental and control groups. The research questions are described as follows:
Is there a different sequence of feature behaviors resulted from the use of AR software with different interaction methods in the IBL classroom?
Does there exist representative interactive analysis characteristics in AR-supported IBL classrooms under coding and LSA? If so, what are they and how can we interpret these characteristic behaviors?
3. Methods
3.1. Participants
The study was conducted in two high schools, School I and School II in China. The primary reason that the schools were chosen is that the participants in the respective schools have had previous exposure in AR-based teaching and learning. Participants in School I have been introduced to an AR lesson sequence about single-slit diffraction and have demonstrated significant growth in terms of achievement degree in teaching objectives (Niu et al., Citation2018). Participants in School II have been introduced to an AR lesson sequence on the photoelectric effect and have demonstrated significant enhancement of self-efficacy and conceptions of learning (Cai et al., Citation2021). In other words, the participants have shown good learning performance in AR learning environments, although previous studies did not focus specifically on lag-sequential analysis. Nevertheless, it is plausible to assume that analysis performed on participants in these two schools is more likely to yield more fruitful and meaningful results on AR learning and interaction than a typical class that have no previous exposure to AR learning environments. Thus, the rationale and even some necessity of the selection of such participants are justified, and the details of the schools and participants are explained below.
Typical classrooms are equipped with similar classroom resources and technology, as projectors and blackboards are available in every classroom. The only noticeable difference in both schools besides the demographics is that students in School II receive slightly higher disciplinary consequences than School I, which is dismissed as an insignificant factor for the purpose of this study. And thus, for the purposes of this study, students in School I and School II are considered homogeneous.
School I is located in a northern province in China, while School II is located in a southern province in China. The local area that both schools are situated is regarded as under-resourced areas according to national standards. Both schools enroll students of 10th, 11th, and 12th grade. Total student population is around 300 with a similar teacher-to-student ratio and similar class size (around 40 students per class).
All 10th grade students in both schools at the time were invited to the study, with an age range of 16 to 18 years. Seventy students in School I have given personal consent and parental assent, and 98 students in School II have given personal consent and parental consent. They were then randomly assigned into the experiment group or the control group in the respective schools, and thus the full sample size is 168 students, with 35 students in experimental and control group in School I, and 49 students each in School II.
3.2. Material
“Single Slit Diffraction” and “Photoelectric Effect” are selected topics in the Chinese high school physics curriculum. The standards require students to explore the causes and influencing factors of physical phenomena in groups using relevant equipment. The required experimental equipment (sophisticated physical instruments) is expensive in terms of this particular experiment. Moreover, this phenomenon is very abstract, which makes this standard a difficult one to cover in the regular physics curriculum. Research has shown that AR is conducive to help students to understand abstract knowledge and the cost of AR's operation equipment (tablet, smart phone and so on) is relatively low (Bujak et al., Citation2013). By the above rationale, we choose “Single Slit Diffraction” and “Photoelectric Effect” as the display content of AR program respectively, and help students to explore the law through the recognition map and virtual button.
The interactive AR simulation experimental programs used in this study were independently developed by the researchers. The model was built with 3D Max, and the AR application program was developed with Unity3D and Vuforia.
Two different AR software packages have been developed for the two topics, with different numbers of target images but same number of controllable variables and virtual buttons, see . Intuitively, Topic1: Single Slit Diffraction has more freedom of investigation and is more interactive, it has more complex operations, but this may also lead to students not being able to obtain the desired experimental phenomena. Topic2: Photoelectric Effect put all components in one single card, students cannot move specific component separately. But students can simply touch the virtual buttons to obtain the corresponding experimental phenomena. Key information about these two AR is shown in .
Figure 1. The screenshot of AR application of “single slit diffraction” (Left) and “photoelectric effect"(Right).
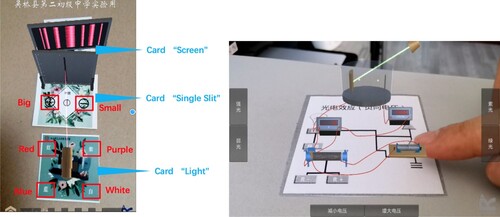
Table 1. Key Information on AR software for both topics.
3.3. Procedure
For both schools, the experiment class is designated as class A and the control class B, thus creating four classes for later analysis (IA, IB, IIA, IIB). All four classes were given one lesson that lasted about 45 min (39–49 min), with IA and IB on Single Slit Diffraction (Topic 1), IIA and IIB on the Photoelectric Effect (Topic 2). All four classes had the same instructor for the lesson, who is a research assistant with adequate teaching experience in AR-supported contexts. In addition, every class was also supported by a teaching assistant to distribute materials and handouts, or to guide the participants in using the applications.
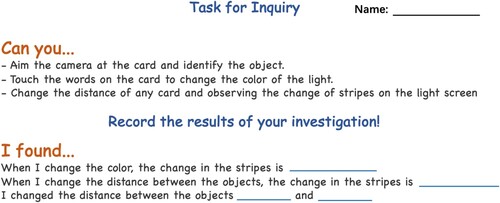
All four classes were taught under the information-technology-based-IBL pedagogy, in which the specific process is shown in . Specifically, the IBL pedagogy consists of the following steps: (1) The teacher created a physical investigation scenario based on actual phenomena; (2) The teacher posed an investigation question based on the scenario to stimulate students’ thinking; (3) Students used the AR software to conduct free exploration in small groups. The group size was 2–3 students, and students firstly familiarized themselves with the AR software according to the task list provided by the teacher, and then wrote down the phenomenon of investigation according to the problem, shows an example of a student inquiry task learning sheet; (4) Students presented their explorations and shared them with the group; (5)Teacher and students drew conclusions and reflected on them together.
Figure 2. Implementation process of IBL.
Figure 3. Example of a student inquiry task list.
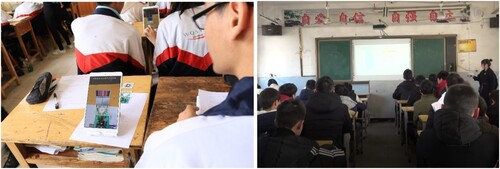
However, for the experiment itself (whether it is Single Slit or Photoelectric Effect), the experimental classes (IA and IIA) adopted the AR application and learned in pairs during the inquiry process, while the control classes (IB and IIB) completed the inquiry with an animation demonstrated by the teacher in a virtual simulation environment in front of the class. In order to control variables, all other conditions, such as teaching resources, teaching process, teaching links, etc. were held constant. shows the scene of students using AR program in tablets to explore and the teaching scene of the control group.
Figure 4. The scene of students using AR program in tablets to explore in AR-supported class (left) and the teaching scene of the control group (right).
3.4. Analysis method
In this study, an improved Flanders interactive system was used to encode video in classroom teaching (Fang et al., Citation2012), which can reflect the behavior from aspects of teacher language, student language, silence and technology use. Lag Sequential Analysis (LSA) can individually check out the sequential relationship between each behavior and make the feature sequence significant (Hou et al., Citation2010). GSEQ 5.1 was used to carry out Lag Sequential Analysis (LSA) to extract characteristic sequences of teacher–student interaction (Gunter et al., Citation1993).
3.5. IFIAS coding
is the coding system used in this study and its corresponding interpretation. The iFIAS codes the behavior of teachers and students in four aspects: Teacher Talk, Student Talk, Silence and Technology Use. This study seeks to use the teacher–student interactive coding system as coding scheme to describe the behavior of teachers and students.
Table 2. The improved Flanders interaction analysis system.
4. Results
4.1. IFIAS: characteristics of classroom interactions
In this study, the coding scheme of iFIAS was adopted to analyze the teacher–student interactions of the experimental group and the control group. According to iFIAS, the study coded four IBL classes every 3 s for one code unit. The time of every class is various from about 39–49 min, so we coded for the whole IBL class time rather than a fixed period of time. The two researchers used a back-to-back approach to encode the videos simultaneously, and the final consistency of the encoding results was 86%. At the end of the comparison, the two researchers discussed and agreed on the encodings where there were differences of opinion. The results are shown in .
Table 3. Descriptive statistics of iFIAS coding in the experimental group and the control group.
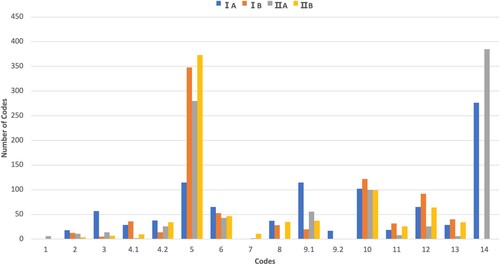
For School I, we accumulated 982 iFIAS codes in total for the experimental group and 801 codes for the control group. For School II, we obtained 965 codes for the experimental group and 781 codes for the control group. The coding statistics are shown in . According to each code of the two schools, the following has been observed:
The frequency of “Lecturing (Code 5)” in the control groups (43.45% and 47.76%) was significantly higher than those in the experimental groups (11.71% and 29.02%). In addition, “Lecturing” was the most frequent code in the control group. In the experimental group, the frequency of “Students use technology (Code 14)” behavior was significantly higher than the control group, which was the category with the highest percentage in the experimental group.
“Teachers accept or use student’s ideas (Code 3)” in the experimental group (5.80% and 1.45%) was slightly higher than that in the control group (0.37% and 0.90%), indicating that teachers tend to approve students’ answers in AR classrooms.
“Student talk-discussion with peers (Code 10)” (15.23% and 12.68%) and “ Silence or confusion that is favorable for teaching (Code 12)” (11.49% and 8.19%) in the control group were slightly higher than those in the experimental group (10.39% and 10.36%, 6.62% and 2.69%), indicating that non-AR class students tend to spend more time communicating with peers or thinking quietly.
In terms of classroom teaching structure, this part is composed of four items: the proportion of teachers’ talk (Codes 1∼7), the proportion of student talk (Codes 8–10), the proportion of silence that is beneficial for teaching (Code 12) and the proportion of technology application (Codes 13∼14). The proportion of student’s use of technology in the experimental group was prominent in all four iFIAS dimensions. While the silence ratio of students in the control group was prominent in all four iFIAS dimensions.
Comparing the coding data of IA and IIA in the AR classroom with different interaction methods, it was found that Topic1 “Technology Use” (31.06%) was lower than Topic2 (47.57%), but at the same time, Topic1 “Student Talk” (27.60%) was higher than Topic2 (15.10%). The more complex interaction of Topic1 generated more discussion, but students did not spend much time manipulating it.
Figure 5. Coding Statistics by iFIAS. Note: 1: teachers accept feeling, 2: teachers praise or encourage, 3: teachers accept or use student’s ideas,4.1: ask open questions, 4.2: ask closed questions, 5: lecturing, 6: Giving direction, 7: Criticizing or justifying authority, 8: student talk: response passively, 9.1: student talk: response proactively, 9.2: student talk: question proactively, 10: student talk: discussion with peers, 11: Silence or confusion that doesn’t contribute to teaching, 12: Silence or confusion that is beneficial for teaching, 13: teachers use technology, 14: students use technology.
4.2. Lag Sequence Analysis of teacher–student interaction
The coded data of the experimental group and the control group were imported into GSEQ 5.1 software for frequency statistics and Z-test. Codes 41, 42, 91 and 92 represent 4.1, 4.2, 9.1 and 9.2 in iFIAS codes respectively. demonstrates the residual table of the analyses sequence in School I, and the matrix for School II is seen in the Appendix Document “Appendix.docx”. Entries on the diagonal of the matrix are considered as identity sequences (i.e. 2/2 sequences, 3/3 sequences, etc.) and the off-diagonals are considered as transfer sequences. Since iFLAS coding systems are done in blocks of three seconds, the same behavior sequence (for example 2/2) does not justify their behavior stability, therefore the study focuses on the behavior of transfer sequence.
Table 4. Experimental sequence residual table (Z-score) (School I).
The resulting sequence of meaningful behaviors is shown in .
Table 5. Significance sequences of the experimental group and the control group.
After the significant transfer sequences for all four classrooms were collected, the intersection of sequences was considered as characteristics behavior sequences for the AR group (IA and IIA) and the control group (IB and IIB).
4.2.1. Characteristics of IBL classrooms
According to the shared sequence of the experimental group and the control group (4.2/9.1), it can be concluded that in the IBL class during this study, teachers ask closed questions and students tend to take the initiative to answer (4.2/9.1).
4.2.2. AR Topic comparison
Comparing the feature coding sequences of IA and IIA, different feature sequences of teacher–student interactions under different AR themes can be obtained, which reflects the results of the action of two different AR interaction methods. Firstly, the two experimental and control groups were compared separately, and the common behavioral sequences of the experimental and control groups were removed. Then the IA and IIA (after the removal of the common sequences) were compared to extract different characteristic behavioral sequences for analysis, and the behavioral sequences specific to the two themes are shown in .
Figure 6. Transformation diagram of behavior characteristics between Topic1 and Topic2 based on the code and LSA. Note: Numbers on the arrow indicates the z-value of this sequence pair, “*” indicates it is a significant sequence.
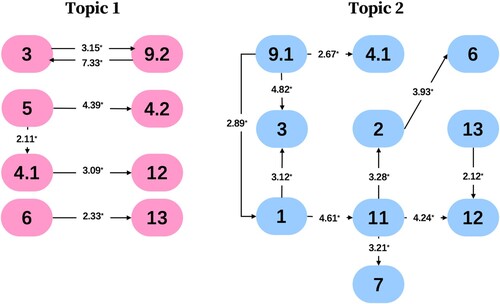
Based on the comparison results, two main points can be reasonably inferred: (1) Students in the Topic1 group were more inclined to ask questions (9.2/3) and students in the Topic2 group were more inclined to take the initiative to answer the teacher's questions (9.1/3); (2) In terms of technology use, the Topic1 classroom was dominated by teacher guidance and hands-on demonstration (6/13), while students in the Topic2 classroom would think and explore after the teacher's demonstration (13/12).
The Topic1 group was more complex and flexible due to the nature of AR software design, so students would ask more questions, either about the experiment itself or about its operation, and teachers would spend more time on coaching students to operate the software appropriately; on the other hand, the Topic2 group was relatively simpler and easier to use, and students were more inclined to think and explore on their own.
4.2.3. Group comparison
The shared sequence in the experimental group from both schools was taken as the sequence of the experimental group. The shared sequence in the control group was taken as the sequence of the control group. The different sequences between the experimental group and the control group were screened. We drew a corresponding behavioral transformation diagram for comparison, as shown in .
Figure 7. Transformation diagram of behavior characteristics based on the code and LSA. Note: Numbers on the arrow indicates the z-value of this sequence pair, “*” indicates it is a significant sequence; Data separated by “&” on the arrow indicates the z-value of School I and School II on the common sequence values.
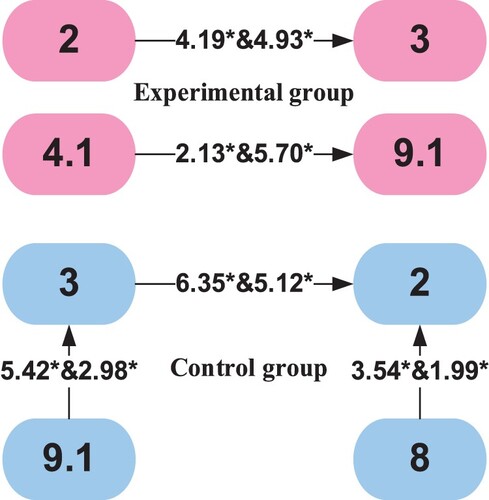
According to the behavior transition diagram, there are two prominent interaction patterns in the experimental group. Firstly, teachers in the experimental group tend to adopt students’ opinions (2/3) after praising or encouraging students, which indicates that teachers in the experimental group preferred to give students positive feedback then support learning based on students’ ideas. Secondly, students in the experimental group tended to respond actively to teachers’ open-ended questions (4.1/9.1), indicating that students in the experimental group are more active and responsive to teaching cues.
Moreover, there were three prominent interaction patterns in the control group. Firstly, teachers tended to adopt students’ opinions for further teaching after students answering questions initiatively (9.1/3). Secondly, teachers gave positive feedback after they adopt their opinions, such as praising or encouraging students (3/2). Thirdly, after students gave a passive response, the teacher would give positive feedback to students, either praising students or encouraging them for further work (8/2).
Based on these results, students in experimental group using AR showed more enthusiasm in answering open-ended questions, and for students’ answers, teachers firstly gave feedback and then adopted them. The teacher–student interaction in the control group was similar to the traditional teaching model: if the students answer actively, they tend to adopt it firstly, and then give feedback; if students answer passively, they tend to give feedback directly.
5. Discussion and conclusion
Inquiry-based learning classroom under an integrated informational technology context has demonstrated its advantages in terms of sustaining knowledge construction and developing scientific research abilities of the learners. AR, as its newest frontier in education technology in unpacking the cognitive process of the learners, has been considered as a strong addition to IBL because of its interplay between the virtual and the real as well as its strong interactive components. In order to study the characteristic of interaction between teacher and students in an AR-supported IBL classroom, this study has chosen two homogenous high schools with 168 middle school students as the subjects and conducted a quasi-experiment by setting up two experiment classes and two control classes.
5.1. Discussion based on the coding results for the experimental and control groups
From the iFIAS coding results, the main results are:
(a) The experimental classes (IA and IIA) tended to be more hands-on with the technology and took a longer time in the process. Although both the experiment and control classes utilized informational technology tools to support IBL pedagogy, but in an AR-supported IBL classroom, the total time in the inquiry process is longer.
(b) Students in the experimental group tended to respond positively to questions raised by teachers. The control group tended to spend time thinking, and the silence conducive to teaching had a higher proportion in classroom behavior. A study using the same coding framework confirms that flipped classrooms have a similar effect on student talk (He et al., Citation2019).
(c) The response rate of AR classroom teachers was higher than that of control classroom teachers. AR classroom teachers mostly used indirect response, while control classroom teachers mostly used direct response.
From the results it can be deduced that AR technology can increase student motivation and make the classroom active, but it also took up more classroom time.
5.2. In-depth analysis of the behavioral sequence characteristics for the experimental and control groups
The positive effect of AR technology on teacher–student interaction and knowledge construction in inquiry-based learning has been confirmed by the research of Chiang et al. (Citation2014b), and its performance can be further focused through the findings of this paper. Compared with the control class, the defining characteristics of interaction sequences of AR classrooms were reflected in students’ response to questions and in teachers’ feedback to students. As an inquiry-based class which integrated information technology, AR classrooms required teachers to ask questions effectively in order to promote the process of students’ knowledge construction. Students in AR classrooms tended to take the initiative to respond to teachers’ questions in general, but there were no significant sequences to indicate whether the questions raised are “close-ended questions” or “open-ended questions”. On the other hand, students in the control group only tended to respond actively after teachers raised “close-ended questions”. One implication is that the AR classrooms had achieved a similar level of knowledge construction as the control group, which is reflected in confidence in answering close-ended questions. Moreover, students in AR classrooms were able to give a more comprehensive, diversified, deeper thinking and responsed to the “open-ended question”. One interpretation is that AR could cause students to be more motivated to participate in the classroom, alongside with positive thinking and positive expression.
When facing with students’ responses, AR classroom teachers tended to give positive feedback to students firstly and then responded to their opinions or suggestions. This included encouragement or praise. “Encourage” is, in general, the positive feedback to incorrect or relatively weak responses. Although these answers might not be optimal, but AR classroom teachers would respond and accept these answers after encouragement or praise, thus giving students in AR classrooms more power, voice, and choice, again demonstrated the responsiveness and cohesiveness of AR classroom students.
5.3. Discussion of the differences between the two schools
According to the lag sequence behavior characteristic diagram: in School I, students gave active response after teachers’ asking questions; in School II, teachers asked closed questions firstly, students took the initiative to response, and then the teachers asked open questions. This difference could be interpreted as students in School II needed closed questions to do boot, and needed leading through closed questions to think about more open questions.
In addition, after students’ active response in School I, teachers could form a cycle between praising to encourage students and adopting students’ point of view, this is a benign cycle, but not in School II. While, after teachers gave praise or encouragement in School II, students would often fall into chaos that did not help teaching. Combined with the teaching field it could be explained that after positive feedback by the teachers, the class relaxed from the atmosphere of the teacher maintaining order, and the students began to whisper. The differences between students in the two schools cannot be ignored in the interaction between teachers and students.
5.4. Recommendations for application based on results
Some Suggestions can be provided for AR classroom interaction based on the results of LSA. The cost of classroom applications for AR software with different interaction methods should not be ignored. This study found that AR software that was complex to operate could support a more flexible and authentic inquiry process, but often required a longer effort to learn how to operate it, while AR software that was simple to operate was easy to get started and allowed students to quickly engage in the inquiry process, but its support for flexible interaction was limited. AR software needed to be designed with specific teaching scenarios in mind.
AR classroom teachers should pay special attention to the inspiration or guidance for students, and the way to achieve this inspiration or guidance can be in the form of questions. Whether the questions are open-ended or close-ended, this study did not find a difference in the active response of students. Teachers should reserve a period of time for students to think after asking questions. Teachers should give good feedback to students firstly. Before students using AR technology to learn, teachers should firstly clarify the learning purpose, use specifications, and issue instructions, preferably accompanied by the teacher's own demonstration, which can also ensure a smooth and orderly classroom.
Statement on open data
We accessed the video by recording classes in two high schools. All the students and teachers had been informed that their behaviors during the recording were used for research only. We used iFLAS to code the video and LSA to analyze the data. If you want to get the original coded data collected in this research, please email the corresponding author and we will be happy to provide it to you.
Statement on ethics
This research was carried out under ethical guidelines. We took an experiment in two high schools and we informed all the participants the basic information about the research, and we received written, explicit permission from both the student and their parents/legal guardians. To ensure confidentiality, all students’ personal identifiers were removed prior to processing the data.
Disclosure statement
No conflict of interest exits in the submission of this manuscript, and the manuscript is approved by all authors for publication. I would like to declare on behalf of all the co-authors that the work described is original research that has not been published previously, and not under consideration for publication elsewhere, in whole or in part.
Additional information
Funding
Notes on contributors
Su Cai
Su Cai is an associate professor at the School of Educational Technology in Beijing Normal University, China.
Xiaojie Niu
Xiaojie Niu is a master student of Distance Education in Beijing Normal University, China.
Yuxi Wen
Yuxi Wen is an undergraduate in mathematics at Vanderbilt University, USA.
Jiangxu Li
Jiangxu Li is an undergraduate in the Faculty of Education, Beijing Normal University, China.
References
- Akçayır, M., Akçayır, G., Pektaş, H. M., & Ocak, M. A. (2016). Augmented reality in science laboratories: The effects of augmented reality on university students’ laboratory skills and attitudes toward science laboratories. Computers in Human Behavior, 57, 334–342. https://doi.org/10.1016/j.chb.2015.12.054
- Alalwan, N., Cheng, L., Al-Samarraie, H., Yousef, R., Alzahrani, A. I., & Sarsam, S. M. (2020). Challenges and prospects of virtual reality and augmented reality utilization among primary school teachers: A developing country perspective. Studies in Educational Evaluation, 66, 100876. https://doi.org/10.1016/j.stueduc.2020.100876
- Araújo, P. T., Cardoso, A. P., & Fidalgo, S. (2016). Leadership and pedagogical interaction as predictors of learning outcomes in physical education. In 7th ICEEPSY 2016 International Conference on Education & Educational Psychology. Future Academy. Cognitive-crcs. https://doi.org/10.15405/iceepsy2016 (1986-3020)
- Bacca, J., Baldiris, S., Fabregat, R., & Graf, S. (2014). Augmented reality trends in education: A systematic review of research and applications. Educational Technology & Society, 17(4), 133–149.
- Bujak, K. R., Radu, I., Catrambone, R., Macintyre, B., Zheng, R., & Golubski, G. (2013). A psychological perspective on augmented reality in the mathematics classroom. Computers & Education, 68, 536–544. https://doi.org/10.1016/j.compedu.2013.02.017
- Cai, S., Liu, C., Wang, T., Liu, E., & Liang, J. C. (2021). Effects of learning physics using augmented reality on students’ self-efficacy and conceptions of learning. British Journal of Educational Technology, 52(1), 235–251. https://doi.org/10.1111/bjet.13020
- Cai, S., Liu, E., Yang, Y., & Liang, J. C. (2019). Tablet-based AR technology: Impacts on students’ conceptions and approaches to learning mathematics according to their self-efficacy. British Journal of Educational Technology, 50(1), 248–263. https://doi.org/10.1111/bjet.12718
- Chen, C. H., Chou, Y. Y., & Huang, C. Y. (2016). An augmented-reality-based concept map to support mobile learning for science. The Asia-Pacific Education Researcher, 25(4), 567–578. https://doi.org/10.1007/s40299-016-0284-3
- Cheng, K. H., & Tsai, C. C. (2016). The interaction of child–parent shared reading with an augmented reality (AR) picture book and parents’ conceptions of AR learning. British Journal of Educational Technology, 47(1), 203–222. https://doi.org/10.1111/bjet.12228
- Chiang, T. H. C., Yang, S. J., & Hwang, G. J. (2014a). An augmented reality-based mobile learning system to improve students’ learning achievements and motivations in natural science inquiry activities. Educational Technology & Society, 17(4), 352–365.
- Chiang, T. H. C., Yang, S. J., & Hwang, G. J. (2014b). Students’ online interactive patterns in augmented reality-based inquiry activities. Computers & Education, 78, 97–108. https://doi.org/10.1016/j.compedu.2014.05.006
- Chuang, Y. T. (2017). MEMIS: A mobile-supported English-medium instruction system. Telematics and Informatics, 34(2), 640–656. https://doi.org/10.1016/j.tele.2016.10.007
- Dede, C. (2009). Immersive interfaces for engagement and learning. Science, 323(5910), 66–69. https://doi.org/10.1126/science.1167311
- Di Serio, Á, Ibáñez, M. B., & Kloos, C. D. (2013). Impact of an augmented reality system on students’ motivation for a visual art course. Computers & Education, 68, 586–596. https://doi.org/10.1016/j.compedu.2012.03.002
- Drexler, W. (2010). The networked student model for construction of personal learning environments: Balancing teacher control and student autonomy. Australasian Journal of Educational Technology, 26(3), 369–385. https://doi.org/10.14742/ajet.1081
- Duffy, T. M., & Raymer, P. L. (2010). A practical guide and a constructivist rationale for inquiry based learning. Educational Technology, 50(4), 3–15.
- Dunleavy, M., Dede, C., & Mitchell, R. (2009). Affordances and limitations of immersive participatory augmented reality simulations for teaching and learning. Journal of Science Education and Technology, 18(1), 7–22. https://doi.org/10.1007/s10956-008-9119-1
- Edelson, D. C., Gordin, D. N., & Pea, R. D. (1999). Addressing the challenges of inquiry-based learning through technology and curriculum design. Journal of the Learning Sciences, 8(3-4), 391–450. https://doi.org/10.1080/10508406.1999.9672075
- Fang, H., Gao, C., & Chen, J. (2012). An improved Flanders interactive analysis system and its application. China Educational Technology, 309(10), 109–113 . https://doi.org/10.3969/j.issn.1006-9860.2012.10.022
- Flanders, N. A. (1963). Intent, action and feedback: A preparation for teaching. Journal of Teacher Education, 14(3), 251–260. https://doi.org/10.1177/002248716301400305
- Gu, X., & Wang, W. (2004). New exploration of classroom analytical techniques to support teacher professional development. China Educational Technology, 210(07), 18–21. https://doi.org/10.3969/j.issn.1006-9860.2004.07.004
- Gunter, P. L., Jack, S. L., Shores, R. E., Carrell, D. E., & Flowers, J. (1993). Lag sequential analysis as a tool for functional analysis of student disruptive behavior in classrooms. Journal of Emotional and Behavioral Disorders, 1(3), 138–148. https://doi.org/10.1177/106342669300100301
- He, Y., Lu, J., Huang, H. X., He, S. T., Ma, N. N., Sha, Z. M., … Li, X. (2019). The effects of flipped classrooms on undergraduate pharmaceutical marketing learning: A clustered randomized controlled study. PLoS One, 14(4), 22. https://doi.org/10.1371/journal.pone.0214624.
- Hou, H. T., Chang, K. E., & Sung, Y. T. (2010). Applying lag sequential analysis to detect visual behavioural patterns of online learning activities. British Journal of Educational Technology, 41(2), E25–E27. https://doi.org/10.1111/j.1467-8535.2009.00935.x
- Kang, J. (2020). Interrelationship between inquiry-based learning and instructional quality in predicting science literacy. Research in Science Education, 1–17. https://doi.org/10.1007/s11165-020-09946-6
- Karagozlu, D. (2018). Determination of the impact of augmented reality application on the success and problem-solving skills of students. Quality & Quantity, 52(5), 2393–2402. https://doi.org/10.1007/s11135-017-0674-5
- Kiemer, K., Gröschner, A., Pehmer, A.-K., & Seidel, T. (2015). Effects of a classroom discourse intervention on teachers’ practice and students’ motivation to learn mathematics and science. Learning and Instruction, 35, 94–103. https://doi.org/10.1016/j.learninstruc.2014.10.003
- Kirschner, P. A., Sweller, J., & Clark, R. E. (2006). Why minimal guidance during instruction does not work: An analysis of the failure of constructivist, discovery, problem-based, experiential, and inquiry-based teaching. Educational Psychologist, 41(2), 75–86. https://doi.org/10.1207/s15326985ep4102_1
- Kuhlthau, C. C. (2010). Guided inquiry: School libraries in the 21st century. School Libraries Worldwide, 16(1), 17–28.
- Li, Y., Zhao, S., Ma, Q., Qian, C., & Lin, Q. (2019). A feature analysis of regional classroom teaching in the trend of interactive instruction. Interactive Learning Environments, 27(2), 137–162. https://doi.org/10.1080/10494820.2018.1474230
- Lin, H. C. K., Hsieh, M. C., Wang, C. H., Sie, Z. Y., & Chang, S. H. (2011). Establishment and usability evaluation of an interactive AR learning system on conservation of fish. Turkish Online Journal of Educational Technology, 10(4), 181–187.
- Martin, D. P., & Rimm-Kaufman, S. E. (2015). Do student self-efficacy and teacher-student interaction quality contribute to emotional and social engagement in fifth grade math? Journal of School Psychology, 53(5), 359–373. https://doi.org/10.1016/j.jsp.2015.07.001
- Moersch, C. (1995). Levels of technology implementation (LoTi): A framework for measuring classroom technology use. Learning and Leading with Technology, 23(3), 40–40.
- Muñoz-Cristóbal, J. A., Jorrín-Abellán, I. M., Asensio-Perez, J. I., Martinez-Mones, A., Prieto, L. P., & Dimitriadis, Y. (2014). Supporting teacher orchestration in ubiquitous learning environments: A study in primary education. IEEE Transactions on Learning Technologies, 8(1), 83–97. https://doi.org/10.1109/TLT.2014.2370634
- Niu, X. J., Xu, X. Y., Cheng, L., & Cai, S. (2018). A comparative study on achievement degree of teaching objectives based on an interactive AR physical-simulation experimental procedure. Proceedings of the 26th International Conference on Computers in education, Philippines: Asia-Pacific Society for Computers in Education, Nov 26th-30th.434–439.
- Pedaste, M., Mitt, G., & Jürivete, T. (2020). What is the effect of using mobile augmented reality in K12 inquiry-based learning? Education Sciences, 10(4), 94. https://doi.org/10.3390/educsci10040094
- Perry, N. E., VandeKamp, K. O., Mercer, L. K., & Nordby, C. J. (2002). Investigating teacher-student interactions that foster self-regulated learning. Educational Psychologist, 37(1), 5–15. https://doi.org/10.1207/S15326985EP3701_2
- Pianta, R. C. (2017). Teacher-student interactions: Measurement, impacts, improvement, and policy. In Ralph P. Ferretti & James Hiebert (Eds.), Teachers, teaching, and reform (pp. 75–93). Routledge.
- Pöysä, S., Vasalampi, K., Muotka, J., Lerkkanen, M. K., Poikkeus, A. M., & Nurmi, J. E. (2019). Teacher–student interaction and lower secondary school students’ situational engagement. British Journal of Educational Psychology, 89(2), 374–392. https://doi.org/10.1111/bjep.12244
- Saunders-Stewart, K., Gyles, P., Shore, B., & Bracewell, R. (2015). Student outcomes in inquiry: Students’ perspectives. Learning Environments Research, 18(2), 289–311. https://doi.org/10.1007/s10984-015-9185-2
- Sotiriou, S., & Bogner, F. X. (2008). Visualizing the invisible: Augmented reality as an innovative science education scheme. Advanced Science Letters, 1(1), 114–122. https://doi.org/10.1166/asl.2008.012
- Wu, H. K., Lee, S. W. Y., Chang, H. Y., & Liang, J. C. (2013). Current status, opportunities and challenges of augmented reality in education. Computers & Education, 62, 41–49. https://doi.org/10.1016/j.compedu.2012.10.024
- Yang, K. T., Wang, T. H., & Chiu, M. H. (2015). Study the effectiveness of technology-enhanced interactive teaching environment on student learning of junior high School biology. Eurasia Journal of Mathematics Science and Technology Education, 11(2), 263–275. https://doi.org/10.12973/eurasia.2015.1327a
- Zhang, Z., Li, Z., Han, M., Su, Z., Li, W., & Pan, Z. (2021). An augmented reality-based multimedia environment for experimental education. Multimedia Tools and Applications, 80(1), 575–590. https://doi.org/10.1007/s11042-020-09684-x