
 ?Mathematical formulae have been encoded as MathML and are displayed in this HTML version using MathJax in order to improve their display. Uncheck the box to turn MathJax off. This feature requires Javascript. Click on a formula to zoom.
ABSTRACT
English language learners are a growing demographic in secondary, two-year, four-year and research institutions where many students encounter their first course in statistics. In the statistics education literature, recent calls have been made to improve statistical education for underserved student populations, including English Language Learners (ELLs). Some have investigated how ELLs interpret instructional material and classroom practices in the statistics classroom. This study uses a sequential mixed methods approach to investigate how Spanish-speaking ELLs may respond differently to assessment items about measures of center and variation. Comprehensive analyses of this type are essential in order to identify bias and ensure fair comparisons across participant populations. Findings indicate that ELLs do not comprehend context or understand some statistical terms in the same way as non-ELLs. Study limitations, implications, and recommendations are discussed.
1. Introduction
Recent calls have been made to improve statistical education for underserved populations (Enyedy et al. Citation2006). In response, some have focused on understanding how language background affects student learning in statistics (Lesser et al. Citation2013; Lesser and Winsor Citation2009; Lesser, Wagler, and Salazar Citation2016) but no studies have focused on assessment of statistical concepts for students from populations with a high proportion of English Language Learners (ELLs). The term ELL refers to a person who speaks English, but without mastery, and cannot fully participate in age-appropriate academic instruction (Goldenberg Citation2008). When assessing educational outcomes for student populations that include ELLs, it is essential to recognize how student populations may respond differently to assessment items in order to identify cultural bias and ensure meaningful comparisons across populations. It is a well-accepted notion that any test is at some level a test of language proficiency (Martiniello Citation2008), but tests can also be subject to cultural practices that affect the response process for particular populations. Ideally, the response process effect (cultural artifacts that affect responses) and language proficiency factors should be minimized as much as possible for a test to be used for comparative studies across populations. For example, for a student with differing perceptions of authority in classroom settings, an assessment item asking a participant to express an individual opinion may seem inappropriate or be misunderstood and elicit an unintended response from the student (Littlewood Citation2001; Dunn and Dunn Citation1993).
English language proficiency and cultural expectations are likely to affect the validity of items assessing knowledge of statistical concepts, such as items in the Assessment Resource Tools for Improving Statistical Thinking (ARTIST) database and Comprehensive Assessment of Outcomes in Statistics (CAOS) scale (delMas et al. Citation2007). In fact, Hulsizer and Woolf (Citation2009) contend that many assessments are validated on majority Anglo middle-income populations, and so little is known about how scales developed in this manner function on other participant populations. In order to illustrate how ELLs and non-ELLs may respond differently to assessment items, this manuscript presents a case study on how a set of ARTIST items function differently for ELLs versus non-ELLs. Utilizing a sequential mixed methods design, both qualitative evidence and quantitative evidence are presented to make the case that ELLs and non-ELLs may approach and interpret statistical reasoning items in different ways. Recommendations for teaching and research are provided.
2. English Language Learners in Higher Education
The population of ELLs in the United States is growing rapidly. According to Goldenberg (Citation2008), the population of ELLs in K- 12 public schools grew from 1 out of 20 in 1990 to 1 out of 9 only fifteen years later, and he argues that 1 in 4 K-12 students in the United States will be ELLs by 2028. Just in Texas, which has the second highest population of ELLs (832,000 ELL students compared to California with 1.1 million ELL students), 46% of Asian ELLs, 26% of Black ELLs and 15% of Hispanic ELLs enroll in a 4-year public college (Flores et al. Citation2012, p. 17). Spanish-speaking students are the dominant group of ELLs in the United States; in fact, those who speak Spanish are 80% of ELLs in public education (Pitoniak et al. Citation2009).
Note that oral fluency in everyday English is not an accurate indicator of mastery of academic English language proficiency (Cummins Citation1980). Experts in language acquisition contend that, when learning a new language, basic conversational fluency can develop in 1-2 years. However, acquiring English language proficiency for speaking, reading and writing at the level of their peers and in the academic register can take 5-7 years (Cummins Citation1992; Johnson Citation2010). Accordingly, this affects the role that language plays in a statistics classroom with a high proportion of participants who speak English as a second language may not have acquired full academic proficiency in English.
2.1. Background
It is recommended (GAISE College Report ASA Revision Committee Citation2016), that teachers “Assess and give feedback on students’ statistical thinking” (p. 16). However, assessing statistical thinking is often centered on language-based explanations, which can be difficult for linguistically diverse participant populations. Gal et al. (Citation1997) wrote on the complexity of assessing statistical knowledge, commenting that “educators are further challenged by the need to make sure that students understand the real-world problems that motivate statistical work and investigations, and by the need to help participants become familiar with the many nuances, considerations and decisions involved in generating, describing, analyzing, and interpreting data and in reporting findings” (p. 5). Note that many of the factors needed for a complete understanding of statistical concepts are rooted in language and many of the details of real world problems and nuances of statistical problems may get “lost in translation” for students who know English as a second language (Lesser and Winsor Citation2009; Lesser, Wagler, and Salazar Citation2016). For these reasons, efforts need to be made to establish that current statistical assessments are measuring student conceptual knowledge about statistics in valid and reliable ways for all populations.
2.2. ELLs in Mathematics and Statistics
In the mathematics education literature, there is a body of research about how ELLs versus non-ELLs respond to assessment items (Abedi and Lord Citation2001; Brown Citation2005; Herman and Abedi Citation2004; Solano-Flores and Trumbull Citation2003). Most studies in the mathematics education literature focus on K-12 participant populations. However, since statistics is now taught at the secondary level and with the increase of ELL populations in higher education, the focus on this population in statistics is also warranted. Due to fundamental differences between the mathematics and statistics disciplines, it cannot be assumed that all of the research findings about ELLs in mathematics education carry over into statistics. As Lesser and Winsor (Citation2009, p. 6) note, “the distinctiveness of statistics is relevant because one or more of the ways in which statistics is different from mathematics could plausibly affect how ELL issues play out in a concrete way.” There is a growing body of related literature on this topic within the statistics education field (Lesser et al. Citation2013). These research findings may be summarized as follows (Lesser and Winsor Citation2009):
ELLs’ movement among registers: confusion between the everyday usages of the word with academic usages of the word (in statistics or even mathematics).
Role of Context: ELLs may find the role of context in statistics confusing either because of lack of familiarity with the context or the way context is used to illustrate statistical principles.
Lesser et al. (Citation2013) shed light on many of the learning practices ELLs bring to an introductory statistics classroom. They found empirical evidence that ELLs are more likely than non- ELLs to experience register confusion (between the mathematics or every day and statistics registers), find the context or mathematical/statistical language of a problem difficult to understand, and have difficulty understanding statistical vocabulary. In short, the Lesser et al. research findings suggest that ELLs may have different experiences, strengths, and weaknesses when reading items and composing answers to problems in statistics.
Due to the role of language in statistics, the issue of how language is interpreted by ELLs is perhaps even more important in statistics than in mathematics, yet is still influenced by the role of language in mathematics. An academic register is primarily used in mathematics and statistics instruction, but instruction can also be influenced by the everyday language as well. This kind of interaction may play out in cases where statistical and mathematical terminology are common but have different meanings between the disciplines. For example, the word skew brings to mind non-symmetric distributions in statistics but may conjure ideas about skew lines (non-parallel but nonintersecting lines) in the mathematics register. This confusion between registers may be more problematic for students still mastering academic English.
There is some research investigating the impact of language on assessing participants in mathematics. In their study on how language is a factor in mathematics assessment, Abedi and Lord (Citation2001) randomized traditional and linguistically simplified mathematics assessment items for 8th-grade level students. They found that ELLs were at a disadvantage when solving word problems and that modifying the linguistic structure of the problem resulted in improved performance for ELLs. In a similarly designed study, Martiniello (Citation2008) assessed mathematical assessment items using differential item analysis (DIF) and compared changes in the DIF parameters with varying levels of linguistic complexity of the items. These research results collectively demonstrate that assessment items with high levels of linguistic and grammatical complexity favor non-ELLs over ELLs.
Other research studies, reported on by Abedi (Citation2004), concluded that ELLs perform better on “computational problems” versus “word problems.” Another study investigated math achievement differences between ELLs and non-ELLs on a literacy-based performance assessment (LBPA) in mathematics (Brown Citation2005). Her research findings suggest that LBPA, assessments which focus on concepts rather than algorithms for solving problems masks knowledge about mathematics for ELL populations. Similarly, Young et al. (Citation2011) identified differences between ELLs, those who were once identified as ELLs and non-ELLs on a content-based assessment in math that demonstrates inaccurate measurement favoring non-ELL populations. Overall, there is a multitude of evidence in the math education literature that low levels of English language proficiency can obscure knowledge about mathematics, particularly when mathematical concepts are assessed using “word problems” or assessment items use complex language. In statistics, almost all assessment items can be thought of as “word problems” and often involve lengthy descriptions of context. Hence, it is reasonable to expect the same disparity for ELL populations in statistics assessment items.
With regard to assessment in statistics, there have been considerable discussions about how best to assess participants in statistics courses (Berenson et al. Citation2008; Garfield and Ben-Zvi Citation2007; Garfield and Gal Citation1999; Onwuegbuzie and Leech Citation2003). Fulfilling the need for quality assessments in statistics, the ARTIST database and CAOS scale provide access to quality conceptual inventories (delMas et al. Citation2007). Finally, Kaplan et al. (Citation2012, Citation2010, Citation2009) have studied issues with vocabulary in statistics. However, it is important to point out that this and related studies do not focus on assessments of ELLs.
3. Method
A sequential explanatory mixed methods model (Creswell Citation2003; Johnson and Onwuegbuzie Citation2004), with the qualitative phase informed by the quantitative phase, was used to assess any difference in approach or response. The purpose of the quantitative part of this study is to investigate whether there is a difference in how ELL and non-ELLs respond to a set of ARTIST items about measures of center and variation. The qualitative phase allowed us to investigate how ELLs respond to the same set of ARTIST items about measures of center and variation.
3.1. Instrument
The instrument used is a collection of items assessing conceptual knowledge of measures of center and variation from the ARTIST database. The ARTIST database is a collection of assessment items for introductory level statistics. The database was developed in order to provide statistics educators and researchers a “reliable, valid, practical, and accessible” set of assessment items (delMas et al. Citation2007). The items are intended to be used by statistics educators so they can better understand participant learning and assess the impact of interventions in the classroom. The Appendix, available in the online supplementary files, contains the survey items selected for this study. These items focus on reasoning about measures of center and variability, a topic encountered in virtually all introductory statistics courses. These items were selected by searching on the NSF-funded ARTIST (Assessment Resource Tools for Improving Statistical Thinking; https://apps3.cehd.umn.edu/artist/ index.html) website for items concerning measures of center and variation. This resulted in seven items on measures of center and fourteen items on measures of variation. It was decided that 21 items would take too long to use in a voluntary assessment and, additionally, many items were redundant (assessing similar concepts but with different data-contexts). Thus, out of this pool of items, the research team selected six items that reflected concepts taught in the offered introductory courses and were not redundant, while making sure to select some that provided rich data-context. In addition, these items utilize vocabulary that past research results suggest may present difficulties for ELLs. For example, the Communication, Language And Statistics Survey (CLASS) identified that ELLs experience some difficulty differentiating among the words mean, median, and mode upon first encountering them (Lesser et al. Citation2013). Finally, due to the literature on confusion about context, the six items chosen require contextual reasoning about measures of center and variation. Four additional items are also included in the survey that were written by the first and third authors. One of the four is a direct question (asking for the range of a set of numbers), and the remainder ask about meaning of common statistics terms such as range and mean.
In the survey, three items were utilized for classifying participants as ELL or non-ELL. It is recognized that language fluency is a continuum and bilingual adults typically have a dominant language that is frequently domain specific (i.e., an every day versus academic dominant register) (Howarth Citation1998). However, for the purpose of this study, a rapid classification of each participant as an ELL or non-ELL is required. In order to achieve this goal, a series of short items were utilized instead of a lengthy language proficiency assessment. First, each participant was asked for their native or first language (English, Spanish or others). Then each participant was asked to rate their proficiency of the English language using the American Council on the Teaching of Foreign Languages (ACTFL) scale from 010, where 0 indicates no proficiency and 10 indicates speaking ability like an educated native speaker (American Council on the Teaching of Foreign Languages Citation1982/1986). Short descriptions of each numerical level of the scale were provided to respondents (see item 5 in the Appendix). A principal components model was estimated in R using the pca function (R Development Core Team Citation2015) and operating on these three measures of language use. The principal component model operated on the correlation matrix. This resulted in a set of principal component scores that weighted each measure using the following formula:
The resulting scores were plotted, and a division is noticeable around the scores less than or equal to approximately 30, which is also very near the median principal component score. This cutoff of 30 provided an operational definition for classifying the students as being (Spanish-speaking) ELL or non-ELL and is used in the remainder of the analysis. We note that using a measure such as the ACTFL in addition to the “native language” criterion is supported in the literature (Padilla Citation2004). The four participants that answered a language other than English or Spanish were dropped from the study.
As stated previously, this is a sequential mixed methods study. The first phase of the study was quantitative and took place in Fall 2011. Upon analyzing the data, the research team realized that a qualitative follow-up would provide deeper insights into why ELLs did not respond the same as non-ELLs. Thus, a qualitative study was planned for Fall 2015, when research resources and personnel were in place, where students from the same population were selected for in-depth interviews using the identical set of items used in the quantitative phase. The qualitative stage of the study aimed to provide context and meaning to the quantitative results observed. Below we describe the research setting and study phases in more detail.
3.2.1. Setting
The survey was administered to participants taking introductory statistics courses at a large urban research university or a large community college system in a large Southwestern urban environment. Both educational institutions are located by the Mexican border and have large populations of both ELLs and non-ELLs. Approximately 82% of the participant population at this university and community college system as well as the city population is Hispanic, and another 6% of the participant population are Mexican nationals. Most participants at the university and in the community are bilingual, speaking both English and Spanish. The majority of the participants were between 17-22 years of age, which is a typical age span for college students. In the sample, 12% were freshmen, 23% were sophomores, 25% were juniors, 39% were seniors, and 1% were graduate students. We note that these two participant cohorts are very similar with regard to demographics since the community college system is a feeder school for the research university (94% of transfer students to the university come from the community college). For the purpose of collecting the qualitative data, the target population was English Spanish bilingual participants who were taking an introductory-level statistics course during that (Fall 2015) semester. Participants were chosen exclusively from the same large urban research university where the quantitative data were collected. Two types of introductory level statistics courses are taught at the university: statistical literacy and statistical practitioner courses. A general mathematics course for social scientists is the prerequisite for both courses. However, an alternative prerequisite of Calculus I is allowed for the practitioner course. A statistical literacy course emphasizes understanding statistical results in research and the media and deemphasizes formulas and computation. In contrast, a statistical practitioner course trains participants to use statistical analysis and produce statistical results. These are the same introductory courses that were chosen for the quantitative part of the study. Participants taking literacy and practitioner courses were contacted via email. Once participants responded to the initial email (approximately 6% of those contacted), they were contacted again by the second author to set up an interview.
provides an overall timeline for the quantitative and qualitative stages of this study. Two graduate researchers conducted the qualitative and quantitative portions of the study which resulted in a gap between the two phases of the study. However, the student demographics are very stable with regard to the representation of Spanish-speaking ELLs at both the community college and research university. The following two subsections outline these two stages of the study.
Table 1. Study timeline.
3.2.2. Quantitative Stage
Institutional Review Board (IRB) approval was obtained before administering the survey to the participants, and a consent form was signed before taking the survey. The survey was not mandatory, no credit was given for taking the survey, and participants had the option to withdraw at any point. The survey was administered at the midpoint of the Fall 2011 and Spring 2012 semesters. There was an option to take the survey as a paper-based survey or an online version, with 242 taking the paper-based version and 105 taking the online version. The modality of the survey does not appear to affect the responses. Neither version took more than 10 min to administer. Out of the 347 included in the analysis, 128 participants were classified as ELLs and 219 as non-ELLs.
3.2.3. Qualitative Stage
For the qualitative data collection, the first five items of the quantitative survey were answered online by students, and the remaining ten items were answered during the interview that was videotaped and, as a backup, also audiotaped. In the interview, the questions were presented with the students directed to answer the question and provide an explanation about why they chose that answer. This left it open for the student to cite any reason they chose an answer rather than prescribing a framework on the student. These data were collected during November and December of the Fall 2015 semester, by which point students had covered most topics addressed by the items. All five students from the respondents were selected to be interviewed. However, only four interviews were assessed due to problems with the responses of one student. One student did not provide in-depth answers that explained her thinking about the questions. She uniformly responded with an “I don’t know” or “I was guessing” each time she was prompted to explain her answer. Interviewee ages ranged from 18 to 25 years old. Three out of five students identified themselves as ELLs and were classified as such based on the set of three items. summarizes the four students assessed in the qualitative phase of this study.
Table 2. Background of students interviewed.
Ten items that were given to the students during the interviews and quantitative survey were classified (using categories emerged from discussions about the questions) into three categories: (1) context-heavy, (2) direct, and (3) graphical. The classification of items was straightforward. Context-heavy items are those that may lead to multiple interpretations due to the context. Students may answer in one way or another depending on their interpretation of the context. Direct items are usually short items that are easy to interpret and that do not lead to multiple interpretations: for example, items that ask for definitions. Graphical items may be context-heavy or direct, but they are characterized by the aid of a graphical representation to help in the interpretation of the items. The interviews were videotaped in order to capture not only the verbal responses given by the students but their movements and gestures as well. The audiotape was utilized mainly as a backup in case the audio on the videotape was not clear.
3.3. Data Analysis
A global chi-squared independence test for association between response pattern and ELL classification was conducted and found to be statistically significant (p-value < 0.001). Following the global test, permutation tests were utilized to compare the proportions of participants who responded correctly to each item. Additionally, permutation tests also assessed any association between being classified as ELL and response pattern on each item. For all stated p-values, the original non-adjusted p- value is presented along with a multiplicity adjusted p-value making use of the false discovery rate method (Benjamini and Hochberg, Citation1995).
Four interviews were selected out of the five conducted, as described in section 3.2.3. The first and second authors are knowledgeable about applications of the theory of register in statistics classroom settings but were not provided a code list prior to viewing the data. After the interviews were transcribed, a modified open coding was utilized for the qualitative data with the goal to record categories that emerge and later connect them to the research questions. The process of coding and interpreting qualitative data is iterative, and three subsequent passes through the transcripts refined the emergent themes and relationships to the research questions. The author who conducted the interviews only briefly looked at some notes on coding a month before the interviews and did not consciously consider them in posing questions to the students. Most of the categories that emerged happen to be well described by concepts from literature, as will be detailed in the next section. Items were classified by two investigators independently, who were found to have 100% agreement.
4. Results
4.1. Quantitative Results
displays the percentage of responses for each item of the scale. The correct answer is in boldface for each item in the table, and the modal answers are italicized. Note that items 13, 14, and 15 are omitted from this table and will be discussed separately in this manuscript. However, all items are available in the Appendix.
Table 3. Percentages of responses on items for ELLs (n = 128) and non-ELLs (n = 219).
Overall, item 6 appears to favor non-ELLs. Only 31% of ELLs, compared to 48% of non-ELLs, responded correctly to this item. Among ELLs, many answered with option C, which states that the most common number of children per household is 2.2. This option was not as common among non-ELLs. Item 8 asks about the location of the median if the top 10 scores are increased by 5 units. Most students chose the option stating that the median of the new score distribution will be higher than the original score distribution, but more non-ELLs answered this item correctly. Respondents answered item 9 correctly 70% of the time among the ELL population and 82% of the time among the non-ELL population. This was a simple directly worded question asking about variability. Item 12 asked respondents to select the best measure to summarize the variability for skewed data. The correct answer for this item is option D since the interquartile range is the best measure to use to summarize the variability on a data set because of its resistance to outliers. This item had the lowest percentage of a correct response by both ELL and non-ELLs. Only 17% of ELL and 28% of non-ELL responded correctly to this item and options B and C were the most popular wrong options among both populations. In order to substantiate these differences, presents summaries of the permutation test analyses for comparing the proportion correct and association for each question. Note that in both the association and proportion tests, items 6, 8, 9, and 12 have different response patterns and proportions correct at the 10% significance level since this is commonly used in the social sciences to guard against type II errors for assessing phenomena that are difficult to measure. For item 12, which asked respondents to choose a measure for summarizing the variability of a plot that is visually skewed, both ELLs and non-ELLs chose standard deviation as the most appropriate measure even though the data were skewed. However, non-ELLs were slightly more likely to choose an outlier resistant measure such as the IQR. Items 6 and 8, which have long descriptions and require contextualized reasoning, show evidence of differences between the ELL and non-ELL cohorts. The proportion of non-ELLs answering these items correctly is much higher than the proportion of ELLs. Finally, item 9 was a direct question asking for the range of a small set of data. Non- ELLs were more likely to answer this correctly.
Table 4. Association between ELL status and response pattern and proportion correct.
Items 13, 14, and 15 were not included in because they have differing choice levels but are instead discussed in the text. All three of these items asked for the definition of a term used in statistics that also has everyday meaning. It was not specified about whether the term should be thought of as a statistical or everyday term because it was thought that among those with limited English, perhaps the everyday meaning would be chosen less often than among non-ELLs. None of these items showed any practical difference between the ELL and non-ELL populations with approximately 80% of ELLs and non-ELLs responding correctly to the question asking for a definition of range, about 58% (ELL) and 63% (non-ELL) responding correctly when asked for a definition of average, and 29% (ELL) and 43% (non-ELL) responding correctly when asked for a definition of spread. On both item 12 and 13, most ELLs and most non-ELLs chose the correct definition. Whereas, for item 15, asking about spread, a majority (51%) of ELLs chose the incorrect answer for defining spread (“To scatter, distribute, disperse; to go apart or separate; to extend over a larger space”). Among non-ELLs, more chose the statistical answer for spread (43%) versus the most common response for ELLs (40%). In , note that a statistically significant difference in proportion correct was also detected for this item.
4.2. Qualitative Results
In the following subsections, items are discussed according to type. There are items that are found to be statistically significant for ELL status among each type, and the qualitative results can shed light on why we are observing these differences.
4.2.1. Context-heavy Items
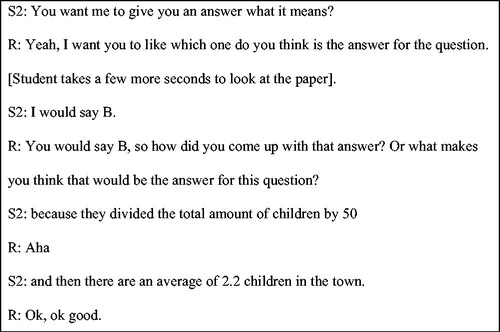
Items 6, 7 and 8 were classified as context-heavy. Item 6 presented students with a word problem where students were given the sample mean in the context of the problem and, based on that, students picked the correct choice out of four possibilities. For this particular item, Students 2 and 3 were able to correctly express their thought process behind their answer. In contrast, Students 1 and 4 answered the item incorrectly. Student 1 was unable to explain her thought process in a clear way (see excerpt in ). Similarly, Student 4 found the context confusion on item 6. The excerpt in demonstrates this confusion with statistical reasoning in context with Student 1. In contrast, Student 2 did not experience confusion due to context (see ). Item 7 talked about the concepts of mean and median as measures of center. Students were asked to determine which were the mean and median for the top 1% of individual incomes. In contrast to item 6, student responses to item 7 included some responses that could not be clearly categorized as correct or incorrect. Recall that the “between” classification was assigned when students who were able to pick the correct choice but not able to clearly explain their reasoning. For example, some students would say “I just know that is correct” and, despite prodding, did not provide more explanation. During the interview process, a great deal of confusion between the terms mean and median was evident. There was also confusion expressed about the usage of the term measures in statistics.
Figure 1. Excerpt from Student 1 interview.
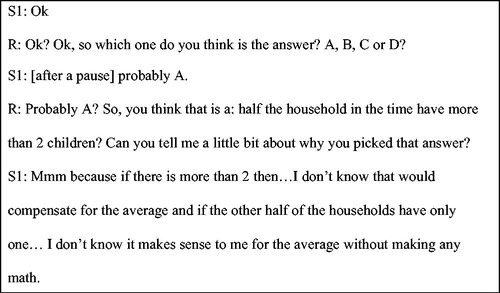
Figure 2. Excerpt from Student 2 interview.
Item 8 asks students about the median. The major problem that was detected here was the lack of academic terminology to express the students’ ideas. For the most part, students were able to explain the thought process behind their answer, but the lack of proper academic register was clear. There was also a minor confusion among academic terms (e.g., mean vs. median) but this was not consistent with all the students. But, for the most part, students provided clearer answers for item 8 than the other two items that were classified as context-heavy.
4.2.2. Direct Items
Items 9, 13, 14, and 15 were classified as direct items. Item 9 presented students with a short data set of ten numbers and students were asked to calculate the range of the given data set. Students from a practitioner course responded correctly to this item. They explained that the item was straightforward since they have learned the definition of range in class. Students from this class seemed to have a clear idea about the statistical term range. Students in the statistics literacy course did not know the term range. Students 3 and 4 were not only unable to answer to the item due to being unfamiliar with the term range but were also not able to remember the statistical definition of range even after several hints were given by the interviewer. The following excerpts in and illustrate: A similar response was given by Student 4.
Figure 3. Excerpt from Student 3 interview.
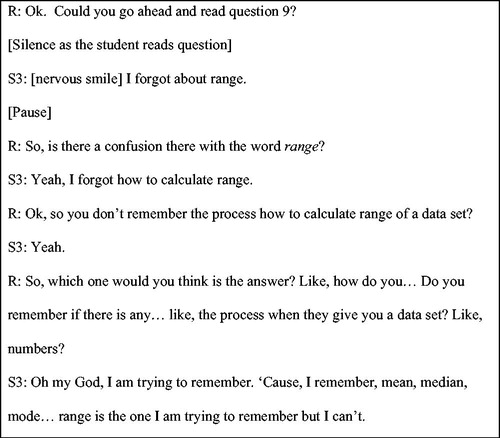
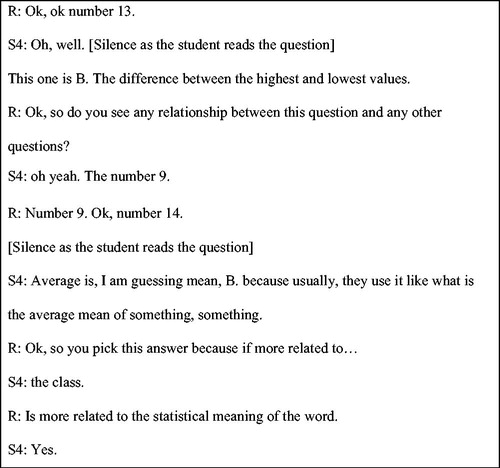
Figure 4. Excerpt from Student 4 interview.
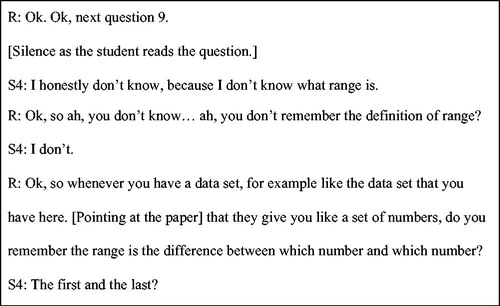
After Students 3 and 4 were given the definition of range, they had no trouble recognizing the correct answer, but this was a clear case of deficiency in their cognitive academic language proficiency. It can be argued that this is due to academic maturity rather than the level of English proficiency. Item 13 asked students to define the term range. After the investigator explained this concept to students 3 and 4, they were able to identify the correct response. Students that originally responded correctly to item 9 were able to make a connection between item 9 and item 13. Students who originally were lacking knowledge of the term range were able to retain the information provided and were also able to make a connection between item 9 and item 13. Item 14 was also answered correctly by all students. When students were asked why they picked that answer, all indicated that the definition of average was mean as they have learned in class. Some students went further in their explanation and said that the mean was the “average of the data.” In and , this connection is illustrated.
Figure 5. Excerpt from Student 3 interview.
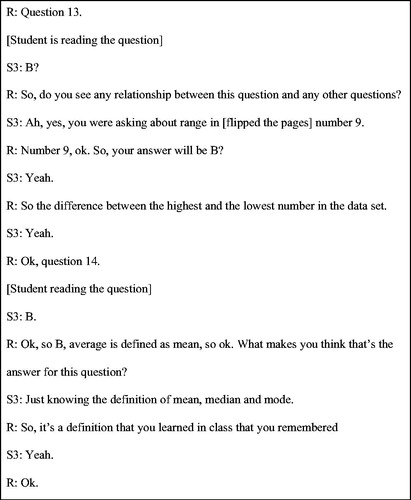
Figure 6. Excerpt from Student 4 interview.
Item 15 was also classified under the direct items category. However, this item represented a challenge for most students. Three out of the four students interviewed were able to come up with the correct answer, but their explanation was weak and vague. Most students tended to go with choices that had more statistical terms. None of the students considered “(E) Butter, jam dip” as a possible answer. The students, regardless of language background, were undecided between options A, B, C, D and E.
4.2.3. Graphical Items
Items 10, 11 and 12 were categorized as graphical items. Item 10 asked students to find which two measures would be most appropriate to describe center and spread for a skewed distribution. A graphical representation of the distribution was provided. Item 10 was answered correctly by three out of the four students. The student who answered this item incorrectly indicated that his first language was English and he had spent only 10% of the time speaking Spanish during the previous month. It can be argued that lack of understanding about the statistical term measures may have led Student 2 to the wrong answer. This is an example of confusion between academic and everyday registers. For the most part, the other three students were able to explain the thought processes that led them to their final choice. One of the students expressed confusion about the graphics (not understanding the role of the graphic in items 11 and 12), but after clarification about the meaning of the graphics the student was able to pick the correct answer.
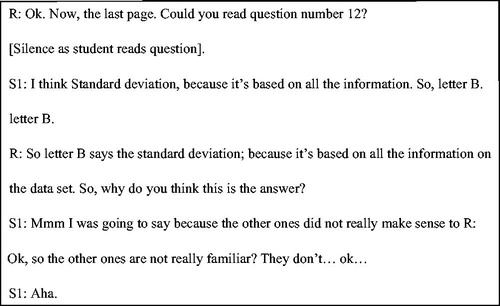
Items 11 and 12 presented no specific patterns. Item 11 was answered correctly by Students 1 and 4, incorrectly by Student 3 and “in between” by Student 2. Item 12 was answered incorrectly by Student 1, correctly by Students 2 and 4 and “in between” by Student 3. Even students who responded correctly or “in between” to item 11 had difficulty expressing themselves using proper statistical terminology. For the most part, these students were able to understand the item, but their explanations were lacking the appropriate academic terms. Student 1 answered item 12 incorrectly. This student indicated that she was unfamiliar with some of the terminology used in the context of the item; she also indicated that she was trying to guess the answer based on the terms that were familiar and/or made sense to her. A portion of the interview transcript of an ELL () illustrates how language background does not tend to affect their understanding of graphics-based items, but lack of knowledge about the associated statistical vocabulary did affect the response.
Figure 7. Excerpt from Student 1 interview.
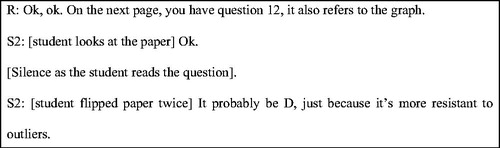
Now, a portion of the transcript for Student 2 (a non-ELL student) in illustrates how a student with a strong command of the statistical register responded to this graphics based item.
Figure 8. Excerpt from Student 2 interview.
4.3. Triangulation of Quantitative and Qualitative Stages
The triangulation used in the overall study included triangulation of researcher (e.g., researchers independently classifying qualitative data, as mentioned in Section 3.3) as well as triangulation of methods.
summarizes the results of the triangulation of the findings from the quantitative and qualitative stages. The question labels appear in the first column, followed by whether a particular student got the question correct (C) or wrong (W), and a summary of the difficulties experienced when explaining their answers. When two summaries about the question being correct or wrong appear, it is because the student asked to revisit the problem later in the interview to attempt another answer. The order is first attempt, second attempt in each instance. When a higher proportion of non-ELLs responded correctly to a question, the question number is bolded in the table.
Table 5. Triangulation of findings from quantitative and qualitative data.
The qualitative stage was intended to contextualize the quantitative data and provide insight into why, at times, particular questions appear to favor non-ELLs. This is why, in the qualitative stage, the researchers presented students with the same set of questions used in the quantitative stage and simply asked students to indicate their answer and explain why they chose that answer. Using this open approach yielded interesting insights into the quantitative data.
First, while it is usually thought that ELLs would have an easier time with directly worded questions, we found that an ELL can answer that only when there is strong familiarity with the technical term being used. This explains why question 9, asking students to compute the range, provided difficulty for ELLs rather than non-ELLs. The ELL participant in the qualitative stage clearly had no everyday language resource to draw upon to make inference about what a range could be in a statistical sense. Hence, the participant could not make an informed choice. In contrast, the non-ELLs can draw upon their everyday understanding of the word even if it was not emphasized or recalled from a statistics course.
Also, we do see complication due to context in the responses of all students, but particularly ELLs. In the qualitative stage, we do see Student 1 struggling with question 6 and the meaning behind having an average of 2.2 children. She cannot recognize the numerical meaning behind that figure and is instead trying to make sense of it in an everyday context. This provides some explanation about why there was an large difference between the ELL and non-ELL populations for this question.
With regard to the graphical items, the presence of graphical figures in a question did not appear to affect the response as much as the presence of academic terminology that was unfamiliar. Though graphics are often recommended for aiding non-native English speakers, they were less of a factor than language in our combined qualitative and quantitative data. Perhaps this is due to the figure being part of the statistical knowledge being tested rather than an explanatory aid (e.g., a visual useful to help people understand a concept).
5. Discussion
In the following discussion, key features of items are related to the quantitative and qualitative evidence for differences in responses for ELL and non-ELL respondents. The key features identified in the analysis are: the role of context and difficulty with statistical vocabulary. Some of the items may relate to more than one of these features, and when indicated, this is discussed.
5.1. Role of Context
When comparing ELL to non-ELL students, it appears that non-ELL students perform better in the context-heavy category than ELL students. This result is in accordance with the quantitative and qualitative results. Recall that items 6, 7, and 8 were classified as context-heavy. Context-heavy items were particularly challenging for ELL students because of their complicated structure and requirement to regard context while reasoning. Items 6 was particularly challenging for ELL students because some of the terms utilized in the items had more than one possible interpretation. For example, when students read the “most common number of children” they interpreted most common as the number that occurs the most. ELL students indicated that they were familiar with computing the sample mean of a data set; however, once this concept was placed in a data context, students had trouble interpreting the quantity. For the most part, students were able to recognize which terms being addressed in item 6 (the mean). However, it is clear that for ELL students this was a more challenging task. Responses to item 8 exhibited every day and academic register confusion. For the most part, students were able to pick the correct answer after reading the item carefully and recognize the use of the term bonus here does refer to the number of observations but to the value of the observations. Some students corrected themselves on the spot after picking the option of the distribution being higher after understanding the description.
In contrast, with the directly worded items, few differences were observed among ELLs and non-ELLs in either the qualitative or quantitative data. The interviews revealed that, most likely, when students responded incorrectly to these items, they were simply unfamiliar with the term. Once the term was clarified in the interview, the students were able to respond correctly. This makes evident why direct items are more approachable to ELLs and, in contrast, context-heavy items are more fraught with difficulty when students struggle with English language proficiency.
The main two issues identified for potential problems for the context-heavy items were a deficiency in CALP (Cognitive Academic Language Proficiency) and confusion between academic and everyday terms. There were also some instances where students had confusion between statistical registers such as mean and median, but for the most part, when this type of confusion arose in the interview, students were able to correct themselves within a few seconds or after they revisited the item. In the interviews, both of the ELL students either read the context heavy items twice or wanted to revisit these items at the end of the interview.
5.2. Difficulty with Statistical Vocabulary
As discussed in Section 5.1, non-ELLs responded correctly to item 6 more often than ELLs. On this item, participants were given the total number of households in a town and that the average number of children per household was 2.2. Using this information, they were asked to choose which statement was true. ELLs tended to choose the response that “The most common number of children in a household is 2.2” more often than non-ELLs. This may be due to misunderstandings about the meaning of average (average as common rather than mean). Additionally, ELLs may be de contextualizing the answer and not reflecting on the logical impossibility of the number of children (let alone the most common number of children) in a household not being a whole number.
Item 9 asked respondents to find the range for a small set of numbers. This was expected to provide little to no difficulty to ELLs since it is directly worded. The disparity between the ELL and non-ELL results may be explained by the presence of a false cognate (a word that looks or sounds similar to an English word but has a different meaning) in Spanish. Both ELLs in the interviews had trouble with the term and hesitated to answer. In particular, students 1 and 3 indicated that they were unfamiliar with the concept and were unable to give a correct response even after a brief explanation of it. This shows how the lack of academic registers may lead to poor performance during assessment even if the concept is well-formed. Perhaps academic maturity is a confounding factor in measuring student performance while answering assessment items. It should also be noted that the word rango in Spanish is best translated as rank, which may mislead students who have not come across the technical use of the word range. Similarly, if an ELL has conversational fluency in English and is familiar with the everyday uses of the word range, then this knowledge may mean the student must grapple with lexical ambiguity when encountering this word.
In the interviews, the two ELLs had a hard time understanding the meaning of variability and, overall, fewer ELLs correctly answered the item asking about variability (item 12). There was clear confusion between academic and everyday registers as one ELL student indicated her confusion between the word variability and the word variety. Given this confusion, it may be that ELLs more often pick the answer that contains familiar words or concepts commonly used in class than non-ELLs. Both students 1 and 3 opted for answers containing the term standard deviation. When they were asked about their choice, they indicated that it was the term they were more familiar with and, therefore, the one that made more statistical sense to them. Non-ELLs also showed some difficulty with this item. Student 2 indicated his confusion about the meaning of the word measures. For this particular item ELLs also had a harder time switching from phrases to their associated abbreviations. ELLs seemed to have a clear concept of what IQR was but had a harder time understanding this concept when the spelled-out phrase is used. Thus, it may be that they did not choose correctly because they had a hard time making the connection between IQR and interquartile range. Attempts were made to contact the two ELL respondents to check that this was a valid interpretation, but they did not reply.
5.3. Overall Summary
From the triangulation of qualitative and quantitative data, we can conclude that there is some evidence supporting the theory that ELLs have a more difficult time answering context-heavy items correctly. In particular, it was found that ELLs have a harder time making the transition from formulaic to contextual settings. In addition to this, there is some evidence that ELLs experience more difficulty making the connection between terms/phrases and their abbreviations. (For example, there was a clear confusion between IQR and Interquartile Range.) The directly worded items provided approximately the same level of difficulty for ELLs and non-ELLs. This result is consistent with previous research (Mornárez 2012). ELLs appear to experience additional confusion about academic terms that look or sound alike and also have difficulty distinguishing between the everyday and academic meanings of words. Finally, ELLs tended to be as strong or even stronger in their command of the formulas and technical details. However, they had difficulty translating this technical knowledge into context and expressing the in context interpretation so that it reflects their mastery of the technical knowledge.
5.4. Delimitations and Limitations
Delimitations of the study include the following. The ELLs involved in this study are Spanish-speaking ELLs (the dominant group by far of ELLs in the United States). It is not known how other ELL populations would respond to this set of items. Status as an ELL is used as a proxy for having less language proficiency in academic English, and it is assumed in the analysis that language proficiency is a factor resulting in any observed differences. However, issues having to do with prior schooling, cultural expectations, and socio-economic status may also influence language proficiency.
This study focused on analyzing assessment items measuring conceptual knowledge about measures of center and variation. Thus, the results of this study pertain only to these topics. However, this study contributes to the literature by illustrating the pitfalls of using common statistical assessments (such as the ARTIST database or the CAOS [Comprehensive Assessment of Outcomes in a first Statistics course; see https://apps3. cehd.umn.edu/artist/]) on ELL or other underserved participant populations, but falls short of evaluating the body of assessments commonly used in statistics education. The results of this research study can serve as a basis for future research studies, but does not fully address the issue of the content, criterion, or construct validity of the available conceptual knowledge assessments for ELL populations.
While it would be ideal to utilize a formal language proficiency test, these require specialized training and several hours to administer. Moreover, Abedi (Citation2004) contends that among the most important factors in identifying ELLs are to identify that he/she speaks a language other than English and scores low on English proficiency tests. However, in cases where a formal English proficiency test is not feasible, self-reported ratings of proficiency have been used (Herman and Abedi Citation2004).
For the purpose of the final analysis, one of the interview transcripts was removed from the analysis due to lack of explanation about the thought process behind the answers provided. When the student was asked about the reason why she picked her answers, she indicated that she was guessing or that she really did not know why she selected that choice. The student also indicated on several occasions that she had a lack of knowledge for statistical terms and that she was “bad” in statistics. The investigator encouraged the student to unpack about her reasoning behind her choices, but her responses remained uninformative. The student did not want to add any additional comments and investigator did not want to cause discomfort by pressing for information.
Finally, for the quantitative stage of the research project, information about which course the students are enrolled in was not recorded. Hence, though type of course was a factor we assessed in the qualitative stage, the research team recognized it was an important factor during the qualitative stage.
5.5. Recommendations for Assessment of ELLs
provides practical recommendations supported by the findings of this study and other related research (Abedi and Lord Citation2001; Brown Citation2005; Lesser et al.Citation2013; Lesser and Winsor Citation2009; Martiniello Citation2008). There is a particular emphasis on recommendations tailored for ELL populations; however, these recommendations would benefit any participant struggling with interpreting language used in assessment items for introductory statistics.
Table 6. Research findings and teaching recommendations.
6. Conclusion
Most assessment items used within the statistics education community would certainly be considered “word problems” by mathematics educators because of the use of language for conveying statistical contexts or concepts with minimal use of formulae. Particularly for introductory statistics participants, statistical ideas are communicated using language and the conceptual knowledge obtained depends heavily on this use of language. GAISE-aligned curricula emphasize language and contextualized reasoning, hence, this issue will become more frequent.
There is evidence of different response patterns on some items taken from the ARTIST database on measures of center and variation. ELLs had a lower probability of answering the item correctly and for other levels of ability that probability was similar for ELLs and non-ELLs. Items include those utilizing technical vocabulary and those where mistakes may easily be made if relying on procedural knowledge rather than contextualized interpretations. In most cases, non-ELLs were favored over ELLs on the items. This has implications for assessment in statistics education. If assessment items unduly favor one participant population over another, then it is not possible to make fair comparisons across populations. The findings of this research study illustrate the effect of non-invariant measurement of non-traditional participant populations, such as ELLs, so that these and other participant populations are not further underserved in the statistics classroom.
Further research is needed to understand how all participants (including ELLs) move from the everyday language to the academic language of a technical word used in statistics and how all participants interpret the data-context (Pfannkuch Citation2011) of statistical problems. Any research findings on these topics with a focus on ELL populations not only benefit this rising population of participants in university-level statistics courses but are likely to benefit the wider participant population as well.
Supplemental Material
Download Zip (21 KB)Acknowledgment
This article is based on the master's work of the first two authors, supervised by the third author (chair) and fourth author (committee member).
References
- Abedi, J. (2004), “The No Child Left Behind Act and English Language Learners:Assessment and Accountability Issues,” Educational Researcher, 33(1), 4–14. DOI: 10.3102/0013189X033001004.
- Abedi, J., and Lord, C. (2001), “The Language Factor in Mathematics Tests,” Applied Measurement in Education, 14(3), 219–234. DOI: 10.1207/S15324818AME1403_2.
- American Council on the Teaching of Foreign Languages. (1982/1986). “Proficiency Guidelines.” Hastings-on-Hudson, New York: Author.
- Benjamini, Y., and Hochberg, Y. (1995), “Controlling the False Discovery Rate: A Practical and Powerful Approach to Multiple Testing,” Journal of the Royal Statistical Society. Series B (Methodological), 57(1), 289300. DOI: 10.1111/j.2517-6161.1995.tb02031.x.
- Berenson, M. L., Utts, J., Kinard, K. A., Rumsey, D. J., Jones, A., and Gaines, L. M. (2008), “Assessing Participant Retention of Essential Statistical Ideas,” The American Statistician, 62(1), 54–61. DOI: 10.1198/000313008X272761.
- Brown, C. L. (2005), “Equity of Literacy-based Math Performance Assessments for English Language Learners,” Bilingual Research Journal, 29, 337–363. DOI: 10.1080/15235882.2005.10162839.
- Chance, B. L. (1997), “Experiences with Authentic Assessment Techniques in an Introductory Statistics Course,” Journal of Statistics Education, 5, 1–15.
- Creswell, J. W. (2003). Research Design: Qualitative, Quantitative, and Mixed Methods Approaches (2nd ed), Thousand Oaks, CA: Sage.
- Cummins, J. (1980), “Psychological Assessment of Immigrant Children: Logic or Institution?,” Journal of Multilingual and Multicultural Development, 1(2), 97–111. DOI: 10.1080/01434632.1980.9994005.
- Cummins, J. (1992), “Language Proficiency, Bilingualism, and Academic Achievement,” In The Multicultural Classroom: Readings for Content- area Teachers, eds. P. A. Richard-Amato and M. A. Snow, Reading, MA: Addison Wesley, pp. 16–26.
- delMas, R., Garfield, J., Ooms, A., and Chance, B. (2007), “Assessing Participants' Conceptual Understanding after a First Course in Statistics,” Statistics Education Research Journal, 6(2), 28–58.
- Dunn, R., and Dunn, K. (1993), Teaching Secondary Participants through their Individual Learning Styles: Practical Approaches for Grades 7-12, Boston: Allyn & Bacon.
- Enyedy, N., Mukhopadhyay, S., and Danish, J. (2006), “At the Intersection of Statistics and Culturally Relevant Pedagogy: Potential and Potential Challenges of Learning Statistics through Social Activism,” Proceedings of 7th International Conference on Teaching Statistics. Voorburg, the Netherlands: International Statistical Institute. http://iase-web.org/docu ments/papers/icots7/7A1_ENYE.pdf
- Flores, S. M., Batalova, J., and Fix, M. (2012). The Educational Trajectories of English Language Learners in Texas. Washington, DC: The Migration Policy Institute.
- GAISE College Report ASA Revision Committee (2016), “Guidelines for Assessment and Instruction in Statistics Education College Report 2016,” http://www.amstat.org/education/gaise.
- Gal, I., Garfield, J. B., and Gal, Y. (1997). The Assessment Challenge in Statistics Education. Washington, DC: IOS Press.
- Garfield, J. B., and Gal, I. (1999), “Assessment and Statistics Education: Current Challenges and Directions,” International Statistical Review, 67(1), 1–12. DOI: 10.1111/j.1751-5823.1999.tb00377.x.
- Garfield, J., and Ben-Zvi, D. (2007), “How Participants Learn Statistics Revisited: A Current Review of Research on Teaching and Learning Statistics,” International Statistical Review, 75(3), 372–396. DOI: 10.1111/j.1751-5823.2007.00029.x.
- Goldenberg, C. (2008), “Teaching English Language Learners,” American Educator, 33(2), 8–19, 22-23, 42-44.
- Herman, J. L., and Abedi, J. (2004), Issues in Assessing English Language Learners’ Opportunity to Learn Mathematics. Los Angeles: National Center for Research on Evaluation, Standards, and Participant Testing, Center for the Study of Evaluation, Graduate School of Education & Information Studies, University of California.
- Howarth, P. (1998), “Phraseology and Second Language Proficiency,” Applied Linguistics, 19(1), 24–44. DOI: 10.1093/applin/19.1.24.
- Hulsizer, M. R., and Woolf, L. M. (2009). A Guide to Teaching Statistics: Innovations and Best Practices. Oxford, UK: Wiley-Blackwell.
- Johnson, A. (2010). Teaching Mathematics to Culturally and Linguistically Diverse Learners. Boston, MA: Pearson.
- Johnson, R. B., and Onwuegbuzie, A. J. (2004), “Mixed Methods Research: A Research Paradigm Whose Time Has Come,” Educational Researcher, 33(7), 14–26. DOI: 10.3102/0013189X033007014.
- Kaplan, J. J., Fisher, D. G., and Rogness, N. T. (2009), “Lexical Ambiguity in Statistics: What do Students Know about the Words Association, Average, Confidence, Random and Spread,” Journal of Statistics Education, 17(3), 1–19. http://ww2.amstat.org/publications/jse/v17n3/kaplan. pdf
- Kaplan, J. J., Fisher, D. G., and Rogness, N. T. (2010), “Lexical Ambiguity in Statistics: How Participants Use and Define the Words Association, Average, Confidence, Random and Spread?” Journal of Statistics Education, 18(2), 1–22. http://ww2.amstat.org/publications/jse/v18n2/kaplan. pdf
- Kaplan, J. J., Rogness, N. T., and Fisher, D. G. (2012), “Lexical Ambiguity: Making a Case Against Spread,” Teaching Statistics, 34(2), 56–60. DOI: 10.1111/j.1467-9639.2011.00477.x.
- Lesser, L., Wagler, A., Esquinca, A., and Valenzuela, G. (2013), “Survey of Native English Speakers and Spanish-speaking English Language Learners in Tertiary Introductory Statistics,” Statistics Education Research Journal, 12(2), 6–31.
- Lesser, L., Wagler, A., and Salazar, B. (2016), “Flipping Between Languages? An Exploratory Analysis of the Usage by Spanish-speaking English Language Learner Tertiary Students of a Bilingual Probability Applet,” Statistics Education Research Journal, 15(2), 145–168.
- Lesser, L., and Winsor, M. (2009), “English Language Learners in Introductory Statistics: Lessons Learned from an Exploratory Case Study of Two Pre-service Teachers,” Statistics Education Research Journal, 8(2), 5–32.
- Littlewood, W. (2001), “Participants' Attitudes to Classroom English Learning: A Cross-cultural Study,” Language Teaching Research, 5(1), 3–28. DOI: 10.1177/136216880100500102.
- Martiniello, M. (2008), “Language and the Performance of English-language Learners in Math Word Problems,” Harvard Educational Review, 78(2), 333–368. DOI: 10.17763/haer.78.2.70783570r1111t32.
- Monarrez, A. (2012), “Analysis of Differential Item Functioning on Selected Items Assessing Conceptual Knowledge of Descriptive Statistics for Spanish-Speaking ELL and non-ELL College Students,” Master's Thesis at The University of Texas at El Paso.
- Onwuegbuzie, A. J., and Leech, N. L. (2003), “Assessment in Statistics Courses: More than a Tool for Evaluation,” Assessment & Evaluation in Higher Education, 28(2), 115–127. DOI: 10.1080/02602930301670.
- Padilla, A.M. (2004), “Quantitative Methods in Multicultural Education Research,” In Handbook of Research on Multicultural Education, eds. J. A. Banks and C. A. McGee Banks, San Francisco: Jossey-Bass, pp. 127–145.
- Pfannkuch, M. (2011), “The Role of Context in Developing Informal Statistical Inferential Reasoning: A Classroom Study,” Mathematical Thinking and Learning, 13(1-2), 27–46. DOI: 10.1080/10986065.2011.538302.
- Pitoniak, M. J., Young, J. W., Martiniello, M., King, T. C., Buteux, A., and Ginsburgh, M. (2009), Guidelines for Assessment of English Language Learners (ETS Research Report), Princeton, NJ: Educational Testing Service.
- R Development Core Team (2015), R: A Language and Environment for Statistical Computing: R Foundation for Statistical Computing, Vienna, Austria. http://www.R-project.org/.
- Solano-Flores, G., and Trumbull, E. (2003), “Examining Language in Context: The Need for New Research and Practice Paradigms in the Testing of English-language Learners,” Educational Researcher, 32(2), 3–13. DOI: 10.3102/0013189X032002003.
- Young, J. W., Holtzman, S., and Steinberg, J. (2011), “Score Comparability for Language Minority Participants on the Content Assessments Used by Two States,” ETS Report, RR-11-27. Princeton, NJ: Educational Testing Service. DOI: 10.1002/j.2333-8504.2011.tb02263.x.