
Abstract
The number of students assigned to special education has increased in the past decades, in spite of efforts for more inclusion. For students with mild learning or behavioral difficulties, special education assignment might be prevented if appropriate support is provided in general education. In this study, research on programs that could reduce the number of students assigned to special education is reviewed systematically. The review focuses on students in elementary schools. In total, 12 experimental or quasi-experimental studies of nine programs were reviewed. Programs were categorized based on what they were designed to improve: academic achievement, behavior, or both, and the multi-tiered Response to Intervention (RTI) framework was used to describe the intensity of the programs. It was found that several programs did reduce the number of students assigned to special education, while others did not or yielded mixed results. Three common elements of programs deemed effective were identified: an emphasis on tutoring, professional development and parental involvement. Implications for research and practice are discussed.
High-incidence disabilities
Students who struggle academically or behaviorally may be assigned to special education. In this paper, our focus is on the large group of students who are in the high-incidence categories of special education because of mild to moderate learning or behavioral disabilities. Of all students in special education in the United States (U.S.), 33% are identified as having a specific learning disability (SLD) (academic, behavioral, or both) and 18.9% as having a speech or language impairment (Institute of Education Sciences & National Center of Education Statistics (IES/NCES), Citation2020). This group comprises 7.4% of the total population of students aged 3–21 in the United States (U.S.). Diagnostic criteria for these disabilities have evolved over time (Slavin, Citation2018) and the number of students who qualify for referral to special education has increased in the past decades (Fuchs & Fuchs, Citation2006; Institute of Education Sciences & National Center of Education Statistics (IES/NCES), Citation2020). One of the reasons for this rise might be that high-incidence categories are fluid to some extent, as they are dependent on professional judgment and societal or state identification procedures and norms. For example, different states have different guidelines for the identification of students with specific learning disabilities (Maki, Floyd, & Roberson, Citation2015). There is not just variation between states, but even across districts and schools within the same state (Cottrell & Barrett, Citation2016; Lockwood, Farmer, Winans, & Sealander, Citation2021; Maki & Adams, Citation2019).
Diagnosing disabilities
These differences matter because different frameworks for identification (e.g., ability-achievement discrepancy, pattern of strengths and weaknesses, or Response to Intervention [RTI]) result in different diagnoses (Maki & Adams, Citation2020). A child could be identified as having SLD and receive special education intervention in one school, but not in a neighboring school. Similar patterns are observed in countries outside the U.S. (Jepma, Citation2003; NESSE, Citation2012; Powell, Citation2006).
Studies have shown that boys, students with a low socio-economic status, and students with summer birthdates are overrepresented in the high-incidence categories of special education (Cortiella & Horowitz, Citation2014; Hagans & Good, Citation2013; Martin, Foels, Clanton, & Moon, Citation2004; Sullivan & Bal, Citation2013; Wallingford & Thompson Prout, Citation2000). Furthermore, it is striking that students of color have a significantly higher chance of being referred to special education (Ballis & Heath, Citation2021b; Hosp & Reschly, Citation2003; Pit-ten Cate & Glock, Citation2018; Sullivan & Bal, Citation2013). The disproportionate representation of certain groups of students indicates that there is room for improvement in the process of special education assignment.
Special education referrals and placements
In the field of special education, differences in terminology may lead to confusion. In the U.S. educational system, it is common to make a distinction between special education referrals and special education placements. When a student is being referred, usually a committee evaluates his or her eligibility for special education (Hibel, Farkas, & Morgan, Citation2010; Maki et al., Citation2015). Although there is no central registration of the number of referred students, in most cases referral leads to actual special education placement (Baker, Gersten, & Keating, Citation2000; Hibel et al., Citation2010; Hosp & Reschly, Citation2003). In research and practice, various synonyms for special education placement are being used (such as receiving special education services, having a special education diagnosis/status, having an Individualized Education Program (IEP), or being identified as a special education student). In this paper, the umbrella term “special education assignment” is used, which refers to both referrals and placements.
It is important to note that the way special education is provided differs between countries (D’Alessio & Watkins, Citation2009; Ramberg & Watkins, Citation2020). In spite of efforts for more inclusion, some European countries (e.g., Germany, Belgium, the Netherlands, and Hungary) still have highly segregated systems, in which students with special educational needs are educated in separate schools (NESSE, Citation2012; Ramberg & Watkins, Citation2020). In contrast, special education services in the U.S. are mainly provided in schools for general education, as the Individuals with Disabilities Education Act (IDEA) requires that students with disabilities be educated in the least restrictive environment, meaning they are taught with other students without disabilities and not taken away from the general education classroom unless it is needed to make progress on learning. Nevertheless, appropriate placements and services for students with mild disabilities has been a topic of debate for a long time in the U.S. as well (Apling, Citation2001; Cortiella & Horowitz, Citation2014; Hettleman, Citation2019; Maki et al., Citation2015).
Potential harmful effects
For some students with high-incidence disabilities, participation in special education is clearly advantageous: the student receives individualized instruction from a specialized teacher, may be allowed accommodations for tests, such as extended time, and may benefit from additional supports in the classroom or curriculum, tailored to his/her individual needs. Nonetheless, while special education can be considered an entitlement and may lead to better educational outcomes for some students (Ballis & Heath, Citation2021a), struggling students might also experience negative consequences of a special education status. Research has shown that special education students experience an increased risk of poor academic outcomes, retention, and school dropout (Ballis & Heath, Citation2021b; Barrat et al., Citation2014; Jepma, Citation2003; Peetsma, Vergeer, Roeleveld, & Karsten, Citation2001; Young et al., Citation2002). Students in general education who are comparable in terms of background characteristics perform better in reading than their closely matched peers in special education (Morgan, Frisco, Farkas, & Hibel, Citation2010). Another point of concern is that a special education label may cause a stigmatizing effect: the learning or behavioral difficulty might then be viewed as something internal, stable, and uncontrollable, instead of something that is dynamic. For example, Shifrer (Citation2013) demonstrated that teachers and parents hold lower educational expectations for high school students labeled with a learning disability (LD) than for similarly achieving and behaving students without this label. Similar observations were found in a Norwegian study among students in Grades 4, 7, and 9 (Valås, Citation2001). A result of stigma might be that teachers and parents may unconsciously give low-ability cues throughout the day, negatively affecting students’ self-esteem and academic achievement (Clark, Citation1997; De Boer, Timmermans, & Van der Werf, Citation2018; Pit-ten Cate & Glock, Citation2018; Shifrer, Citation2013; Valås, 2001). For these reasons, misidentification of students for special education is a concern for policymakers and practitioners (Apling, Citation2001). It is important to carefully consider the costs and benefits of special education, especially for students with mild to moderate disabilities, and ensure that students are being correctly placed in special education, because special education does not benefit all students (Ballis & Heath, Citation2021b; Morgan et al., Citation2010; Powell, Citation2006).
Preventing special education assignments
From a preventive point of view, it is important to examine if there are programs that could reduce the number of special education assignments. The topic is addressed in several studies, though they differ from this review in terms of methodology and/or focus. For example, Schrag and Henderson (Citation1996) only synthesized studies on school-based intervention teams (SBIT, also known as prereferral intervention teams) and their impact on (among other things) special education services. The reviewed studies suggest that having such a team is likely to reduce the number of students referred to special education services, provided that resources are sufficient to implement the team with fidelity. However, this conclusion is mainly based on studies without appropriate control groups. A few years later, a meta-analysis of research on prereferral intervention teams (PIT) in elementary and middle schools was conducted by Burns and Symington (Citation2002), who also found that PIT were effective in reducing referrals to special education. They included both between-group comparisons (schools with and without PIT) and within-group comparisons (pre- and post-implementation of PIT) in their meta-analysis. Confidence in their conclusions was limited by the small number of studies that were eligible for inclusion. The studies reviewed by Reschly (Citation2010) indicated that early, intensive reading programs (provided one-to-one or in a small-group) can reduce the incidence of special education placements. However, the number of included studies on special education placements was again small (five, of which two concerned preschool programs). Manset-Williamson, St. John, Hu, and Gordon (Citation2002) studied the relations between instructional features of literacy programs, grade retentions, and special education referrals, using data from a self-report survey. They identified explicit skill instruction as a significant predictor of lower referral rates. Also, parent-child reading was associated with lower referral rates. A meta-analysis on student and system outcomes of RTI approaches was conducted by Burns, Appleton, and Stehouwer (Citation2005). Although it should be noted that their conclusions about special education assignments were based on only four quasi-experimental studies, they found that fewer than 2% of students were identified as having LD after participating in an RTI model, which is lower than average.
In the past two decades, RTI models became more and more influential, as an alternative to the IQ-discrepancy model that was used for a long time to identify students with learning disabilities. In an attempt to improve student access to early educational supports and prereferral services (Fletcher, Coulter, Reschly, & Vaughn, Citation2004), the revision of the IDEA in 2004 allowed schools in the U.S. to spend special education funds on preventive interventions for students at risk (Slavin, Citation2018). The RTI framework is multi-tiered, with Tier 1 being the core curriculum focused on all students; intensified small-group or technology-supported instruction in Tier 2 for struggling students; and specialized intervention in Tier 3 for the students who need even more support (Fuchs & Fuchs, Citation2006; Hughes & Dexter, Citation2011). Tier 2 and 3 interventions are often provided by people other than the classroom teacher (Stentiford, Koutsouris, & Norwich, Citation2018). Students who do not benefit enough from intervention, the so-called non-responders, may be assigned to special education, which is sometimes considered the fourth tier (Fuchs & Fuchs, Citation2006). While RTI was intended for all academic subjects, it is most often associated with reading (Fuchs, Fuchs, & Hollenbeck, Citation2007). Some possible reasons are that there is more research on reading disabilities as opposed to mathematic disabilities (Gersten, Clarke, & Mazzocco, Citation2007), there are fewer resources available for mathematics to use within an RTI framework (Lembke, Hampton, & Beyers, Citation2012), and more complexity to mathematics given the multiple domains of knowledge to be mastered (Fuchs, Fuchs, & Malone, Citation2016). Nevertheless, some prefer to broaden the scope of RTI and move to Multi-Tiered Systems of Support (MTSS). MTSS is based on the same theories and practices as RTI, but addresses both academic and behavioral issues (Reschly, Citation2014).
Although the simplicity of RTI/MTSS is appealing and the underlying assumptions about prevention and early intervention are evidence-based, research has shown that the effectiveness is dependent on many factors, such as administrative support, teacher buy-in, adequate meeting time, and ongoing professional development (Hughes & Dexter, Citation2011). Furthermore, the effect of RTI stands or falls by the quality and implementation of the programs used in each tier (Hoover, Citation2010; Kirby, Citation2017). The importance of providing effective, intensive additional instruction before determining special education eligibility has been emphasized in multiple studies (e.g., Bursuck & Blanks, Citation2010; Vaughn & Linan-Thompson, Citation2003; Wanzek & Vaughn, Citation2007). In other words, it could be expected that when RTI is properly implemented, educational outcomes of struggling students will be enhanced, “false positives” will be sorted out, and special education services will be reserved for the students who really need them. Slavin, Neitzel, Pellegrini, and Lake (Citation2019) advocate for a “Response to Proven Intervention” (RTPI) approach, in which only proven programs are used to ensure student success. A rigorous meta-analysis of reading programs for struggling readers (Neitzel, Lake, Pellegrini, & Slavin, Citation2022) resulted in a list of proven programs to help educators (see www.evidenceforessa.org). The main finding from this evaluation is that tutoring programs (either in a small group or a one-to-one setting) are most effective in improving reading performance, especially when incorporated in a whole-class or whole-school program as an aligned service for struggling readers. In the long term, investing in timely intervention in general education is expected to pay off via enhanced outcomes in the first place, and ultimately reducing costs of special education (Borman & Hewes, Citation2002; Slavin et al., Citation2019).
Purpose of this review
There is reason to believe that effective programs can improve students’ learning and behavior, and as a result can lower the number of students referred to and placed in special education. In this review, we focus on programs for students at risk for high-incidence disabilities, as these students might benefit most from preventive interventions. We define a program as a specific, replicable school day/school year approach combining materials, software, assessments, professional development, and other elements designed to improve the achievement of students. Because there is a need for an up-to-date synthesis of high-quality research on this topic, we investigated the following research questions:
What is known about the effectiveness of programs that potentially reduce the number of students assigned to special education?
What are common elements of programs that reduce the number of students assigned to special education?
Method
The first aim of this systematic review was to provide an overview of programs used in elementary schools that might prevent referral or placement in special education. The second aim was to provide educators with guidance about common elements of programs deemed effective. We utilized a best-evidence synthesis approach, which combines a systematic search and screening against rigorous standards with a narrative discussion of the studies and their corresponding effect sizes (Slavin, Citation1986).
Inclusion and exclusion criteria
Described below are the 11 inclusion criteria that were used to determine which studies were eligible for inclusion in this review:
The program was designed for use in general education settings. School-wide, classroom-based, small-group and individual-student targeted programs were eligible to be included.
The program was used with students in elementary schools (kindergarten through fifth grade), though outcomes could have been measured when students were in middle school or secondary school.
The program was clearly described (targeted skills, approach, duration, intensity) in the study, and all major components could, in principle, be replicated in schools.
The sample consisted of students who had not already been referred and placed in special education. Our main focus was on students at risk for being labeled as having specific learning disabilities, speech or language impairments, or mild intellectual disabilities (high-incidence categories). Studies of students with ADHD, an autism spectrum disorder, emotional disorder, or behavioral disorder were also eligible for inclusion. Studies that were focused on students with physical, sensory or severe intellectual disabilities (low-incidence categories) were excluded.
A similar comparison group, consisting of students who receive the regular instruction within general education programs (“business as usual”) was included in the study. It might have been that these students also received remedial services, if that was the standard practice at the schools.
Each condition contained at least 30 students, to avoid inflated effect sizes because of very small sample sizes, and two teachers, to avoid complete confounding of treatment effects with class or teacher effects (Cheung & Slavin, Citation2016).
The design of the study was a randomized experiment or a quasi-experiment (matched control group). Researchers must have adjusted for pretest differences.
Baseline equivalence in terms of achievement and demographics between groups was demonstrated. If pretest differences were greater than 0.25 standard deviations, the study was excluded, following the standards of What Works Clearinghouse (Citation2020).
The outcome measure was a quantitative measure of special education referral if the student’s eligibility for special education services was being evaluated, or special education placement if the student was found to be eligible for special education services.
The study took place in a member country of the Organization for Economic Co-operation and Development (OECD), to avoid large differences in educational systems, and the report was available in English.
The study included data collected between 1990 and 2019. We aimed for a broad overview of previous studies, but we limited this to studies from 1990, as the results still needed to be relevant for present-day education.
Search procedures
Search terms were defined to locate a large number of studies that might be eligible for inclusion in this review. To mitigate publication bias, we did not limit our search to published, peer-reviewed studies, as is recommended (Pigott & Polanin, Citation2020). It is known that effect sizes are likely to be overestimated if “gray literature” is not taken into account (Cheung & Slavin, Citation2016; Polanin, Tanner-Smith, & Hennessy, Citation2016). Before starting the search procedure, the three authors developed a review protocol defining the parameters for the research to be included within the scope of the review.
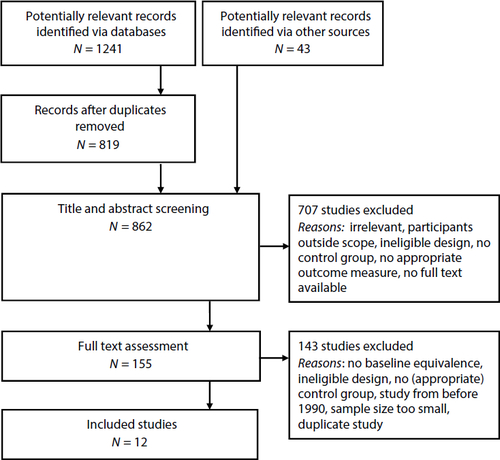
Multiple combinations of key terms, such as “special education placement,” “special education referral,” “effect,” “evaluation,” “experiment,” “program” and “intervention” were used (for example, “program OR intervention AND effect OR impact OR evaluation AND special education referral OR special education placement”). The primary strategy was a computer search of the databases Academic Search Premier, ERIC, PsycINFO, Education Full Text, Education Source, Teacher Reference Center, JSTOR (Education) and ProQuest. This database search resulted in 1241 potentially relevant studies, of which 422 were duplicates, resulting in 819 studies to be screened. Secondly, we hand-searched recent issues of key journals (Appendix A) and the websites of the Institute of Education Sciences (IES), What Works Clearinghouse (WWC), Investing in Innovation (i3) (now Education Innovation and Research), the Education Endowment Foundation (EEF), and Evidence 4 Impact (E4I). Furthermore, possibly relevant studies that were referenced to in studies that were read during the full-text screening phase were evaluated for inclusion as well (snowball strategy). The hand search of the journals did not result in additional studies. 43 studies were found via the snowball strategy and the websites, resulting in 862 potentially relevant studies in total.
Subsequently, the eligibility of the studies for inclusion was examined. A flow diagram of the study selection process is presented in . The first author started with screening the titles and abstract of all 862 potentially relevant studies, resulting in the exclusion of 707 studies that were irrelevant and/or did not meet inclusion criteria. The full text versions of the remaining 155 studies were examined. Of these studies, 123 were excluded after being read by the first author. A common reason for exclusion was the use of an inappropriate control group, as when students in experimental and control conditions differed considerably in terms of pretest scores or demographics, and therefore outcomes were potentially biased. A total of 32 studies were determined to be possibly eligible, and were reviewed by at least two of the authors, who discussed the studies until they arrived at a consensus. The main reason for excluding studies at this stage was a lack of pretest and/or demographics data. The selection process resulted in 12 included studies in total.
Figure 1. Flow diagram of the study selection process.
Categorization
The first step was to categorize the programs described in the included studies according to what they primarily aimed to improve: academic achievement, behavior, or both. Difficulties in these domains are the most common reasons for referral to special education (Institute of Education Sciences & National Center of Education Statistics (IES/NCES), Citation2020). Because of their presumed interrelatedness, some approaches targeted both academic achievement and behavior (Reschly, Citation2014). The second step was to characterize the intensity of the programs. We used the RTI framework for coding whether the programs were targeted at all students (Tier 1), small groups (Tier 2), individual students (Tier 3), or were integrating multiple types of intervention (multi-tiered). A similar step in categorization was used in the reviews of Neitzel et al. (Citation2022) and Stentiford et al. (Citation2018). All assigned codes were verified by at least two authors. Narrative descriptions of the programs are presented in the Results section, aimed at providing a brief overview of programs’ characteristics and their effectiveness in terms of reducing special education referrals and/or placements.
Effect size calculation
To facilitate comparisons across studies, we describe effect sizes (standardized mean differences [SMD]) in this review. As only a few included studies reported effect sizes (Borman & Hewes, Citation2002; Conduct Problems Prevention Research Group (CPPRG), 1999, 2002), we had to estimate the effect sizes for the other studies. We used the procedures described by Lipsey and Wilson (Citation2001) for dichotomized data (in our case: referred or not referred; placed or not placed) (pp. 187–188). This means that the two proportions of referred/placed students in the intervention group and the control group were first arcsine transformed, and then differenced, resulting in estimated effect sizes that are equivalent to the SMD. Because negative numbers indicate better outcomes in the case of referrals or placements, we reversed signs afterwards. So, as is common when reporting effect sizes (Lipsey & Wilson, Citation2001), a positive sign (+) is displayed when the treatment group does better than the control group, and a negative sign (-) is displayed when the treatment group does worse than the control group. A significance level of .05 was used to determine whether effects were significant.
Results
An overview of the included studies can be found in . A total of 12 studies of nine programs were identified that met the inclusion criteria.
Table 1. Included studies.
Summary of study characteristics
All studies were conducted in the United States. Two studies were student randomized experiments, six studies were cluster randomized experiments and four studies were quasi-experiments. Regarding outcome measures, four studies only reported the number of special education placements, three studies only reported the number of special education referrals, and three studies reported both placement and referral data. There were two studies that used time in special education (number of minutes or years in special education) as the outcome measure. Five studies reported results for multiple grades or for multiple points in time. Regarding sample characteristics, we observed that six studies were conducted at predominantly urban schools, and five studies at both urban and rural schools. For one study, there was no information regarding the type of region available. Students with a low socio-economic status were overrepresented in nearly all studies. The student populations were diverse in terms of ethnicity. In most studies, there were no large differences in the percentages of boys and girls. Most studies included all students in certain grades, though some studies focused on specific subgroups (e.g., students with aggressive-disruptive behavior problems or students with low scores on a reading pretest). Sample sizes varied between 84 and 29,569 students. Details for all studies are presented in .
Research question 1: Overview of programs
Summary of program characteristics
Of the nine programs that were reviewed, four targeted both academic achievement and behavior, three targeted only academic achievement, and two targeted only behavior. Most programs (five in total) were multi-tiered, while one Tier 2-program and three Tier 3-programs were evaluated. The programs’ effect sizes ranged from −0.07 to +0.38.
An overview of all programs included in this review is presented below. Per program, we describe: the main elements of the program; the design and participants of the included evaluation study or studies; the effectiveness of the program in terms of reducing special education assignment; and areas for future research.
Programs targeting academic achievement and behavior
Fast Track.
Fast Track is a multi-tiered program that extends from Grade 1 to 10, with the main program concentrations in the first years of elementary school. At Tier 1, the Promoting Alternative Thinking Strategies (PATHS) curriculum (Kusché & Greenberg, Citation1994) is used in Grades 1–5. Classroom teachers receive detailed manuals and ongoing consultation and support from educational consultants (ECs). Additionally, students identified as at high risk for aggressive-disruptive conduct problems receive more intensive interventions, including social skills training provided after school in two-hour sessions led by ECs. At the same time, their parents participate in training groups, led by Family Coordinators (FCs). The frequency of these enrichment sessions is reduced over time from twenty-two sessions in Grade 1 to nine sessions in Grade 5. In addition, FCs conduct home visits to families. At school, all Fast Track students in Grade 1 receive tutoring (focused on phonics) from a paraprofessional three times a week, and they participate in weekly peer pairing sessions aimed at developing positive relationships. Peer support can be extended for students with ongoing social needs. Students in the higher grades (up to Grade 10) who struggle academically can receive support for homework completion.
We included three studies evaluating Fast Track conducted by the Conduct Problems Prevention Research Group (Bierman et al., Citation2013; CPPRG, 1999, 2002). These studies were all based on the same cluster randomized experiment, conducted at fifty-five schools from four demographically diverse districts. The sites were selected as high risk based on crime and poverty statistics. The sample consisted of 891 students, of which 35% had a low-SES background. Boys made up 69% of the sample. 51% of students were African American, 47% European American, and 2% of other ethnicity.
The three studies measured outcomes in slightly different ways and at different points in time. In the CPPRG (1999) study, it was found that first graders in the intervention group spent significantly less time in special education classrooms than first graders in control groups (ES = +0.26, p = .02). An interaction with gender was detected: the program only yielded a significant effect for boys. The CPPRG (2002) study evaluated the impact of Fast Track after three years of implementation and found that students in the intervention group were significantly less likely to receive a special education diagnosis (ES = +0.14, p = .05). Bierman et al. (Citation2013) examined long-term effects and did not find significant effects (p > .05) of Fast Track on special education placements in self-contained classrooms, neither in Grades 1–4 (ES = −0.06) nor in Grades 7–10 (ES = 0.00).
Because the studies concerned the same students, the difference between the Grade 1–3 outcomes of the CPPRG (2002) study and the Grade 1–4 outcomes of the Bierman et al. (Citation2013) study is noteworthy. The difference might be explained by the more narrow criteria that are used in the later study: not all students who have a special education diagnosis are placed in a self-contained classroom, so Fast Track seems to prevent special education assignment for students with mild difficulties only. As the intensity of the Fast Track program reduces after Grade 1, it might be interesting to investigate the effects of an extended version of the program in future research.
The school-based intervention team (SBIT) project
Before considering special education placement, in some schools, school-based intervention teams, or prereferral intervention teams, are designed to provide behavioral and/or instructional support to students who are experiencing problems. This can be considered a Tier 3 strategy. A highly structured and replicable version of this approach, called the SBIT Project, was developed in an urban district in New York and evaluated by McDougal, Clonan, and Martens (Citation2000). This version prescribes teams consisting of six to ten professionals, including at least general and special education teachers and a school psychologist, often complemented with a teaching assistant, social worker, staff development facilitator, and/or a speech and language therapist. The teams usually meet once a week for 45 minutes to one hour and discuss one or two students. This SBIT model is a structured consultative process that uses defined roles for each team member (facilitator, notetaker, case liaison) in each meeting. Teams are required to complete meeting minute forms that script the consultative process. The four steps of the process are problem identification, problem analysis, plan implementation, and plan evaluation, based on the behavioral consultation model of Bergan and Kratochwill (Citation1990).
One study evaluating this specific version of school-based intervention teams (McDougal et al., Citation2000) was included in this review. In this study, four urban schools were supported by a planning team in their implementation of the SBIT Project, aimed at promoting acceptability and long-term adoption of SBIT. The referral rates to special education before and during the first two years of implementation of SBIT were compared with the referral rates at four matched control schools. The full sample consisted of 4722 students, of which 59% were from ethnic minority groups, and 68% received free or reduced lunch.
The reported effects of the SBIT Project are promising: while the pre-SBIT referral rates were comparable between conditions, the post-SBIT referral rates were lower at the schools implementing SBIT (ES = +0.10)Footnote1.
Shortcomings of the study are that statistical significance of the effect is not tested, and that information about the specific intervention(s) used at the student level was not available. To gain a better understanding of the potential of this version of SBIT, more detailed data should be collected in future research. Another recommendation would be to use a randomized design instead of a quasi-experimental design, because self-selection might have played a role in the study.
Success for All (SFA)
A well-known comprehensive school reform program that has served over two million students in the U.S. is Success for All (SFA), originally developed for schools serving large numbers of disadvantaged students (Slavin, Madden, Chambers, & Haxby, Citation2009). SFA is multi-tiered and includes daily 90-minute reading lessons that contain explicit instruction and cooperative learning; frequent assessment; flexible regrouping; tutoring for struggling readers; a program for social and emotional learning called Getting Along Together; and Solutions Teams that address nonacademic issues such as attendance. Teachers and tutors are provided with detailed manuals, and they are supported in their implementation of SFA and professional development by a full-time facilitator employed at the school and a coach employed by the Success for All Foundation (SFAF), who visits the school about once each month.
Two studies evaluating SFA were included in this review. With a quasi-experimental design, Borman and Hewes (Citation2002) investigated SFA’s effects on years spent in special education for students who were exposed to the program in Grades 1–5. We describe the effects for the initially low-achieving subsample, as these students are most likely to be at risk for special education placement, and because baseline equivalence was not demonstrated for the full sample. The subsample contained 444 students from 10 urban schools. Almost all students were African American, and 92% in the intervention group and 93% in the control group received free or reduced lunch. Quint, Zhu, Balu, Rappaport, and DeLaurentis (Citation2015) conducted a large-scale cluster randomized experiment with 19 experimental and 18 control schools (all Title 1), predominantly located in urban areas. In total, 15,854 students participated in the study. 57% received free or reduced lunch. 23% of students were African American, 62% Hispanic, 14% European American and 1% of other ethnicity.
In the study by Borman and Hewes (Citation2002), it was found that students in the SFA condition spent significantly less time in special education during the elementary school years (ES = +0.25, p < .05). Even in middle school, when students had left the program, they spent significantly less time in special education than control students (ES = +0.28, p < .01). These effects were not replicated in the study by Quint et al. (Citation2015). After three years of SFA implementation, no significant impacts (p > .05) on the number of students identified for special education were found (ES = 0.00 for Grade 1, 2, 3 and 5, ES = −0.10 for kindergarten and ES = +0.06 for Grade 4). The researchers did not focus on a specific subgroup for the analysis of special education outcomes. It is important to note that school funding was greatly affected by a recession at the time of the study by Quint et al. (Citation2015). As a result, many schools struggled with implementing tutoring as specified by SFA guidelines, although tutoring is considered a key part of SFA for reducing special education placements.
The difference in design (quasi-experimental vs. randomized) might also explain the difference in findings. Similar to the SBIT study, self-selection could have affected the outcomes of the first SFA study. Future studies of SFA should preferably be randomized experiments in which high implementation fidelity is pursued.
Structure of Intellect (SOI) model schools pilot program/bridges
The multi-tiered Structure of Intellect (SOI) Model Schools Pilot Program, also known as the Bridges program, is a combination of a structured curriculum in the form of daily 15–20 minute classroom modules taught by teachers (Tier 1) and an in-school SOI Learning Center (also known as “Lab”) where students with learning and/or behavioral problems are assessed and treated. Activities in the SOI Learning Center take place twice a week and last 30 minutes. For K-2 students, these activities are provided in a group setting (Tier 2), while students in the higher grades (3–5/6) receive an individual treatment (Tier 3). The program is designed to be completed within 7 months. A school-wide reduction of the number of students referred to special education services is an explicit goal of the SOI Model Schools Pilot Program/Bridges. Materials, training and ongoing support are provided to school staff by Intellectual Development Services (IDS), the program provider.
The SOI Model Schools Pilot Program/Bridges was evaluated in a large-scale quasi-experimental study conducted by McConney, Ayres, Cuthbertson, and Todd-Goodson (Citation2001). The sample consisted of 10,482 students from low- to moderate SES backgrounds. The 34 participating schools were located in both urban and rural areas.
No significant effect (p > .05) of the SOI Model Schools Pilot Program/Bridges on the referral rates for special education assessment was found in either the third year (ES = +0.04) or the fourth year of implementation (ES = −0.07). Variations in implementation fidelity did not seem to affect outcomes.
Since programs based on the SOI theory are still in use in schools, it would be interesting to investigate which changes to the SOI Model Schools Pilot Program/Bridges were made in the past 20 years, and to use a randomized design to evaluate if the current version does lead to improved student outcomes.
Programs targeting academic achievement
Start making a reader today (SMART)
In the SMART tutoring program (Oregon Children’s Foundation, Citation1992), volunteers provide one-to-one tutoring (Tier 3) to struggling readers in Grades 1 and 2. Volunteers are adult community members whose time is usually donated by their employers. The 30-minute tutoring sessions are scheduled twice a week for six months each year. During the sessions, a volunteer and a student read together and discuss the text that is being read. Additionally, students may take home two books each month. SMART is designed as a simple, low cost program, requiring little volunteer training and therefore placing minimal demands on teachers. Volunteers receive a volunteer handbook with effective reading strategies.
Baker et al. (Citation2000) used a student randomized experiment to evaluate SMART. 84 students at risk for reading failure from six Title 1 schools participated in the study. 30% of students were African American, 6% Latino, 47% European American and 16% of other ethnicity.
In the fall of Grade 3, a lower number of referrals for special education evaluation (ES = +0.34) as well as a lower number of actual placements in special education (ES = +0.38) was observed for students in the intervention group, but both effects were non-significant (p > .05).
Power was limited by the relatively small sample size. A replication of the SMART study, with a larger sample, is recommended. Furthermore, it would be interesting to investigate the potential of a more intensive version of SMART, in particular for very low performing students, for whom two sessions a week may not be enough.
Individualizing Student Instruction (ISI)/Assessment to instruction (A2i)
The model of Individualizing Student Instruction (ISI) as described by Connor, Morrison, Fishman, Schatschneider, and Underwood (Citation2007) targets schools serving disadvantaged populations. This ISI model is a multi-tiered RTI model involving classroom instruction (Tier 1) and differentiated small group intervention (Tier 2). Teachers receive materials for beginning literacy instruction in both tiers. Furthermore, Assessment to instruction (A2i) software is provided to teachers, which is designed to help teachers use assessment data to make decisions about instructional amounts, types, and groupings. Teachers working with the ISI/A2i model receive 16 hours of professional development training and bi-weekly in-classroom support (1 hour) from a research partner.
Flynn (Citation2012) dissertation studied the effect of implementing the ISI/A2i program in kindergarten on the special education status of students, using a cluster randomized design. The sample consisted of 551 students from 14 urban schools (50% Title 1 schools). 47% of students received free or reduced lunch. 59% of students were African American, 4% Hispanic, 34% European American and 3% of other ethnicity.
Students were followed to third grade. Treatment conditions in kindergarten did not predict later special education placement (ES = −0.16, p = .301 for kindergarten, ES = −0.07, p = .443 for Grade 1, ES = −0.03, p = .803 for Grade 2, ES = +0.05, p = .491 for Grade 3).
Future studies might want to examine if the ISI/A2i program has a larger impact when the program is also implemented in other grades, instead of only in kindergarten.
Reading Recovery
Reading Recovery (Clay, Citation2016) is a Tier 3 tutoring program that originated in the 1970s in New Zealand and that is now widely used in several English-speaking countries. The program is targeted at the lowest 20–30% achieving first graders and consists of sixty one-to-one 30-minute lessons, provided daily. Lessons contain seven components that are aimed at improving students’ reading and writing skills. Activities are tailored to the needs of individual students. Tutors, who are all certified teachers, receive a high amount of training (75 hours) from expert teacher leaders.
O’Connor and Simic (Citation2002) investigated the effects of Reading Recovery on special education referrals and placements at the end of first grade in a large-scale quasi-experiment. The sample consisted of 4124 students, who were all low-performing in literacy. The majority received free or reduced lunch (84% in the intervention group, 89% in the control group). In the intervention group, 33% of students were African American, 36% Hispanic, 17% European American and 14% of other ethnicity. In the control group, 39% of students were African American, 37% Hispanic, 14% European American and 10% of other ethnicity.
It was found that in the intervention group, significantly fewer students were referred for special education testing (ES = +0.16, p < .0001), and also significantly fewer students were placed in special education (ES = +0.17, p < .0001).
Evaluating Reading Recovery with a randomized design and including long-term outcomes is recommended for future research. It would also be interesting to investigate if a less costly version of the program could produce similar effects, so that more students could be served.
Programs targeting behavior
PBISplus
Within the multi-tiered PBISplus model, the School-Wide Positive Behavioral Interventions and Supports (SWPBIS) program (Sugai & Horner, Citation2006) at Tier 1 is integrated with Tier 2 strategies. To better support students who are not responding adequately to the Tier 1 instruction (in which appropriate behaviors are taught and acknowledged), staff and student support teams (SSTs), consisting of four to five members, receive external Tier 2 coaching on applying functional behavioral assessment. Furthermore, staff members are trained in the student support teaming process, culturally responsive practices, and the use of targeted interventions such as Check-in/Check-out (CI/CO; Hawken & Horner, Citation2003), that help to provide students with feedback on their behavior. The coaching services consisted of a two-day initial training, an annual one-day booster session, and on-site assistance.
In a cluster randomized experiment containing 29,569 students, Bradshaw, Pas, Goldweber, Rosenberg, and Leaf (Citation2012) examined the effects of PBISplus on the number of students referred for special education assessment, and on the number of students receiving special education services over the course of three school years. Control schools only used the universal SWPBIS model. 43% of students in the sample received free or reduced lunch. 54% of students were African American, 8% Hispanic, 33% European American and 5% of other ethnicity.
Over time, no significant effect (p > .05) on the number of referrals was found, but significantly fewer students (p = .03) were receiving special education services in the PBISplus condition. The information needed to calculate effect sizes was not available.
More research is needed to explain the difference in referrals and placements in this sample. Furthermore, for future research it would be interesting to compare schools using PBISplus with schools that do not use SWPBIS, to gain more insight into the added value of the Tier 2 strategies.
Families and Schools Together (FAST)
The Families and Schools Together (FAST) program primarily targets schools around the world that serve low-income communities. FAST aims to establish close relationships between families and schools through multi-family support group meetings that take place after school. The Tier 2 program is relatively short, as it covers eight weekly meetings that each last approximately 2.5 hours. Positive interactions between children, parents, and peers are stimulated by a FAST team, usually consisting of a teacher, a mental health professional, an alcohol or drugs professional, and a parent liaison who has graduated from the FAST program. Before a family starts with FAST, a home visitation is conducted by a FAST team member. The FAST team members are trained by a certified FAST trainer.
In a study by Kratochwill, McDonald, Levin, Scalia, and Coover (Citation2009), 134 students with emotional and/or behavioral problems from eight urban schools were randomly assigned to either the experimental or the control condition. The ethnicity of the students was 40% European American, 35% African American, 12% Latino and 13% Asian. Students were primarily from low-income backgrounds.
Only one of the 67 FAST students was referred for special education and was identified with serious emotional disabilities (SED), while four students in the control condition were identified with SED (ES = +0.30). These numbers were too small to determine whether the effect was significant.
A large-scale replication of the study is recommended. In future studies, it would also be interesting to investigate how FAST can be aligned with other strategies within a multi-tiered model.
Research question 2: Overview of common elements of programs deemed effective
To answer the second research question, we examined the common elements of programs deemed effective. Because of the small number of included studies, and because of the aforementioned limitations of some studies, we are reluctant to classify programs as “effective” or “not effective,” so we discuss programs that are deemed effective. Some noteworthy patterns were observed.
Tutoring
At first, it is interesting to note that the programs that were associated with positive outcomes on reducing special education assignment for learning problems had a strong emphasis on tutoring. Reading Recovery and SMART are purely tutoring programs, and both had notable impacts on special education referrals and placements. Success for All emphasizes tutoring, and a study (Borman & Hewes, Citation2002) that provided a great deal of one-to-one tutoring to struggling readers in Grades 1–3 had a substantial impact on assignments to special education, not only through elementary school but into middle school as well. A second study (Quint et al., Citation2015) provided few tutors, and did not show effects on reducing special education placements. Fast Track provides tutoring in first grade only, and at the end of first grade there were significant impacts on special education assignment. Smaller effects were seen in a study that included Grades 1–3, and no effects were seen in later grades, even though the other aspects of the program (but not tutoring) continued to tenth grade. The small number and substantial diversity of the studies included in this review make it impossible to definitively state that tutoring is a necessary or sufficient means of reducing special education placements for learning problems, but the pattern of results is supportive of this link, and in line with other reviews reporting substantial effects of tutoring (Dietrichson, Bøg, Filges, & Klint Jørgensen, Citation2017; Gersten, Haymond, Newman-Gonchar, Dimino, & Jayanthi, Citation2020; Neitzel et al., Citation2022; Nickow, Oreopoulos, & Quan, Citation2020; Wanzek et al., Citation2016).
Professional development
Another common effective element of the programs deemed effective is an emphasis on professional development. With the exception of SMART, the programs included a great deal of training and coaching of involved staff members. Professional development is also considered an important factor by Durlak and DuPre (Citation2008), Fuchs and Vaughn (Citation2012) and Hughes and Dexter (Citation2011).
Parental involvement
Furthermore, we observed that Fast Track, Success for All, Families and Schools Together, and SMART all included elements regarding parental involvement. This finding is in line with other studies demonstrating positive impacts of parental involvement on children’s academic achievement and behavior (Boonk, Gijselaers, Ritzen, & Brand‐Gruwel, Citation2018; Castro et al., Citation2015; El Nokali, Bachman, & Votruba-Drzal, Citation2010).
Tiers
Regarding the tiers of intervention, our results are inconclusive about which scope is most effective. Programs deemed effective were multi-tiered programs as well as Tier 2 and Tier 3 programs. However, prior research indicates that it is important to support struggling students with additional interventions that are aligned with the classroom program (Neitzel et al., Citation2022; Stentiford et al., Citation2018), which could be facilitated by the use of multi-tiered programs.
Discussion
The current study aimed to answer the following research questions: “1. What is known about the effectiveness of programs that potentially reduce the number of students assigned to special education?” and “2. What are common elements of programs that reduce the number of students assigned to special education?” Overall, the magnitude of the effects we observed ranged from a very small negative effect (−0.07) to a relatively large positive effect (+0.38). Although these effects are inconsistent, they can have major consequences, given the large numbers of students who are currently in special education (Institute of Education Sciences & National Center of Education Statistics (IES/NCES), Citation2020). We can conclude that the programs included in this review showed large variation in terms of intensity, approach, and targeted skills, and also differed in terms of effectiveness in reducing the number of special educations referrals and/or placements. Significant positive effects were found for Reading Recovery and PBISplus, though both programs were only evaluated in one experimental or quasi-experimental study. The programs that were evaluated in multiple studies and/or at different points in time, Fast Track and Success for All (SFA), demonstrated significant positive effects on some, but not on all measures of special education assignment that were reported. Furthermore, we want to highlight Start Making A Reader Today (SMART) and Families and Schools Together (FAST) as promising approaches given the effect sizes, but the programs were only evaluated in small-scale studies and statistical significance was not demonstrated. We also conclude that the School-Based Intervention Teams (SBIT) model as evaluated by McDougal et al. (Citation2000) seems to have potential to reduce special education assignments, although it was not clear whether the observed decrease in referrals was significant in the included study. Although many studies on SBIT have been conducted in the past (see also Burns & Symington, Citation2002; Schrag & Henderson, Citation1996), only one study published after 1990 met our inclusion criteria with regard to research design. Because many schools still implement programs based on SBIT (Truscott, Cohen, Sam, Sanborn, & Frank, Citation2005), more rigorous evaluation studies are needed, in which attention is not only paid to the actions of the team itself, but also to the actual support students receive. Based on the studies included in this review, the Structure of Intellect (SOI) Model Schools Pilot Program/Bridges, as implemented in the study of McConney et al. (Citation2001), and the Individualizing Student Instruction (ISI)/Assessment to Instruction (A2i) program as implemented in the study of Flynn (Citation2012) did not seem to be effective in reducing special education assignments.
Regarding the second research question, we concluded that programs deemed effective share some common elements. Students with learning problems benefit from programs that include tutoring, i.e., intensified instruction adapted to student’s needs. We also observed that programs deemed effective placed emphasis on professional development, by providing training and coaching alongside materials. The third common element we observed was an emphasis on parental involvement, in order to create a supportive environment for the child. These findings are in line with prior research on characteristics of effective programs.
Limitations and directions for future research
A limitation of this review is the small number of included studies (12). Therefore, the results should be interpreted with caution. By choosing to narrow our search to high-quality experimental and quasi-experimental studies that reported referral or placement data, we might have missed promising programs. The number of programs that improve students’ learning and/or behavior, and as a result reduce the need for special education, may be much larger. The lack of significant results may have several explanations other than failure of program theory (Jacob, Doolittle, Kemple, & Somers, Citation2019). We reviewed some programs that may take on different forms in other schools and/or states, namely programs that are based on the ideas of SBIT, SOI and ISI. As the terminology can refer to a variety of practices, it is possible that other forms of these programs are more effective. This argues for detailed program descriptions in future studies, so readers are able to correctly interpret results of specific forms of programs. Furthermore, it is possible that the programs described here that were not found to be effective were just not implemented well enough. It is known that the level of implementation is strongly related to program outcomes (Durlak & DuPre, Citation2008), though implementation fidelity is rarely adequately described in evaluation studies (Capin, Walker, Vaughn, & Wanzek, Citation2018).
Another possible reason for the absence of significant effects in some studies might be limited power. The risk of being referred to special education only applies to a subset of students. So, in studies evaluating the effects of a program for the total student population, large sample sizes are needed to detect changes in special education assignment. We recommend including measures of implementation as well as measures of special education assignment in rigorous evaluation studies more often, so the research base on this topic will be expanded, and eventually more insight will be obtained in what works for whom and under what conditions. Preferably, these future studies would make use of actual placement data, rather than referral rates. Although it seems that most referred students are subsequently placed in special education (Baker et al., Citation2000; Hibel et al., Citation2010; Hosp & Reschly, Citation2003), including both referral and placement data—as we did—might potentially result in overcounting students. We also included two studies that used the time students were in special education as an outcome measure, which in itself is commendable because it provides more nuanced data than the “placed or not placed” dichotomy, but is a limitation in terms of comparability.
Another limitation of this study is that the initial screening of studies was conducted by one author. Although the jointly formulated inclusion criteria and review protocol set clear boundaries, it is possible that judgments vary from coder to coder (Lipsey & Wilson, Citation2001). While multiple authors were involved in confirming included studies, so that included studies have been agreed to by multiple authors, it is possible a study that was excluded at an earlier stage (by a single author) may have been excluded in error, resulting in a smaller sample of included studies. An additional author has checked a subsample of these excluded studies, and has not found any that were mistakenly excluded, reducing the concern for bias, but this remains a limitation of this study. For future studies, we recommend having at least two authors review some potentially relevant studies and determining interrater reliability before continuing the selection process.
Although studies eligible for inclusion could be conducted in any OECD country, we ended up with only U.S.-based studies. An advantage of describing only studies from the U.S. is that this adds to comparability. In the field of special education, differences between local systems can be large, which is a complicating factor for comparisons (D’Alessio & Watkins, Citation2009). For this reason, the relevance of our findings for other countries may be limited. Still, even for readers outside the U.S., it is valuable to use the insights from this review to critically reflect on local special education placement practices. Furthermore, some effective or at least promising programs described in this review (Fast Track, Success for All, Reading Recovery, Families and Schools Together) are also disseminated to other countries. In future studies, it would be interesting to examine if these programs produce similar benefits in other contexts.
We want to point out that the studies included in this review were published between 1999 and 2015; a time span over which policies and practices regarding special education and inclusion have changed, such as the revision of the IDEA in 2004 resulting in more emphasis on the prevention of mild disabilities. Nevertheless, over the years the proportion of students in special education settings did not decline (Institute of Education Sciences & National Center of Education Statistics (IES/NCES), Citation2020). It would be useful to further investigate the influence of policies on the numbers of students assigned to special education, preferably analyzed for different special education categories. Furthermore, future studies could attempt to measure the accuracy of special education placements, providing more insight into the actual number of “false positives” in special education.
Implications for practice
We would like to end this discussion with some implications for educational practice. We acknowledge that supporting students with learning and/or behavioral difficulties in schools for general education can be demanding for teachers and other staff members. The effective programs described in this review, as well as those described in other reviews regarding struggling students (e.g., Neitzel et al., Citation2022; Reschly, Citation2010), are no “quick fixes.” Moreover, even when a program involves multiple tiers and addresses multiple issues, there are still other factors involved with placement decisions. Examples of influential contextual factors are cooperative practices among teachers, “frog-pond” effects within classes and schools, and societal norms regarding students with disabilities (Ferguson, Citation2008; Hibel et al., Citation2010; Kirby, Citation2017; Manset-Williamson et al., Citation2002).
There are plentiful situations in which a special education placement is the best option for a student, especially in educational systems where a special education status grants access to more intensive types of intervention. Unfortunately, research has shown that many students in special education may also experience negative consequences of their status (Ballis & Heath, Citation2021b; Barrat et al., Citation2014; Clark, Citation1997; Jepma, Citation2003; Morgan et al., Citation2010; Peetsma et al., Citation2001; Pit-ten Cate & Glock, Citation2018; Powell, Citation2006; Shifrer, Citation2013; Valås, 2001; Young et al., Citation2002). We need to ensure that students who are placed in special education cannot be served any other way. In this study, we found that the number of students in special education could probably be reduced by providing effective programs prior to special education referral and placement. For students with learning difficulties, we found that tutoring seems to be a key factor in preventing special education assignment. Also for students with behavioral difficulties, the included studies suggest that intensified intervention in general education can prevent the need for special education services. Furthermore, we observed that most programs deemed effective placed emphases on professional development of staff and on parental involvement.
This review indicates that preventing special education assignment is possible for many students in high-incidence categories of special education, by means of effective support at an early stage.
Disclosure statement
No potential conflict of interest was reported by the authors.
Notes
1 To calculate the proportions and effect size, we assumed that student enrollment stayed the same over the years.
2 *Studies included in the review.
References
- Apling, R. N. (2001). Individuals with Disabilities Education Act (IDEA): Identification and misidentification of children with disabilities. Retrieved from https://digital.library.unt.edu/ark:/67531/metadc819478/.
- ∗Baker, S., Gersten, R., & Keating, T. (2000). When less may be more: A 2-year longitudinal evaluation of a volunteer tutoring program requiring minimal training. Reading Research Quarterly, 35(4), 494–519. doi:10.1598/RRQ.35.4.3
- Ballis, B., & Heath, K. (2021a). The long-run impacts of special education. American Economic Journal: Economic Policy, 13(4), 72–111. doi:10.1257/pol.20190603
- Ballis, B., & Heath, K. (2021b). Direct and spillover effects of limiting minority student access to special education. (EdWorkingPaper, 21-364). Retrieved from Annenberg Institute at Brown University. doi:10.26300/m2m5-0t83
- Barrat, V. X., Berliner, B., Voight, A., Tran, L., Huang, C., Yu, A., & Chen-Gaddini, M. (2014). School mobility, dropout, and graduation rates across student disability categories in Utah. Washington, DC: U.S. Department of Education, Institute of Education Sciences, National Center for Education Evaluation and Regional Assistance, Regional Educational Laboratory West.
- Bergan, J. R., & Kratochwill, T. R. (1990). Behavioral consultation and therapy. New York, NY: Plenum.
- ∗Bierman, K. L., Coie, C., Dodge, K., Greenberg, M., Lochman, J., McMohan, R., & Pinderhughes, E. (2013). School outcomes of aggressive-disruptive children: Prediction from kindergarten risk factors and impact of the Fast Track Prevention Program. Aggressive Behavior, 39(2), 114–130. doi:10.1002/ab.21467
- Boonk, L., Gijselaers, H. J. M., Ritzen, H., & Brand‐Gruwel, S. (2018). A review of the relationship between parental involvement indicators and academic achievement. Educational Research Review, 24, 10–30. doi:10.1016/j.edurev.2018.02.001
- ∗Borman, G. D., & Hewes, G. M. (2002). The long-term effects and cost-effectiveness of success for all. Educational Evaluation and Policy Analysis, 24(4), 243–266. doi:10.3102/01623737024004243
- ∗Bradshaw, C. P., Pas, E. T., Goldweber, A., Rosenberg, M. S., & Leaf, P. J. (2012). Integrating school-wide positive behavioral interventions and supports with tier 2 coaching to student support teams: The PBISplus model. Advances in School Mental Health Promotion, 5(3), 177–193. doi:10.1080/1754730X.2012.707429
- Burns, M. K., Appleton, J. J., & Stehouwer, J. D. (2005). Meta-analytic review of responsiveness-to-intervention research: Examining field-based and research-implemented models. Journal of Psychoeducational Assessment, 23(4), 381–394. doi:10.1177/073428290502300406
- Burns, M. K., & Symington, T. (2002). A meta-analysis of prereferral intervention teams: Student and systemic outcomes. Journal of School Psychology, 40(5), 437–447. doi:10.1016/S0022-4405(02)00106-1
- Bursuck, B., & Blanks, B. (2010). Evidence-based early reading practices within a response to intervention system. Psychology in the Schools, 47(5), 421–431. doi:10.1002/pits.20480
- Capin, P., Walker, M. A., Vaughn, S., & Wanzek, J. (2018). Examining how treatment fidelity is supported, measured, and reported in K–3 reading intervention research. Educational Psychology Review, 30(3), 885–919. doi:10.1007/s10648-017-9429-z
- Castro, M., Expósito‐Casas, E., López‐Martín, E., Lizasoain, L., Navarro‐Asencio, E., & Gaviria, J. L. (2015). Parental involvement on student academic achievement: A meta-analysis. Educational Research Review, 14, 33–46. doi:10.1016/j.edurev.2015.01.002
- Cheung, A. C., & Slavin, R. E. (2016). How methodological features affect effect sizes in education. Educational Researcher, 45(5), 283–292. doi:10.3102/0013189X16656615
- Clark, M. D. (1997). Teacher response to learning disability: A test of attributional principles. Journal of learning disabilities, 30(1), 69–79. doi:10.1177/002221949703000106
- Clay, M. M. (2016). Literacy lessons designed for individuals. Portsmouth, NH: Heinemann Educational Books Inc.
- ∗Conduct Problems Prevention Research Group (CPPRG). (1999). Initial impact of the Fast Track prevention trial for conduct problems: I. The high-risk sample. Journal of Consulting and Clinical Psychology, 67(5), 631–647. doi:10.1037/0022-006x.67.5.631
- ∗Conduct Problems Prevention Research Group (CPPRG). (2002). Evaluation of the first 3 years of the Fast Track prevention trial with children at high risk for adolescent conduct problems. Journal of Abnormal Child Psychology, 30(1), 19–35. doi:10.1023/A:1014274914287
- Connor, C. M., Morrison, F. J., Fishman, B. J., Schatschneider, C., & Underwood, P. (2007). The early years: Algorithm-guided individualized reading instruction. Science (New York, N.Y.), 315(5811), 464–465. doi:10.1126/science.1134513
- Cortiella, C., & Horowitz, S. H. (2014). The state of learning disabilities: Facts, trends and emerging issues. Washington, DC: National Center for Learning Disabilities.
- Cottrell, J. M., & Barrett, C. A. (2016). Defining the undefinable: Operationalization of methods to identify specific learning disabilities among practicing school psychologists. Psychology in the Schools, 53(2), 143–157. doi:10.1002/pits.21892
- D’Alessio, S., & Watkins, A. (2009). International comparisons of inclusive policy and practice: Are we talking about the same thing? Research in Comparative and International Education, 4(3), 233–249. doi:10.2304/rcie.2009.4.3.233
- De Boer, H., Timmermans, A. C., & Van der Werf, M. P. C. (2018). The effects of teacher expectation interventions on teachers’ expectations and student achievement: Narrative review and meta-analysis. Educational Research and Evaluation, 24(3-5), 180–200. doi:10.1080/13803611.2018.1550834
- Dietrichson, J., Bøg, M., Filges, T., & Klint Jørgensen, A. M. (2017). Academic interventions for elementary and middle school students with low socioeconomic status: A systematic review and meta-analysis. Review of Educational Research, 87(2), 243–282. doi:10.3102/0034654316687036
- Durlak, J. A., & DuPre, E. (2008). Implementation matters: A review of research on the influence of implementation on program outcomes and the factors affecting implementation. American Journal of community psychology, 41(3-4), 327–350. doi:10.1007/s10464-008-9165-0
- El Nokali, N. E., Bachman, H. J., & Votruba-Drzal, E. (2010). Parent involvement and children’s academic and social development in elementary school. Child Development, 81(3), 988–1005. doi:10.1111/j.1467-8624.2010.01447.x
- Ferguson, D. L. (2008). International trends in inclusive education: The continuing challenge to teach each one and everyone. European Journal of Special Needs Education, 23(2), 109–120. doi:10.1080/08856250801946236
- Fletcher, J. M., Coulter, W. A., Reschly, D. J., & Vaughn, S. (2004). Alternative approaches to the definition and identification of learning disabilities: Some questions and answers. Annals of dyslexia, 54(2), 304–331. doi:10.1007/s11881-004-0015-y
- ∗Flynn, K. S. (2012). Stability of special education eligibility from kindergarten to third grade: Are there variables from fall of kindergarten that predict later classification status? (Doctoral dissertation). Florida State University, ProQuest Dissertations & Theses Global.
- Fuchs, D., & Fuchs, L. S. (2006). Introduction to response to intervention: What, why, and how valid is it? Reading Research Quarterly, 41(1), 93–99. doi:10.1598/RRQ.41.1.4
- Fuchs, L. S., Fuchs, D., & Hollenbeck, K. N. (2007). Extending responsiveness to intervention to mathematics at first and third grades. Learning Disabilities Research & Practice, 22(1), 13–24. doi:10.1111/j.1540-5826.2007.00227.x
- Fuchs, L. S., Fuchs, D., & Malone, A. S. (2016). Multilevel response-to-intervention prevention systems: Mathematics intervention at Tier 2. In S. R. Jimerson, M. K. Burns, & A. M. VanDerHeyden (Eds.), Handbook of response to intervention: The science and practice of multi-tiered systems of support (2nd ed., pp. 309–328). New York, NY: Springer.
- Fuchs, L. S., & Vaughn, S. (2012). Responsiveness-to-intervention: A decade later. Journal of learning disabilities, 45(3), 195–203. doi:10.1177/0022219412442150
- Gersten, R., Clarke, B., & Mazzocco, M. M. (2007). Historical and contemporary perspectives on mathematical learning disabilities. In M. M. M. Mazzocco & D. B. Berch (Eds.), Why is math so hard for some children? The nature and origins of mathematical learning difficulties and disabilities. Baltimore, MD: Paul H. Brookes Pub. Co.
- Gersten, R., Haymond, K., Newman-Gonchar, R., Dimino, J., & Jayanthi, M. (2020). Meta-analysis of the impact of reading interventions for students in the primary grades. Journal of Research on Educational Effectiveness, 13(2), 401–427. doi:10.1080/19345747.2019.1689591
- Hagans, K. S., & Good, R. H. (2013). Decreasing reading differences in children from disadvantaged backgrounds: The effects of an early literacy intervention. Contemporary School Psychology, 17(1), 103–117. doi:10.1007/BF03340992
- Hawken, L. S., & Horner, R. H. (2003). Implementing a targeted group intervention within a schoolwide system of behavior support. Journal of Behavioral Education, 12(3), 225–240. doi:10.1023/A:1025512411930
- Hettleman, K. R. (2019). Mislabeled as disabled: The educational abuse of struggling learners and how we can fight it. New York, NY: Radius Book Group.
- Hibel, J., Farkas, G., & Morgan, P. L. (2010). Who is placed into special education? Sociology of education, 83(4), 312–332. doi:10.1177/0038040710383518
- Hoover, J. (2010). Special education eligibility decision making in response to intervention models. Theory Into Practice, 49(4), 289–296. doi:10.1080/00405841.2010.510752
- Hosp, J. L., & Reschly, D. J. (2003). Referral rates for intervention or assessment: A meta-analysis of racial differences. The Journal of Special Education, 37(2), 67–80. doi:10.1177/00224669030370020201
- Hughes, C. A., & Dexter, D. D. (2011). Response to Intervention: A research-based summary. Theory Into Practice, 50(1), 4–11. doi:10.1080/00405841.2011.534909
- Jacob, R. T., Doolittle, F., Kemple, J., & Somers, M.-A. (2019). A framework for learning from null results. Educational Researcher, 48(9), 580–589. doi:10.3102/0013189X19891955
- Institute of Education Sciences, National Center of Education Statistics (IES/NCES). (2020). Digest of education statistics table 204.30. Retrieved from https://nces.ed.gov/programs/digest/d20/tables/dt20_204.30.asp.
- Jepma, I. (2003). De schoolloopbaan van risicoleerlingen in het primair onderwijs. [The school careers of pupils at risk in primary education]. (Doctoral dissertation). Universiteit van Amsterdam, UvA Digital Academic Repository. https://hdl.handle.net/11245/1.270758.
- Kirby, M. (2017). Implicit assumptions in special education policy: Promoting full inclusion for students with learning disabilities. Child & Youth Care Forum, 46(2), 175–191. doi:10.1007/s10566-016-9382-x
- ∗Kratochwill, T. R., McDonald, L., Levin, J. R., Scalia, P. A., & Coover, G. (2009). Families and schools together: An experimental study of multi-family support groups for children at risk. Journal of school psychology, 47(4), 245–265. doi:10.1016/j.jsp.2009.03.001
- Kusché, C. A., & Greenberg, M. T. (1994). The PATHS curriculum. Seattle, WA: Developmental Research and Programs.
- Lembke, E. S., Hampton, D., & Beyers, S. J. (2012). Response to intervention in mathematics: Critical elements. Psychology in the Schools, 49(3), 257–272. doi:10.1002/pits.21596
- Lipsey, M. W., & Wilson, D. B. (2001). Practical meta-analysis. Thousand Oaks, CA: SAGE Publications, Inc.
- Lockwood, A. B., Farmer, R. L., Winans, S., & Sealander, K. (2021). Specific learning disability identification practices in the USA: A survey of special education administrators. Contemporary School Psychology. doi:10.1007/s40688-021-00375-4
- Maki, K. E., & Adams, S. R. (2019). A current landscape of specific learning disability identification: Training, practices, and implications. Psychology in the Schools, 56(1), 18–31. doi:10.1002/pits.22179
- Maki, K. E., & Adams, S. R. (2020). Specific learning disabilities identification: Do the identification methods and data matter? Learning Disability Quarterly, 43(2), 63–74. doi:10.1177/0731948719826296
- Maki, K. E., Floyd, R. G., & Roberson, T. (2015). State learning disability eligibility criteria: A comprehensive review. School Psychology Quarterly, 30(4), 457–469. doi:10.1037/spq0000109
- Manset-Williamson, G., St. John, E., Hu, S., & Gordon, D. (2002). Early literacy practices as predictors of reading related outcomes: Test scores, test passing rates, retention, and special education referral. Exceptionality, 10(1), 11–28. doi:10.1207/S15327035EX1001_2
- Martin, R. P., Foels, P., Clanton, G., & Moon, K. (2004). Season of birth is related to child retention rates, achievement, and rate of diagnosis of specific LD. Journal of learning disabilities, 37(4), 307–317. doi:10.1177/00222194040370040301
- ∗McConney, A., Ayres, R., Cuthbertson, L., & Todd-Goodson, D. (2001). Third party evaluation of the effectiveness of the Structure of Intellect model schools pilot program. Year 4 evaluation report. Monmouth, OR: Western Oregon University.
- ∗McDougal, J. L., Clonan, S. M., & Martens, B. K. (2000). Using organizational change procedures to promote the acceptability of prereferral intervention services: The school-based intervention team project. School Psychology Quarterly, 15(2), 149–171. doi:10.1037/h0088783
- Morgan, P. L., Frisco, M. L., Farkas, G., & Hibel, J. (2010). A propensity score matching analysis of the effects of special education services. The Journal of special education, 43(4), 236–254. doi:10.1177/0022466908323007
- Neitzel, A. J., Lake, C., Pellegrini, M., & Slavin, R. E. (2022). A synthesis of quantitative research on programs for struggling readers in elementary schools. Reading Research Quarterly, 57(1), 149–179. doi:10.1002/rrq.379
- NESSE. (2012). Education and disability/special needs: Policies and practices in education, training and employment for students with disabilities and special educational needs in the EU. Brussels: European Commission.
- Nickow, A., Oreopoulos, P., & Quan, V. (2020). The impressive effects of tutoring on preK-12 learning: A systematic review and meta-analysis of the experimental evidence. (No. w27476). p. w27476. National Bureau of Economic Research. doi:10.3386/w27476
- ∗O’Connor, E. A., & Simic, O. (2002). The effect of Reading Recovery on special education referrals and placements. Psychology in the Schools, 39(6), 635–646. doi:10.1002/pits.10061
- Oregon Children’s Foundation. (1992). SMART volunteer handbook. Portland, OR: Oregon Children’s Foundation.
- Peetsma, T. T. D., Vergeer, M. M., Roeleveld, J., & Karsten, S. (2001). Inclusion in education: Comparing pupils’ development in special and regular education. Educational Review, 53(2), 125–135. doi:10.1080/00131910125044
- Pigott, T. D., & Polanin, J. R. (2020). Methodological guidance paper: High-quality meta-analysis in a systematic review. Review of Educational Research, 90(1), 24–46. doi:10.3102/0034654319877153
- Pit-ten Cate, I. M., & Glock, S. (2018). Teacher expectations concerning students with immigrant backgrounds or special educational needs. Educational Research and Evaluation, 24(3-5), 277–294. doi:10.1080/13803611.2018.1550839
- Polanin, J. R., Tanner-Smith, E. E., & Hennessy, E. A. (2016). Estimating the difference between published and unpublished effect sizes: A meta-review. Review of Educational Research, 86(1), 207–236. doi:10.3102/0034654315582067
- Powell, J. J. W. (2006). Special education and the risk of becoming less educated. European Societies, 8(4), 577–599. doi:10.1080/14616690601002673
- ∗Quint, J., Zhu, P., Balu, R., Rappaport, S., & DeLaurentis, M. (2015). Scaling up the Success for All model of school reform: Final report from the investing in innovation (i3) evaluation. New York, NY: MDRC.
- Ramberg, J., & Watkins, A. (2020). Exploring inclusive education across Europe: Some insights from the European Agency Statistics on Inclusive Education. FIRE: Forum for International Research in Education, 6(1), 85–101. doi:10.32865/fire202061172
- Reschly, A. L. (2010). Reading and school completion: Critical connections and Matthew effects. Reading & Writing Quarterly, 26(1), 67–90. doi:10.1080/10573560903397023
- Reschly, D. J. (2014). Response to Intervention and the identification of specific learning disabilities. Topics in Language Disorders, 34(1), 39–58. doi:10.1097/TLD.0000000000000003
- Schrag, J. A., & Henderson, K. (1996). School-based intervention assistance teams and their impact on special education. Alexandria, VA: National Association of State Directors of Special Education.
- Shifrer, D. (2013). Stigma of a Label: educational expectations for high school students labeled with learning disabilities. Journal of health and social behavior, 54(4), 462–480. doi:10.1177/0022146513503346
- Slavin, R. E. (1986). Best-evidence synthesis: An alternative to meta-analytic and traditional reviews. Educational Researcher, 15(9), 5–11. doi:10.3102/0013189X015009005
- Slavin, R. E. (2018). Learners with exceptionalities. In R. E. Slavin (Ed.), Educational psychology: Theory and practice (12th ed.). Upper Saddle River, NJ: Pearson.
- Slavin, R. E., Madden, N. A., Chambers, B., & Haxby, B. (2009). 2 million children: Success for All (2nd ed.). Thousand Oaks, CA: Corwin Press.
- Slavin, R. E., Neitzel, A., Pellegrini, M., & Lake, C. (2019). Response to proven intervention (RTPI): Enabling struggling learners. Best Evidence Encyclopedia. https://bestevidence.org/category/special-and-remedial-education/.
- Stentiford, L., Koutsouris, G., & Norwich, B. (2018). A systematic literature review of the organisational arrangements of primary school-based reading interventions for struggling readers. Journal of Research in Reading, 41(1), S197–S225. doi:10.1111/1467-9817.12264
- Sugai, G., & Horner, R. (2006). A promising approach for expanding and sustaining school-wide positive behavior support. School Psychology Review, 35(2), 245–259. doi:10.1080/02796015.2006.12087989
- Sullivan, A. L., & Bal, A. (2013). Disproportionality in special education: Effects of individual and school variables on disability risk. Exceptional Children, 79(4), 475–494. doi:10.1177/001440291307900406
- Truscott, S. D., Cohen, C. E., Sam, D. P., Sanborn, K. J., & Frank, A. J. (2005). The current state(s) of prereferral intervention teams: A report from two national surveys. Remedial and Special Education, 26(3), 130–140. doi:10.1177/07419325050260030101
- Vaughn, S., & Linan-Thompson, S. (2003). What is special about special education for studentswith learning disabilities? The Journal of Special Education, 37(3), 140–147. doi:10.1177/00224669030370030301
- Wallingford, E. L., & Thompson Prout, H. (2000). The relationship of season of birth and special education referral. Psychology in the Schools, 37(4), 379–387. doi:10.1002/1520-6807(200007)37:4 < 389::aid-pits9 > 3.0.co;2-k
- Wanzek, J., & Vaughn, S. (2007). Research-based implications from extensive early reading interventions. School Psychology Review, 36(4), 541–561. doi:10.1080/02796015.2007.12087917
- Wanzek, J., Vaughn, S., Scammacca, N., Gatlin, B., Walker, M. A., & Capin, P. (2016). Meta-analyses of the effects of tier 2 type reading interventions in grades K-3. Educational Psychology Review, 28(3), 551–576. doi:10.1007/s10648-015-9321-7
- What Works Clearinghouse. (2020). What works clearinghouse standards handbook, Version 4.1. https://ies.ed.gov/ncee/wwc/handbooks.
- Valås, H. (2001). Learned helplessness and psychological adjustment II: Effects of learning disabilities and low achievement. Scandinavian Journal of Educational Research, 45(2), 101–114. doi:10.1080/00313830020042689
- Young, A. R., Beitchman, J. H., Johnson, C., Douglas, L., Atkinson, L., Escobar, M., & Wilson, B. (2002). Young adult academic outcomes in a longitudinal sample of early identified language impaired and control children. Journal of child psychology and psychiatry, and allied disciplines, 43(5), 635–645. doi:10.1111/1469-7610.00052
Appendix A
Recent issues (1999–2019) of the following journals were hand searched:
Advances in School Mental Health Promotion
Aggressive Behavior
Assessment for Effective Intervention
Behavior Modification
Educational Evaluation and Policy Analysis
Educational Psychology
European Journal of Special Needs Education
Exceptional Children
Exceptionality
Journal of Abnormal Child Psychology
Journal of Child Psychology and Psychiatry
Journal of Consulting and Clinical Psychology
Journal of Education for Students Placed at Risk
Journal of Educational Psychology
Journal of Learning Disabilities
Journal of Research in Special Educational Needs
Journal of Research on Educational Effectiveness
Journal of School Psychology
Journal of Special Education
Learning Disability Quarterly
Psychology in the Schools
Reading Research Quarterly
Remedial and Special Education
Review of Educational Research
School Psychology Quarterly
School Psychology Review
The Elementary School Journal
The Journal of Educational Research
Theory into Practice