
 ?Mathematical formulae have been encoded as MathML and are displayed in this HTML version using MathJax in order to improve their display. Uncheck the box to turn MathJax off. This feature requires Javascript. Click on a formula to zoom.
ABSTRACT
Purpose
Recent research on the potential of using eye-tracking to measure reading comprehension ability suggests that the relationship between standard eye-tracking measures and reading comprehension is influenced by differences in task demands between comprehension assessments. We compared standard eye-tracking measures and scanpath regularity as predictors of reading comprehension scores.
Method
We used a dataset in which 79 participants (mean age: 22 years, 82% females, 76% monolingual English speakers) were administered three widely-used reading comprehension assessments with varying task demands while their eye movements were monitored: the York Assessment of Reading for Comprehension; (YARC), the Gray Oral Reading Test; (GORT-5), and the sentence comprehension subtest of the Wide Range Achievement Test; (WRAT-4).
Results
Results showed that scanpath regularity measures, similarly to standard eye-tracking measures, were influenced by differences in task demands between the three tests. Nevertheless, both types of eye-tracking measures made unique contributions as predictors of comprehension and the best set of predictors included both standard eye-tracking measures and at least one scanpath measure across tests.
Conclusion
The results provide evidence that scanpaths capture differences in eye-movement patterns missed by standard eye-tracking measures. Overall, the results highlight the effect of task demands on eye-movement behavior and suggest that reading goals and task demands need to be considered when interpreting eye-tracking data.
In the last decades, researchers have investigated eye movements as a potential measure of language and reading ability. Several studies have suggested that features of eye-movement behavior during reading such as fixation durations, saccade length, and regression rates could be used to estimate second language proficiency (Berzak et al., Citation2018; Reich et al., Citation2022), classify readers at risk of dyslexia (Benfatto et al., Citation2016; Rello & Ballesteros, Citation2015), as well as estimate performance on reading comprehension assessments (Copeland & Gedeon, Citation2013; Copeland et al., Citation2014, Citation2016; D’Mello et al., Citation2020; Inhoff et al., Citation2018; Martínez-Gómez & Aizawa, Citation2014; Mézière et al., Citation2023; Reich et al., Citation2022; Southwell et al., Citation2020).
Studies on the relationship between eye movements and reading comprehension accuracy have shown that eye-movement behavior can successfully predict performance on commonly-used reading comprehension tasks, including cloze tasks (Copeland et al., Citation2014; Mézière et al., Citation2023), multiple-choice comprehension questions (D’Mello et al., Citation2020; Inhoff et al., Citation2018; Southwell et al., Citation2020), and open-ended questions (Mézière et al., Citation2023). However, there are inconsistent findings regarding the types of predictive eye-movement behaviors. For example, studies have found that better reading comprehension is associated with fewer regressions (Kim et al., Citation2019; Parshina et al., Citation2021; Southwell et al., Citation2020), more regressions (Schotter, Tran, et al., Citation2014; Wonnacott et al., Citation2016), or not related to regressions at all (Christianson et al., Citation2017).
In a recent study, Mézière et al. (Citation2023) investigated the relationship between types of eye-movement behavior and reading comprehension ability using three commercial standardized reading comprehension assessments: the York Assessment of Reading for Comprehension (YARC, Australian edition; Snowling et al., Citation2009), the Gray Oral Reading Test (GORT-5; Wiederholt & Bryant, Citation2012), and the sentence comprehension subtest of the Wide Range Achievement Test (WRAT-4; Wilkinson & Robertson, Citation2006). These tests were chosen to represent the wide range of task demands employed by reading comprehension assessments. Specifically, the tests differed in the comprehension task [open-ended questions (YARC and GORT) versus cloze (WRAT)], the length of the text being read [passages (YARC and GORT) versus sentences (WRAT)], the reading modality [silent (YARC and WRAT) versus aloud (GORT)], and whether participants had access to the text during the comprehension task [access (YARC and WRAT) versus no access (GORT)]. The results showed that standard eye-tracking measures such as fixation durations (e.g., gaze duration) or regression rates could be used to predict performance on all three tests. However, the relationship between these eye-movement measures and reading comprehension scores was moderated by the varying task demands of the three tests to such an extent that no measure could be identified as a useful predictor of comprehension across the three tests. Additionally, the direction of the relationship between eye-movement measures and comprehension scores sometimes differed between tests. For example, longer average fixation durations were associated with higher comprehension scores in the YARC but with lower comprehension scores on the GORT. Critically, supposedly “efficient” eye-movement behavior (i.e., shorter fixations, fewer regressions) was not necessarily associated with better comprehension across comprehension measures.
In sum, although previous research suggests that features of eye-movement behavior during reading can be used to successfully predict performance on individual reading comprehension tests, there is no universal set of eye-movement measures that predict performance on comprehension tests. This may be partially because readers adapt their reading strategies and cognitive processes to the reading goals and specific task demands of various comprehension measures (Bax & Chan, Citation2019; Kaakinen & Hyönä, Citation2010; O’Reilly et al., Citation2012; Radach et al., Citation2008; Schotter, Bicknell, et al., Citation2014). The eye-movement measures used in previous studies (e.g., fixation durations, saccade length, regression rate) typically focused on local or word-level measures commonly used in research on eye-movement behavior during reading (Clifton et al., Citation2007). However, there are other methods of analyzing eye-movement data that may be less susceptible to the influence of task demands, and therefore may identify more reliable predictors of reading comprehension ability across comprehension assessments. One candidate is the scanpath measure of eye-movement behavior during reading.
Scanpaths as a measure of eye-movement behavior
A scanpath is a sequence of eye fixations represented by fixation location (i.e., x- and y-coordinates) and fixation duration. Standard eye-tracking measures used in reading research focus on specific areas of interest, typically single words or phrases. In contrast, scanpaths capture eye-movement behavior that extends beyond local word-based measures to the sentence or discourse level and provide a more holistic representation of the overall pattern of gaze behavior during reading. For example, when regressive eye movements are of interest (e.g., for processing ambiguous sentences), scanpaths capture not only whether a regression occurred, but also the target of a regression (e.g., start of the sentence versus area of interest), and the type of regression (e.g., short regressions, multiple re-readings). These detailed representations of global eye-movement behavior provide a useful tool to investigate qualitative differences in eye-movement patterns both within and between groups of readers.
In one of the first studies demonstrating the usefulness of scanpaths, von der Malsburg and Vasishth (Citation2011) examined strategies used by readers when they encounter ambiguous sentences, which had previously been studied using word-based eye-movement measures such as fixation durations or regression rates (e.g., Frazier & Rayner, Citation1982; Meseguer et al., Citation2002). The results of von der Malsburg and Vasishth (Citation2011) revealed three reading patterns: Pattern A showed target regressions to the start of the sentence followed by subsequent fixations across the whole sentence; Pattern B showed regressions to the start of the sentence followed by no fixations (i.e., end of trial); Pattern C showed regression to the source of the ambiguity. Critically, the subsequent fixations would not have been apparent if only word-based measures had been used, demonstrating that scanpaths can capture effects that can be missed by more traditional eye-movement measures (see also von der Malsburg & Vasishth, Citation2013; von der Malsburg et al., Citation2015).
This method can be used to investigate the degree of similarity between scanpaths, and how typical a reader’s scanpath is in comparison to others, with the assumption that more distinctive scanpaths often reflect differences in processing, such as reading difficulties. Scanpath regularity is defined by the reading pattern that occurs most often in a dataset. This can be used to investigate individual and group differences, and the relationship between reading strategies and reading skills. For example, Parshina et al. (Citation2021) used scanpath regularity to investigate the reading processes of mono-lingual adults, children, heritage speakers (bilingual speakers who acquired their minority language at home), and second-language learners of Russian. They identified three patterns of scanpath regularity: “fluent” scanpaths characterized by regular left-to-right eye movements, short fixations, few regressions, and high proportions of skipping; “intermediate” scanpaths characterized by longer fixations, short regressions to individual words, and less skipping; and “beginner” scanpaths characterized by the longest fixations, frequent re-readings of the whole sentence, and little to no skipping. As expected, the four groups of readers differed in how much they used these three strategies. While monolingual adults typically exhibited the “fluent” scanpath strategy, the children, heritage speakers, and second-language learners more often exhibited the “intermediate” and “beginner” strategies. Interestingly, there was a relationship between reading strategies and reading and language skills. For heritage speakers, higher language proficiency scores were associated with more use of the “fluent” scanpaths, and for second-language learners higher reading comprehension scores were associated with more use of the “fluent” scanpaths. These findings suggest that scanpath regularity may reflect reading comprehension, and hence may prove an accurate predictor of reading comprehension ability.
A potential limitation to predictive power of scanpath regularity is the aforementioned fact that readers adapt their reading strategies to differences in task demands between reading tasks (Bax & Chan, Citation2019; Kaakinen & Hyönä, Citation2010; O’Reilly et al., Citation2012; Radach et al., Citation2008; Schotter, Bicknell, et al., Citation2014). Like all eye-movement measures, this will limit the degree to which scanpath regularity identified in previous studies (e.g., the “fluent” strategy in Parshina et al., Citation2021) can generalize across reading tasks and studies. However, unlike other eye-movement measures, scanpath regularity assesses eye movements relative to the most common reading strategy employed to meet task demands – regardless of what those demands are. For example, for tests in which participants have to fill in missing words, a common strategy might be to spend time around the blanks, but for a test that requires readers to answer comprehension questions linear reading strategies may be commonly used. In both cases, any deviation from this most common strategy would result in irregular scanpaths, regardless of the fact that the regular scanpaths represent very different strategies. Thus, scanpath regularity may prove less susceptible to task-demand effects that influenced word-based measures in previous studies (e.g., Mézière et al., Citation2023), and hence may provide a more reliable predictor of reading comprehension per se, both as individual predictors and in combination with other eye-movement measures.
The present study
The present study aims to investigate the relationship between eye-movement behavior and reading comprehension ability (Copeland & Gedeon, Citation2013; Copeland et al., Citation2014, Citation2016; D’Mello et al., Citation2020; Inhoff et al., Citation2018; Martínez-Gómez & Aizawa, Citation2014; Mézière et al., Citation2023; Southwell et al., Citation2020) using two types of eye-tracking measures – scanpath regularity and word-based measures. Specifically, we investigate the relative contributions of these two types of measures as predictors of performance on reading comprehension tasks with varying task demands. We hypothesize that scanpath regularity measures will contribute unique variance to the prediction of reading comprehension ability over and above word-based eye-movement measures. Additionally, while it is unlikely that measures derived from scanpaths will be entirely insensitive to differences in task demands, we hypothesize that they may be more stable than the word-based eye-tracking measures used in previous research.
Method
The data used in this study was initially collected for a study reported by Mézière et al. (Citation2023), which analyzed local and global eye-movements measures, but not scanpath regularity. For convenience we repeat the key points below.
Participants
79 undergraduate students with no history of reading or language difficulties participated in the study (65 females, mean age 22 years). Of those, 60 were monolingual native speakers of English, 8 were bilinguals with English as their primary language, and 11 were bilinguals whose primary language was not English. This sample ensured a wide range of reading comprehension abilities of skilled readers to avoid the artificial restriction of the reading comprehension continuum which can affect the validity of statistical outcomes. All participants were living and studying in Australia at the time of testing and participated for course credit. All participants gave their informed consent prior to participating. This study was approved by the Macquarie University Ethics Committee and conforms with the standard of the Australian National Statement on Ethical Conduct in Human Research.
Materials
Participants completed three standardized reading comprehension tests while their eye-movements were tracked: (1) the York Assessment of Reading for Comprehension – Passage Reading Secondary, Australian Edition (YARC; Snowling et al., Citation2009); (2) the Gray Oral Reading Test − 5th edition (GORT-5; Wiederholt & Bryant, Citation2012); and (3) the word reading and sentence comprehension subtests of the Wide Range Achievement Test − 4th edition (WRAT-4; Wilkinson & Robertson, Citation2006). Although these tests each have two sets of forms for test-retest purposes, only one form was used in this experiment (YARC form A, GORT-5 form A, and WRAT-4 Green form).
In the YARC, participants read two long passages of text silently, each text followed by 13 open-ended comprehension questions and were allowed to return to the text during reading, and to answer the questions. The final comprehension question was always a summary question, for which they were not allowed to return to the text. In the test manual, the authors indicate that the summary scores should be used with caution, hence we chose not to include the summary score in our analysis, and only the score on the comprehension questions was used as a comprehension measure for the YARC.
In the GORT, participants were given 11 passages of text to read aloud, each followed by 5 open-ended comprehension questions and were not allowed to return to the text.
In the sentence comprehension subtest of the WRAT, participants were given 31 items of 1–2 sentences each with one missing word, which the participants are asked to provide. The items were scored for accuracy based on the correct answers listed in the test manual, with the number of alternative correct answers ranging from only one correct option to “anything denoting concept X.”
All items were presented on a computer screen for the purpose of eye-tracking. The tests were all administered and scored following the procedures outlined in the test manuals. One exception was made for the baseline and discontinue rules which were only applied during scoring. This was done so that all participants would read the same items across all tests, while still keeping scoring procedures as close to the manual instructions as possible. The raw scores from each test were transformed into standard scores following the procedures in the test manuals. The YARC (Australian edition) has norms up to 18 years 11 months, the GORT-5 up to 23 years 11 months, and the WRAT-4 up to 94 years. For all tests, participants were scored with norms as close to their actual age as possible. Standard scores had a mean of 100 and standard deviation of 15.
Apparatus
Eye movements were recorded with an EyeLink 1000+ eye tracker (SR Research, Toronto, Ontario, Canada). The experiment took place in a sound-proof lab, and participants were seated in approximately 95 cm from the display screen, such that each letter occupied approximately 0.24° of visual angle on the screen. A headrest was provided to minimize head movements.
The texts were presented in Courier New font with a size of 24 pt in black color on a gray background (RGB: 204, 204, 204) on a BenQ Zowie XL2540 screen with a screen resolution of 1,920 × 1,080 pixels and a refresh rate of 240 Hz. Long test items (i.e., passages from the YARC and GORT) were spread over the whole screen across multiple pages (4 pages per item for the YARC, 1–3 pages for the GORT), and single-sentence items (i.e., WRAT items) were presented in the middle of the screen. In the YARC and GORT, participants were instructed to press a button to move forward in the text or when they had finished reading. They were then asked the comprehension questions. In the WRAT, the experimenter moved forward to the next item as soon as the participant gave their answer. The three tests were administered in random order.
Procedure
At the start of each test session, the eye tracker was calibrated with a 9-point calibration to ensure accuracy of the recorded eye movements. The calibration was repeated at the start of test items as necessary throughout the testing sessions (e.g., if calibration became poor, or participants moved), and at the start of both YARC items. The maximum tolerance for the calibration error for all points was 0.45°, with only one participant exceeding this cutoff with a maximum of 0.48°. All test items started with a drift detection point, placed at the very start of the text/sentence. The eye tracker collected fixation positions and durations. This information was then used to calculate various eye-movement measures for data analysis.
Data pre-processing
Test items that were not read in their entirety (e.g., if participants skipped a page) could not be scored accurately and were treated as missing data for both test comprehension scores and eye-movement measures. These included 7 GORT items and 2 WRAT items.
The eye-tracking data was first pre-processed in Data Viewer (SR Research, Toronto, Ontario, Canada). Participants and items with poor eye-tracking data were excluded based on visual inspection of the data (e.g., fixations were not aligned with the text), resulting in the exclusion of 2 participants, and a total loss of 7% of trials. Additionally, all fixations shorter than 80 ms and longer than 800 ms were excluded. Further pre-processing of the eye movement data differed slightly between the word-based eye-tracking measures as described by Mézière et al. (Citation2023) and the scanpath measures used in this article. For the dataset including word-based eye-tracking measures, all words around punctuation marks were excluded from analysis to remove effects of clause/sentence wrap-up effects, and all forward saccades longer than the perceptual span (20 characters; Rayner, Citation2009) were excluded from analysis (3% of all forward saccades). This pre-processing was identical to that described in Mézière et al. (Citation2023). For the scanpath analysis, initial fixations on a page made beyond the third word of a text (e.g., if initial fixations were made at the end/middle of the page) were excluded from analysis for the multi-paged GORT and YARC items, as these fixations were likely the result of flipping pages rather than actual fixations during reading. Unlike the word-based measures, fixations on words around punctuation were not removed in the scanpath analysis to calculate scanpath regularity measures. Finally, re-readings of the YARC while answering questions were excluded from analysis, and only one set of eye movements per page was included in the analysis when calculating scanpath measures.
Data analysis
All analyses were conducted in R (R Core Team, Citation2021). In the first step of the data analysis, we calculated three measures of scanpath regularity as potential predictors of comprehension, namely scanpath dissimilarity, scanpath density, and cluster membership. The measures were calculated in six steps, which are described in details below: 1) create scanpaths; 2) calculate dissimilarities between scanpaths; 3) create multi-dimensional maps of scanpath space; 4) calculate scanpath density from maps; 5) clustering of scanpaths; and 6) calculate cluster membership. We then used linear models to predict reading comprehension scores using the three scanpath measures as well as the eight eye-tracking measures used by Mézière et al. (Citation2023), which were average fixation duration, forward saccade length (in characters), skipping rate, first-fixation duration, gaze duration, regression rate, go-past time, and total reading time. To investigate the usefulness of our predictors, we ran multiple-regression models for every possible combination of our predictors, and used cross-validation to compare models and select the best models. To investigate the stability of our predictors, we examined and compared the output of single-predictor models.
Calculating scanpath regularity
We calculated three measures of scanpath regularity: dissimilarity, density, and cluster membership. The motivation behind using multiple measures is that there is no standard way of capturing scanpath regularity, hence we were interested in calculating complementary measures of scanpath regularity to determine if one measure was more useful as a predictor of reading comprehension across tasks. These measures were calculated for each test, yielding one scanpath per participant per page of text, and then aggregated per participant per test. Scanpath dissimilarity is a measure of how dissimilar a scanpath is to the central scanpath in the data (i.e., for a given item in test). Scanpath dissimilarity is perhaps the most obvious way to measure whether a scanpath is irregular, as it is a measure of how dissimilar a scanpath is to the central scanpath in the data (i.e., the most commonly-used reading strategy). However, scanpath dissimilarity assumes that there is a single most regular scanpath, which may not be the case, particularly in cases where more than one reading strategy is used by readers. Therefore, we also calculated scanpath density, which does not make this assumption and instead measures how typical a scanpath is given the group of scanpaths (i.e., reading strategy) that is belongs to i.e., it is compared to the central scanpath for that strategy as opposed to the central scanpath in the data across reading strategies. Although the two measures capture a similar concept, i.e., how dissimilar a scanpath is from the central scanpath in the data, they are not identical such that scanpaths with high density are not necessarily also highly similar to the central scanpath, such as when two reading strategies are used by readers.
The third measure – cluster membership – is a less direct measure of scanpath regularity. While dissimilarity and density assume a graded concept of regularity, the cluster measure assumes that regular and irregular scanpaths may be more qualitatively different, and therefore can be “clustered” into distinct reading strategies. We first ran a cluster analysis to identify scanpaths that either closely resembled the most commonly used reading strategy (i.e., the more regular scanpaths), and scanpaths that exhibited more unusual reading strategy (i.e., the more irregular scanpaths). Cluster membership was then defined as the proportion of a participant’s scanpaths for each test that exhibited unusual reading strategies, as a measure of how irregular a participant’s scanpaths were on average.
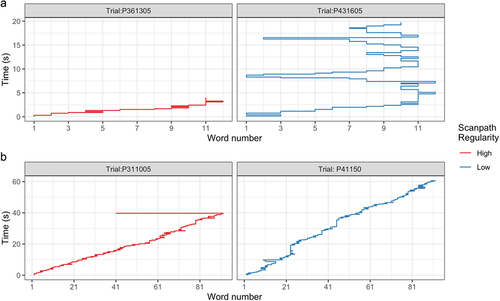
In the first step of this part of the analysis, we created plots of the scanpath per participant per test page to visualize how participants read the test items, as illustrated in . The plots were created using the word on which each fixation was made and its time during reading on a given page. This inspection of the scanpaths showed that participants differed in how long they spent reading the text, and how often they regressed to and re-read earlier parts of the text. These examples also illustrate the fact that regular scanpaths are similar across items and tests whereas scanpaths can be irregular in multiple ways (e.g., rereading the whole sentence or text versus a zig-zag pattern with variable fixation times), demonstrating that scanpath regularity abstracts away from the specific ways in which a scanpath is irregular.
Figure 1. Example scanpaths for sentence and passage reading.
Secondly, we calculated scanpath dissimilarity. We identified the most “central” scanpath as the scanpath with the smallest average dissimilarity from every other scanpath for each page. We then calculated the average dissimilarity of each participant’s scanpath compared to that of the central scanpath across pages with the scasim function (“scanpath” package; von der Malsburg, Citation2018). This dissimilarity measure was calculated as the difference between two scanpaths based on the spatial (x- and y-coordinates on the screen) and temporal (duration) differences in their fixation sequence. Put simply, it is an estimate of how long participants spent looking at different parts of the text. A detailed description of the dissimilarity measure and the scasim function can be found in von der Malsburg and Vasishth (Citation2011). For later comparison between pages and aggregating across items, the dissimilarity measure was z-transformed.
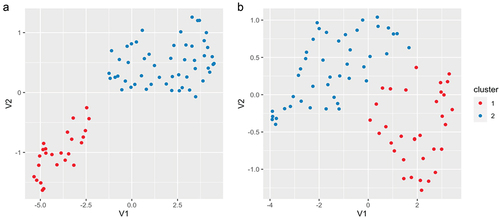
Thirdly, we then used isoMDS (“MASS” package; Venables & Ripley, Citation2002) to create a low-dimensional representation of scanpath variance to calculate scanpath density and identify reading strategies. This method creates n-dimensional maps of scanpath space, whereby each scanpath is represented as one datapoint (as in a scatterplot) and the Euclidean distance between points represents the dissimilarity between scanpaths, such that more similar scanpaths are closer to each other on the map (see von der Malsburg et al., Citation2015; von der Malsburg & Vasishth, Citation2011, Citation2013 for more detailed explanations of this procedure). Examples of such maps are shown in . For each page, we set the number of dimensions as 5, such that the average amount of unexplained variance was 14.5% for the WRAT (sd = 3.2), 18.7% for the GORT (sd = 0.8) and 20.5% for the YARC (sd = 2.23). The number of dimensions has an impact on the goodness of fit of the model, but also increases the risk of overfitting, hence the number was set to minimize the amount of unexplained variance across tests while also minimizing the risk of overfitting. Note that for visualization purposes, maps were created using the umap function from the “uwot” package in R (Melville, Citation2020), but these were not used for the analysis.
Figure 2. Examples of scanpath variance maps.
Next, Gaussian mixture models were used to estimate local scanpath densities (“mclust” package; Scrucca et al., Citation2016) from the maps of scanpath space. The density of each scanpath is a measure of how likely a scanpath is given the distribution of scanpaths that it belongs to. In other words, it is another way of measuring how regular a scanpath is such that scanpaths with higher density are more “regular” while scanpaths with low density are more irregular. As with the dissimilarity measure, density was z-transformed for the purpose of comparison and aggregating across pages. To run the models, the number of Gaussians (i.e., reading strategies) was set to two for all pages. This was set to ensure consistency across test pages and based on prior inspection of the data which showed that two Gaussians was the most common number of Gaussian needed across tests and pages.
Lastly, we used the results from the Gaussian modeling to calculate the proportion of scanpaths belonging to each of the two clusters (i.e., reading strategies) for each participant. Cluster 2 was defined as the cluster with the most amount of variance, meaning that cluster 2 always contained the most distinctive scanpaths, while cluster 1 contained the more regular scanpaths. We calculated “cluster membership” as the proportion of a participant’s scanpaths that belonged to cluster 2 within each test (i.e., the proportion of scanpaths that exhibited a more unusual reading strategy). This measure was then used as a predictor of comprehension.
Predicting reading comprehension
The approach used in this part of the analysis was virtually identical to that used by Mézière et al. (Citation2023). We used multiple-regression models and model selection to investigate the relationship between eye-tracking measures and comprehension scores and identify the best set of predictors for each comprehension test. Similarly to Mézière et al. (Citation2023), we first ran multiple-regression models for every possible combination of our predictors, and then used cross-validation to compare models and select the best models.
First, all measures were aggregated per participant per test. We then started by fitting Bayesian linear regression models with our three scanpath measures and eight eye-tracking measures as predictors of reading comprehension. As the focus of this paper is on the comparison between scanpaths and word-based eye-tracking measure, we did not include reading speed in the analysis, but models including reading speed as a predictor are included in Supplementary Materials. The models were run using the “stanarm” package in R, and we made inferences about the predictors’ effect based on the 95% credible interval. We ran one linear model for every possible combination of our eleven predictors (2,048 models in total), once for each test individually and once with data averaged across the three tests, such that the number of predictors in our models ranged from none (i.e., the null model with just an intercept) to eleven (i.e., the full model). All predictors were scaled and centered (z-transformed) prior to this part of the analysis so that the parameter estimates were comparable across predictors.
The models were then evaluated and compared within each set (one per test and one with averaged data) using leave-one-out cross-validation (LOO; Gelman et al., Citation2014; Vehtari et al., Citation2017). LOO estimates a model’s ability to predict new data by running the model as many times as there are data points, leaving out a different data point each time, and then estimating how well the model predicts the left-out data point. Through this process, the estimated log predictive density (elpd) was calculated for each model, which can be used to compare models. It should be noted that the LOO-elpd is only a measure of how good a model is at predicting new data, hence we also calculated the Bayesian R2 for each model to have a measure of how much variance was explained in the existing data (Gelman et al., Citation2019). To investigate the performance of scanpath measures as predictors of comprehension, we then examined the best ten models according to the elpd-LOO, and the full model. We were also interested in the stability of the relationship between individual eye-tracking measures and comprehension scores across tests, and the stability of the scanpath regularity measures in particular. As previous research shows that the relationship between word-based measures and comprehension is mediated by task demands, we investigated the stability of the relationship between individual eye-tracking measures and comprehension scores by looking at the output of single-regression models (i.e., models with only one predictor) and comparing the strength of the relationship (i.e., ), and the amount of variance explained by individual predictors across tests.
Results
Comprehension scores
Descriptive statistics for participants’ performance on the three comprehension tasks are shown in . Comprehension scores ranged from below average to above average on all tests, such that the full range of reading comprehension abilities were represented in the sample.
Table 1. Summary statistics of comprehension scores.
Reading strategies: scanpaths
provides examples of scanpaths across the three tests for three levels of comprehension (above average (A), average (B), and below average (C)) to illustrate the variations in reading times and re-reading behavior across tests and participants. In addition, illustrates typical (A) and atypical (B) scanpaths for the three tests, suggesting that atypical scanpaths are generally longer, with more extensive re-readings of the text. Importantly, while such visualizations provide insight in reading behavior across tests and participants, we cannot be certain which features of the scanpaths are critical in the mapping and the clustering part of our analysis. Therefore, inferences on the influence of the features that defined the clusters across tests and items must be limited.
Figure 3. Examples of scanpaths across tests and comprehension levels.
Figure 4. Examples of typical and atypical scanpaths.
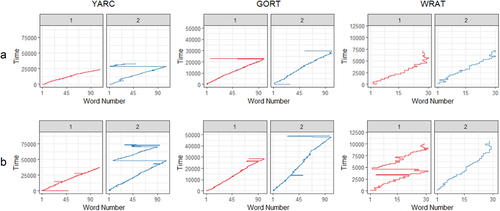
Figure 5. Stability of predictors across measures.
Models with single predictors
The output of the models with single predictors are shown in , including both model estimates (, i.e., the expected difference in comprehension score for a one standard deviation increase in the predictor) and credible interval (i.e., the range within which the true value lies with 95% certainty, given model assumptions). The stability of the relationship between comprehension scores and individual predictors is illustrated in . As noted in earlier sections, we did not include reading speed in this analysis as it is not an eye-tracking measure per se. For a more direct comparison with findings from Mézière et al. (Citation2023), the output of the top models when the analysis includes reading speed as a predictor can be found in Supplementary Materials. The best single predictor for the YARC scores was scanpath density, with an estimate of
= 3.6, 95% CrI [0.6, 6.6], and R2 = 0.07. For the GORT, the best single predictor was saccade length, with an estimate of
= 3.9, 95% CrI [1.8, 6.0], and R2 = 0.17. For the WRAT, the best single predictor was total reading time, with an estimate of
= −5.9, 95% CrI [−8.3, −3.5], and R2 = 0.24. For the averaged comprehension score the best single predictor was total reading time, with an estimate of
= −4.0, 95% CrI [−6.0, −2.0], and R2 = 0.17.
Table 2. Estimates from single-predictor regressions.
Best models with multiple predictors
show the ten best models, and the respective full models, for each test individually and the average of the three tests. Within tests, the results were stable such that the predictors remained highly similar across the top models. The “best” predictors were identified as predictors that appeared in the majority of the top ten models and were significantly associated with comprehension.
Table 3. YARC: intercepts and estimates of the best ten models and full model.
Table 4. GORT: intercepts and estimates of the best ten models and full model.
Table 5. WRAT: intercepts and estimates of the best ten models and full model.
Table 6. Average: intercepts and estimates of the best ten models and full model.
For the YARC, the best predictors of comprehension were gaze duration (average = −14.8), average fixation duration (average
= 8.8), total reading time (average
= 7.4), and scanpath density (average
= 3.3).Footnote1 The full model explained 31% of the variance, and the best models explained on average 23% of the variance in the data. For this test, models that included both a measure of scanpath regularity and word-based measures typically performed better than models that included only measures of scanpath regularity or only word-based measures.
For the GORT, the best predictors of comprehension were first-fixation duration (average = 13.5), average fixation duration (average
= −10.7), total reading time (
= −9.1), scanpath dissimilarity (average
= 5.8), and saccade length (average
= 3.9). The full model explained 41% of the variance in the data, and the best models explained 38% of the variance on average. As was the case with the YARC, models that included both a measure of scanpath regularity and word-based measures performed better than models that only included measures of scanpath regularity or word-based measures.
For the WRAT, the pattern of results was less clear-cut. The best predictors were total reading time ( = 6.9), go-past time (
= 4.5) and regression rate (
= 3.6). The importance of total reading time as a predictor is further supported by the fact that the model with only total reading time as a predictor was amongst the best models (Model 5). It is notable however that no predictor seemed to approach significance, not even at the 90% credible interval, in the full model, which is probably also a consequence of the fact that some predictors are highly correlated. Additionally, all models which did not include total reading times as a predictor included scanpath dissimilarity instead (models 1, 4, and 7), however no other scanpath measure appeared in any of the top ten models. The full model explained 36% of the variance in the data, and the best models explained 29% of the variance on average. Unlike the YARC and the GORT, the best models typically only included word-based measures, such that measures of scanpath regularity did not appear as useful predictors of performance on this test.
In the models predicting the average comprehension score, the best predictors of comprehension were total reading time ( = 13.4), scanpath dissimilarity (
= 12.6), saccade length (
= 3.4), and scanpath density (
= 3.2). The full model explained 40% of the variance in the data, and the top models explained 35% of the variance on average. As with the YARC and the GORT, models that included both measures of scanpath regularity and word-based measures performed better than models that only included scanpath regularity or word-based measures.
Discussion
We tested two hypotheses about scanpath regularity measures: first that these measures are unique predictors of reading comprehension beyond word-based eye-movement measures, and second that they produce more reliable outcomes than word-based eye-movement measures across comprehension tasks. Using the same analyses as Mézière et al. (Citation2023), we investigated the relative contribution and stability of eight eye-tracking measures as predictors of comprehension in addition to three measures derived from scanpaths: dissimilarity, density, and cluster membership. We investigated the relative contributions of these eleven variables by comparing linear regression models, and investigated their relative importance and stability as predictors of comprehension ability both in models with multiple predictors, and as single predictors.
Scanpath regularity as a predictor of reading comprehension ability
Our first hypothesis was that measures of scanpath regularity would be useful predictors of reading comprehension and explain variance over and above word-based eye-movement measures. The results are consistent with this hypothesis and show that both scanpath regularity and word-based eye-movement measures contribute uniquely as predictors of reading comprehension. Indeed, with the exception of the WRAT, patterns of results for the YARC, GORT, and the average dataset include at least one measure of scanpath regularity and word-based measures among the best predictors of comprehension. This is in line with our prediction that measures of scanpath regularity capture unique features of eye-movement behavior over and above what is captured by word-based eye-tracking measures alone. Hence, while scanpath regularity and word-based eye-tracking measures may capture some of the same information, measures of scanpath regularity do capture features of eye-movement behavior and the reading process that are not captured by word-based eye-tracking measures, and vice versa. Measures of scanpath regularity were also better predictors than skipping and regression rates, which, although traditionally used to capture reading comprehension, did not appear useful as predictors of comprehension. The usefulness of these two measures may have been affected by the fact that, in text reading, skipping and regression rates are not always calculated as accurately as in sentence reading however. Nevertheless, this finding is in line with previous studies suggesting that the scanpath measure used in this study is a powerful and useful method of analyzing eye-movement data and can provide information that is not apparent when only word-based measures are used (von der Malsburg et al., Citation2012). Specifically, scanpaths capture the overall gaze trajectory, and the order in which people read parts of the text, which cannot be captured by word-based measures alone. While scanpaths cannot be used to pinpoint exact features of the reading process, they likely capture overall reading strategies (e.g., linear reading vs. extensive re-readings) better than word-based measures. On the other hand, word-based measures are more informative about the tactics that make up these strategies (e.g., lexical processing times).
Importantly, our results also highlight the fact that the two types of measures can be used in combination to get a fuller and more accurate picture of reading behavior. Indeed, the results suggest that neither type of measure clearly surpasses the other as a predictor of comprehension. On the contrary, the results suggest that including both types of measures as predictors of comprehension typically improves predictions over models that only include scanpath regularity or word-based measures, with the full model including both types of measures explaining 31–41% of the variance in our data across tests. This was also illustrated by the fact that scanpath regularity did not systematically surpass word-based measures as single predictors of comprehension, and vice versa. Indeed, while scanpath density was the best single predictor of performance on the YARC and explained the most amount of variance on average (R2 = 0.18), word-based measures appeared as the best single predictors of comprehension in the other datasets. Hence, while the scanpath regularity measures may capture a fuller picture of eye-movement behavior than any single word-based measure and tended to explain the most variance on average across measures (R2 = 0.10–0.18), they do not systematically outperform word-based measures as single predictors of performance across comprehension measures but instead usefully complement them.
Regular scanpaths as indicative of good reading comprehension
The relationship between scanpath regularity measures and comprehension is mostly consistent with previous studies suggesting that more regular scanpaths tend to be associated with better comprehension and reading skills (Parshina et al., Citation2021; von der Malsburg et al., Citation2015). This pattern was found across comprehension measures, suggesting the existence of a single optimal reading process, and that readers who deviate from it in some way tend to have lower comprehension scores. Importantly, the characteristics of this optimal reading process may differ as a result of differences in task demands or reading goal. For example, the optimal reading process when reading during a cloze task may not be the same as the optimal process when reading to answer comprehension questions. Nevertheless, our results suggest that, across reading comprehension assessments with varying task demands, deviation from the optimal reading process for that task is an indicator of poorer comprehension. This provides further support for the usefulness of measures such as scanpath regularity that capture the degree to which a reader deviates from the optimal reading process as possible markers of poor reading comprehension.
Scanpath regularity as a stable predictor of comprehension across tasks
Our second hypothesis was that measures derived from scanpaths may provide more stable predictors of reading comprehension across tasks compared to word-based measures. The results were only partially consistent with this hypothesis. Indeed, results from the single regression models showed that higher scanpath density, lower scanpath dissimilarity, and higher cluster membership (i.e., higher proportion of distinctive scanpaths) are all associated with higher comprehension scores, suggesting that more regular scanpaths are associated with better comprehension regardless of which measure of scanpath regularity or which measure of comprehension is used. However, while both scanpath density and scanpath dissimilarity also appeared as useful predictors of comprehension in multiple-regression models (i.e., in concert with other measures), this was not the case for cluster membership. This suggests that cluster membership, unlike density and dissimilarity, may not provide additional information over and above other scanpath and word-based eye-tracking measures.
While the predictive relationship of scanpath density and cluster membership with comprehension was consistent across tests and models, this was not the case for scanpath dissimilarity. Indeed, the effect of scanpath dissimilarity in the multiple-regression models varied between tests, and results from models with multiple predictors indicated that larger scanpaths dissimilarity was sometimes associated with better scores. While this finding may seem surprising at first, it may simply be a result of the fact that the predictors in our models were correlated to each other, rendering the interpretation of the direction of the relationship between predictors and comprehension more difficult. This finding is also reminiscent of findings from Mézière et al. (Citation2023) indicating that the direction of the relationship between word-based eye-movement measures and comprehension could also vary between tests. A probable explanation for this seemingly surprising finding is that including multiple features of eye-movement behavior in the model informs predictions which in turn can mediate the predictive relationship between eye-tracking measures and comprehension. This is particularly likely in our case as the predictors in our models are often moderately to highly correlated (see Supplementary Materials for full correlation tables). Hence, in models with multiple predictors the measure of scanpath dissimilarity may capture a different aspect of eye-movement behavior. For example, this seemingly unexpected effect of scanpath dissimilarity may be capturing the balance between reading efficiency and depth of processing, such that when other eye-tracking measures in the model capture reading efficiency, scanpaths that are too regular can be associated with poorer comprehension, without negating the finding that regular scanpaths are generally reflective of more efficient eye movements and thus better comprehension. Thus, while the direction of the relationship between scanpath measures and comprehension were more consistent across tests than for word-based eye-tracking measures, the relative importance and usefulness of the scanpath measures still differed between tests. This is not entirely surprising and is consistent with our predictions that, while scanpath regularity measures may be somewhat less sensitive to differences in task demands between the three tests, they are not entirely insensitive to them either.
The results suggest that both scanpath density and dissimilarity are useful predictors of comprehension and make independent contributions as predictors of reading comprehension. Hence, both measures are good at quantifying how unusual a scanpath is, but neither of the two measures fully capture scanpath regularity. Further research into the relationship between scanpath regularity and comprehension ability is therefore necessary to better understand how such measures capture qualitative differences in eye-movement behavior and comprehension, and whether a single measure can be identified that fully captures the distinctiveness of a reading pattern.
Estimating reading comprehension ability from eye movements
In this study, we used the data collected by Mézière et al. (Citation2023), who used eye movements to examine the cognitive processes engaged by reading comprehension tests with varying task demands. The results from the current analysis are highly similar to that of Mézière and colleagues, such that the best predictors of comprehension varied significantly across the three tests, both in terms of which predictors were most useful in predicting comprehension scores and in the direction of the relationship between eye-tracking measures and comprehension. Nevertheless, the current analysis also yielded some differences compared to those of Mézière et al. (Citation2023).
The best set of predictors for the GORT scores were identical to previous findings, such that these scores were more strongly associated with early eye-tracking measures (first-fixation duration), and were best predicted by a combination of global, early, and late measures. Additionally, our results indicate that scanpath regularity was a good predictor of performance on the GORT.
In contrast, results for the YARC were widely different from Mézière and colleagues’, as only gaze duration remained a consistently good predictor of comprehension across analyses. Like the GORT however, scanpath regularity was a good predictor of performance on the YARC. The differences between the two studies may be because we did not include the same predictors when running our regression models, thus affecting the relative importance and usefulness of word-based eye-tracking measures as predictors of comprehension. Critically, we did not include reading speed as a predictor as it is not an eye-tracking measure, although it was previously found to be a useful predictor of comprehension for the YARC. However, this difference between the two studies is not enough to explain the discrepancies in our findings, as some of the differences between the two analyses do remain when speed is included as a predictor. The remaining differences are likely explained by the inclusion of the scanpath regularity measures in this analysis.
Results for the WRAT also differed from previous findings, such that only regression rate appeared as a good predictor across analyses. Scanpaths regularity was a good predictor of performance on the YARC and the GORT, but not for the WRAT. Indeed, scanpath dissimilarity only appeared as a significant predictor in instances where total reading time was not a predictor, which only occurred in three out of the top ten models. In their analysis, Mézière et al. (Citation2023) found that, unlike for the other two tests, fixation durations were generally not useful predictors of performance on the WRAT, and that reading speed instead appeared as the single most useful predictor. One interpretation of this finding is that the best predictor of performance on the WRAT is how quickly readers can make predictions about upcoming linguistic materials and not so much how they do it. Our analysis indicates that total reading time,Footnote2 the eye-tracking measure typically most highly correlated with reading speed, is the most useful predictor for the WRAT scores. Hence, while previous studies suggest that cloze tasks may measure word processing more than higher-level processes of reading (Keenan et al., Citation2008; Nation & Snowling, Citation1997), our results again indicate that the best predictor of performance on the WRAT may in fact be how quickly readers can provide the missing word.Footnote3 Overall, the results for the WRAT suggest that, for this test, scanpaths do not provide additional useful information over and above measures that most closely capture how quickly participants are able to perform the task. This finding also suggests that, although measures of scanpath regularity do capture reading speed, the variations in eye-movement behavior that they capture go beyond reading speed alone. Notably, the importance of individual predictors varied between models with single predictors and the models with multiple predictors. While this may seem surprising, it illustrates the fact that predictor can be useful by itself, but not remain useful when other predictors are included in the model.
Finally, the results for the average of the three tests also differs greatly from previous findings, as only total reading time remained a good predictor of comprehension across analyses. Additionally, scanpath regularity was a good predictor of comprehension, as two measures (density and dissimilarity) were useful predictors in these models. As with the YARC and the WRAT, some of these differences between our analysis and Mézière et al. (Citation2023) come from differences in the predictors used in the models, particularly reading speed which also appeared as a good predictor of comprehension of the aggregated dataset.
Overall, our findings further demonstrate that there is no simple relationship between eye movements and reading comprehension. On the contrary, reading behavior and eye movements are highly adaptive, such that task demands mediate the relationship between eye movements and comprehension, rendering the identification of eye-movement markers of successful comprehension challenging.
Conclusions
In conclusion, our results show that scanpaths and word-based eye-tracking measures both make unique contributions as predictors of reading comprehension, suggesting that scanpaths capture features of eye-movement behavior that are not captured by word-based eye-tracking measures alone. Additionally, our results suggest that the two types of measures can be combined to get a more detailed and accurate picture of eye-movement behavior and study the cognitive processes involved in reading comprehension. Nevertheless, the differences between the three comprehension scores indicate that both types of measures are influenced by differences in task demands between reading comprehension assessments, thus highlighting the fact that reading goals and task demands need to be considered when investigating the relationship between eye movements and comprehension, and when interpreting eye-tracking data.
Scanpath Paper Supplementary Material Resubmit.docx
Download MS Word (1 MB)Acknowledgments
We would like to thank Roel Jonkers, Joe Magliano, and Kiel Christianson for helpful comments on a previous version of the article. This research was supported by an International Macquarie University Research Excellence Scholarship (iMQRES) and two Australian Research Council grants (DP190100719 & DP200100311). This research was approved by the Macquarie University ethics committee.
Disclosure statement
No potential conflict of interest was reported by the author(s).
Supplementary material
Supplemental data for this article can be accessed online at https://doi.org/10.1080/10888438.2023.2232063
Additional information
Funding
Notes
1. The indicate the increase in the number of points on the test scale expected for one standard deviation of the predictor.
2. Total reading time was measured as the sum of all fixations made on a word, while reading speed was measured as words read per minute. While the two measures are highly correlated, they are not identical.
3. When the analysis is run with reading speed, the pattern of result for the WRAT is identical to that reported by Mézière et al. (2023) with reading speed as the best predictor.
References
- Bax, S., & Chan, S. (2019). Using eye-tracking research to investigate language test validity and design. System, 83, 64–78. https://doi.org/10.1016/j.system.2019.01.007
- Benfatto, M. N., Seimyr, G. Ö., Ygge, J., Pansell, T., Rydberg, A., & Jacobson, C. (2016). Screening for dyslexia using eye tracking during reading. PLoS ONE, 11(12), 1–16. https://doi.org/10.1371/journal.pone.0165508
- Berzak, Y., Katz, B., & Levy, R. (2018). Assessing language proficiency from eye movements in reading. ArXiv Preprint, arXiv, 1804.07329.
- Christianson, K., Luke, S. G., Hussey, E. K., & Wochna, K. L. (2017). Why reread? Evidence from garden-path and local coherence structures. The Quarterly Journal of Experimental Psychology, 70(7), 1380–1405. https://doi.org/10.1080/17470218.2016.1186200
- Clifton, C., Jr., Staub, A., & Rayner, K. (2007). Eye movements in reading words and sentences Van Gompel, Roger P. G., Fischer, Martin H., Murray, Wayne S., Hill, Robin L. eds. Eye Movements: A Window on Mind and Brain, 341–371. Oxford, UK: Elsevier.
- Copeland, L., & Gedeon, T. (2013). Measuring reading comprehension using eye movements. 4th IEEE International Conference on Cognitive Infocommunications, CogInfoCom 2013 - Proceedings. Budapest, Hungary, (pp. 791–796).
- Copeland, L., Gedeon, T., & Caldwell, S. (2016). Effects of text difficulty and readers on predicting reading comprehension from eye movements. 6th IEEE Conference on Cognitive Infocommunications, CogInfoCom 2015 - Proceedings Gyor, Hungary, (pp. 407–412).
- Copeland, L., Gedeon, T., & Mendis, S. (2014). Predicting reading comprehension scores from eye movements using artificial neural networks and fuzzy output error. Artificial Intelligence Research, 3(3). https://doi.org/10.5430/air.v3n3p35
- D’Mello, S. K., Southwell, R., & Gregg, J. (2020). Machine-learned computational models can enhance the study of text and discourse: A case study using eye tracking to model reading comprehension. Discourse Processes, 57(5–6), 420–440. https://doi.org/10.1080/0163853X.2020.1739600
- Frazier, L., & Rayner, K. (1982). Making and correcting errors during sentence comprehension: Eye movements in the analysis of structurally ambiguous sentences. Cognitive Psychology, 14(2), 178–210. https://doi.org/10.1016/0010-0285(82)90008-1
- Gelman, A., Goodrich, B., Gabry, J., & Vehtari, A. (2019). R-squared for Bayesian regression models. The American Statistician.
- Gelman, A., Hwang, J., & Vehtari, A. (2014). Understanding predictive information criteria for Bayesian models. Statistics and Computing, 24(6), 997–1016. https://doi.org/10.1007/s11222-013-9416-2
- Inhoff, A. W., Gregg, J., & Radach, R. (2018). Eye movement programming and reading accuracy. The Quarterly Journal of Experimental Psychology, 71(1), 3–10. https://doi.org/10.1080/17470218.2016.1226907
- Kaakinen, J. K., & Hyönä, J. (2010). Task effects on eye movements during reading. Journal of Experimental Psychology: Learning, Memory & Cognition, 36(6), 1561–1566. https://doi.org/10.1037/a0020693
- Keenan, J. M., Betjemann, R. S., & Olson, R. K. (2008). Reading comprehension tests vary in the skills they assess: Differential dependence on decoding and oral comprehension. Scientific Studies of Reading, 12(3), 281–300. https://doi.org/10.1080/10888430802132279
- Kim, Y. S. G., Petscher, Y., & Vorstius, C. (2019). Unpacking eye movements during oral and silent reading and their relations to reading proficiency in beginning readers. Contemporary Educational Psychology, 58(March), 102–120. https://doi.org/10.1016/j.cedpsych.2019.03.002
- Martínez-Gómez, P., & Aizawa, A. (2014). Recognition of understanding level and language skill using measurements of reading behavior. International Conference on Intelligent User Interfaces, Proceedings IUI. Haifa, Israel, (pp. 95–104).
- Melville, J. (2020). Uwot: The Uniform Manifold Approximation and Projection (UMAP) method for dimensionality reduction. R package version 0.1.10.
- Meseguer, E., Carreiras, M., & Clifton, C. (2002). Overt reanalysis strategies and eye movements during the reading of mild garden path sentences. Memory & Cognition, 30(4), 551–561. https://doi.org/10.3758/BF03194956
- Mézière, D. C., Yu, L., Reichle, E., von der Malsburg, T., & McArthur, G. (2023). Using eye-tracking measures to predict reading comprehension. Reading Research Quarterly, 0(0), 1–25. https://doi.org/10.1002/rrq.498
- Nation, K., & Snowling, M. (1997). Assessing reading difficulties: The validity and utility of current measures of reading skill. The British Journal of Educational Psychology, 67(3), 359–370. https://doi.org/10.1111/j.2044-8279.1997.tb01250.x
- O’Reilly, T., Sabatini, J., Bruce, K., Pillarisetti, S., & McCormick, C. (2012). Middle school reading assessment: measuring what matters under a RTI Framework. Reading Psychology, 33(1–2), 162–189. https://doi.org/10.1080/02702711.2012.631865
- Parshina, O., Sekerina, I. A., Lopukhina, A., & von der Malsburg, T. (2021). Monolingual and bilingual reading processes in Russian: An exploratory scanpath analysis. Reading Research Quarterly, 57(2), 469–492. https://doi.org/10.1002/rrq.414
- Radach, R., Huestegge, L., & Reilly, R. (2008). The role of global top-down factors in local eye-movement control in reading. Psychological Research, 72(6), 675–688. https://doi.org/10.1007/s00426-008-0173-3
- Rayner, K. (2009). Eye movements and attention in reading, scene per- ception, and visual search. The Quarterly Journal of Experimental Psychology, 62(8), 1457–1506.
- R Core Team. (2021). R: A language and environment for statistical computing. R Foundation for Statistical Computing.
- Reich, D. R., Prasse, P., Tschirner, C., Haller, P., Goldhammer, F., & Jäger, L. A. (2022, June). Inferring native and non-native human reading comprehension and subjective text difficulty from scanpaths in reading. In 2022 Symposium on Eye Tracking Research and Applications. Seattle, WA, USA, (pp. 1–8).
- Rello, L., & Ballesteros, M. (2015). Detecting readers with dyslexia using machine learning with eye-tracking measures. Web for All Conference. Florence, Italy, (pp. 16–23).
- Schotter, E. R., Bicknell, K., Howard, I., Levy, R., & Rayner, K. (2014). Task effects reveal cognitive flexibility responding to frequency and predictability: Evidence from eye movements in reading and proofreading. Cognition, 131(1), 1–27. https://doi.org/10.1016/j.cognition.2013.11.018
- Schotter, E. R., Tran, R., & Rayner, K. (2014). Don’t believe what you read (Only Once): Comprehension is supported by regressions during reading. Psychological Science, 25(6), 1218–1226. https://doi.org/10.1177/0956797614531148
- Scrucca, L., Fop, M., Murphy, T. B., & Raftery, A. E. (2016). Mclust 5: Clustering, classification and density estimation using Gaussian finite mixture models. The R Journal, 8(1), 289–317. https://doi.org/10.32614/RJ-2016-021
- Snowling, M. J., Stothard, S. E., Clarke, P., Bowyer-Crane, C., Harrington, A., Truelove, E., Nation, K., & Hulme, C. (2009). YARC York Assessment of Reading for Comprehension passage reading. GL Publishers.
- Southwell, R., Gregg, J., Bixler, R., & D’Mello, S. K. (2020). What eye movements reveal about later comprehension of long connected texts. Cognitive Science, 44(10). https://doi.org/10.1111/cogs.12905
- Vehtari, A., Gelman, A., & Gabry, J. (2017). Practical Bayesian model evaluation using leave-one-out cross-validation and WAIC. Statistics and Computing, 27(5), 1413–1432. https://doi.org/10.1007/s11222-016-9696-4
- Venables, W. N., & Ripley, B. D. (2002). Modern applied statistics with S (4 th ed.). Springer.
- von der Malsburg, T. (2018). Scanpath: Tools for analyzing spatio-temporal patterns in eye movements. R package version 1.06.
- von der Malsburg, T., Kliegl, R., & Vasishth, S. (2015). Determinants of scanpath regularity in reading. Cognitive Science, 39(7), 1675–1703. https://doi.org/10.1111/cogs.12208
- von der Malsburg, T., & Vasishth, S. (2011). What is the scanpath signature of syntactic reanalysis? Journal of Memory and Language, 65(2), 109–127. https://doi.org/10.1016/j.jml.2011.02.004
- von der Malsburg, T., & Vasishth, S. (2013). Scanpaths reveal syntactic underspecification and reanalysis strategies. Language and Cognitive Processes, 28(10), 1545–1578. https://doi.org/10.1080/01690965.2012.728232
- von der Malsburg, T., Vasishth, S., & Kliegl, R. (2012, December). Scanpaths in reading are informative about sentence processing. In Proceedings of the First Workshop on Eye-tracking and Natural Language Processing. Mumbai, India, (pp. 37–54).
- Wiederholt, J. L., & Bryant, B. R. (2012). Gray oral reading tests–5. Gray Oral Reading Tests–5, GORT–5.
- Wilkinson, G. S., & Robertson, G. J. (2006). Wide Range Achievement Test 4 (WRAT4). Psychological Assessment Resources, Lutz.
- Wonnacott, E., Joseph, H. S. S. L., Adelman, J. S., & Nation, K. (2016). Is children’s reading “good enough”? Links between online processing and comprehension as children read syntactically ambiguous sentences. The Quarterly Journal of Experimental Psychology, 69(5), 855–879. https://doi.org/10.1080/17470218.2015.1011176