Abstract
Vis/Near infrared reflectance spectroscopy appears to be a rapid and convenient non-destructive technique that can measure the quality and compositional attributes of many substances. This paper assesses the ability of NIR reflectance spectroscopy to estimate the acidity of strawberry. Spectra were collected from 65 samples and data was expressed as absorbance, the logarithm of the reciprocal of reflectance (log1/R). The absorbance data was subsequently compressed using wavelet transformation. Two models to predict the acidity in strawberry were constructed. A prediction model based on wavelet transform (WT) combined with partial least squares (PLS) was found better with the r of 0.856, RMSEP of 0.026, and in the confidence lever 95%.
INTRODUCTION
Near infrared reflectance spectroscopy (NIRS) which works fast and in a non-destructive way has proved to be very useful for predicting concentrations, classification and pattern recognition.[Citation1] It is a well-established technique for constituent analysis of agricultural and a food product as it has many advantages when compared with classical chemical and physical analytical methods.
The information in the spectral pattern is used to predict the chemical compositions of the sample by extracting the relevant information from many overlapping peaks. So, how to extract the useful information from mass original spectral data is a pivotal step. As a result, multivariate calibration is required for quantitative analysis of sample constituents. Principal components regression (PCR), partial least squares (PLS) and artificial neural networks (ANN) are the most used multivariate calibration techniques for the NIRS.[Citation2–6] The PCR can effectively compress the dimensions of the original independent variables by constructing the relationship between the original independent variables and new reduced dimension independent variables. However, the correlation degree of original independent variables and new reduced dimension independent variables is decreased, which lead to low prediction precision. The ANN, which is a popular non-liner calibration method in chemometrics, has a high quality in non-linear approximation. Nevertheless, the weaknesses of this method, such as its low training speed, ease of becoming trapped at a local minimum and over-fitting should be taken into account.[Citation7] The PLS was usually considered for a large number of applications in fruit and juice analysis and was widely used in multivariate calibration.[Citation8 Citation9] One important practical aspect of PLS is that it takes into account errors both in the concentration estimates and spectra.[Citation9] Therefore, PLS is an invaluable linear calibration method.
Because of spectral interferences, including varying backgrounds and noise, many methods such as derivative method, genetic regression and orthogonal signal correction (OSC) have been developed to preprocess the spectra. In addition, wavelet transform (WT),[Citation10–15 a technique that is popularly used in the processing of analytical signals, recently was also used as an alternative preprocessing tool.[Citation16–17] WT is a new math method based on the FT transform; it can be used in data compression, smoothing and noise filtration, baseline validation, and multi-components superposition signal analysis also in image disposal.[Citation18] Chen, Fu, and Lu reported improvement of predicting precision of oil content in instant noodles by using wavelet transforms to treat near-infrared spectroscopy.[Citation19] Zhu, Wang, and Zhang reported the wavelet denoising theory and application in wheat protein concentration prediction with near infrared spectroscopy analysis.[Citation20] Wang, Chen, and Shao reported the application of WT and PLS in prediction of common chemical compositions in tobacco samples.[Citation21] This article aims to serve two purposes: first, it shows on a typical example (strawberry Vis/NIR spectra) how wavelet transforms can be used in order to extract relevant information. Second, it applies wavelet transforms and partial least squares in prediction of acidity in strawberry samples.
MATERIALS AND METHODS
Experimental Material
To get dependable prediction equations from NIRS, it is necessary that the calibration set covers the range of fruit sources to which it will be applied.[Citation22] A total of 66 strawberries used for the experiment were purchased at a local market and stored at 20°C. By calculating and deleting some samples of which the error derivate were more than two times of their SEC, 40 strawberries were finally used for the calibration models, and 25 samples were used for prediction models. The measurement for acidity was using a pH meter (SJ-4A, Exact instrument Co., Ltd., Shanghai, China) by the Chinese standard. The results of pH reading were shown in .
Table 1 The pH readings for all strawberry samples
Spectra Collection
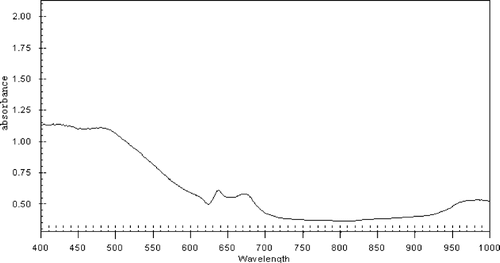
Each strawberry sample was scanned 30 times with a spectrograph (FieldSpec Pro FR (325–1075 nm)/ A110070), Trademarks of Analytical Spectral Devices, Inc. (ASD), using RSCitation2 software for Windows. Considering its 20° field-of-view (FOV), the spectrograph was placed at a height of approximately 100 mm above the sample and a light source of Lowell pro-lam 14.5V Bulb/128690 tungsten halogen (Vis/NIRS) was placed about 300 mm from the center of the strawberry to make the angle between the incident light and the detector optimally about 45°. After that each sample was saved three spectrograms; the average value of the three graphs was taken as the ultimate spectra reflectivity graph. To avoid low signal-noise ratio, only the wavelength ranging from 400 to 1000 nm was used in this investigation. In order to obtain enough sensitivity to measure the diffuse reflectance of the intact strawberry, each spectrum was recorded as log (1/R), where R = reflectance, as shows.
Figure 1 Vis/NIR absorbance curve of one strawberry.
Processing of the Optical Data
To test the influence of the preprocessing on the prediction of the calibration model, two types of preprocessing were used. First to reduce the noise, the smoothing way of Savitzky-Golay was used, with a gap of 9 data points. The second type of preprocessing was the use of the multiplicative scatter correction (MSC). This method was used to correct additive and multiplicative effects in the spectra. Once these preprocessing procedures were completed, principal component analysis (PCA) and PLS. The pre-process and calculations were carried out using ‘The Unscrambler V9.2’ (CAMO PROCESS AS, Oslo, Norway), a statistical software package for multivariate calibration.
Principal Component Analysis
PCA combined with the PLS regression was used to derive the first 20 principal components from the spectral data for further analysis to examine the relevant and interpretable structure in the data as well as outlier detection.[Citation23–24] It was also used to eliminate defective spectra.
Partial Least Square Methodology
PLS is a bilinear modeling method where the original independent information (X-data) is projected onto a small number of latent variables (LV) to simplify the relationship between X and Y for predicting with the smallest number of LVs.
Actually in the PLS processing, the decomposing and regression of matrix are processing synchronously. That is the decomposing of X matrix and Y matrix is carried out at the same time and the information of Y matrix is imported in this process. In order to make the principal component of X correlated with Y directly, the score of X and Y were exchanged before every new principal component is calculated.
The quality of the calibration model was quantified by the correlation coefficient (rc), and the standard error of calibration (SEC) and the root mean squared error of calibration (RMSEC). The prediction accuracy of the calibration model was tested using the leave-one-out validation, and evaluated by the standard error of cross validation (SECV), the root mean squared error of validation (RMSECV), and the correlation coefficient (rv).
Wavelet Transforms Compression
WT have been studied for many years by mathematicians and widely used in numerous applications. It is a kind of math transform which can map the time scope signal to a two-dimensional scope. Furthermore, it has many excellent features: 1) to view the signal in time scope or frequency scope at any selected scalar; and 2) it is very suitable to compress data and filtering noise. Its working principle is to build a wavelet function, which must obey some limited conditions. In this research, Daubechies wavelet function was applied to compress the spectra data. It was used to compress the matrix that contained 65 samples and 601 spectra data.
RESULTS AND DISCUSSION
Principal Component Analysis on the Full Wavelength Region
Spectra were exported from the ViewSpec software for multivariate analysis. First, the pretreatment method of MSC was used to correct for additive and multiplicative effects in the spectra after Savitzky-Golay smoothing. Then, PCA was used to derive the first 20 principal components from the spectral data for further analysis to examine the relevant and interpretable structure in the data as well as outlier detection.
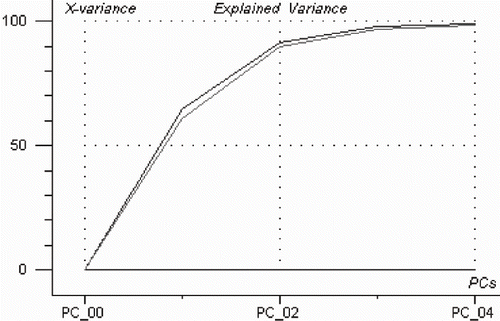
PCA was performed on the whole wavelengths from 400 nm to 1000 nm for the total of 65 strawberries in the training set. shows the explained rate plot for the first four principal components (PCs). It was noticed that the first four PCs could together explain over 98% of the total population variance and the remainders could account for little. Thus, the first four PCs were appropriate for characteristic description of the strawberry spectral curve.
Figure 2 First four principal components calculated from the strawberry spectral curve in the training set of PCA model.
Selection of Optimal Wavelengths
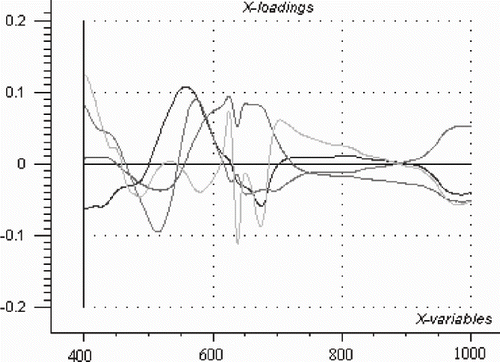
shows the loadings of first four principal components from 65 samples across the entire spectral region. It is called, “The loading plot of PC1 to PC4.” As described above, the cumulative reliabilities of PC1 to PC4 were very high, so the loadings of PC1 to PC4 should be considered as the basis to eliminate defective spectral for establishing the calibration model. From the loading image, it also shows that the wavelengths before 700 nm are more sensitive to acidity than wavelengths after 700 nm. It indicates that the wavelengths in the visible spectral region played a very important role than near infrared region.
Figure 3 Loadings of first four principal components from 65 strawberries across the entire spectral region.
Partial Least Square Used Only
After above analysis of PCA, some defective spectral were eliminated to establish the calibration model. PLS was used to establish the model for strawberry acidity analysis. All samples for modeling were split into a calibration set (n = 40) and a validation set (n = 25). The quality of the calibration model was quantified by the SEC, and rc for the calibration set and SECV, the standard deviation (SD) and rv for validation set. Higher r and lower SEC and SECV and SD values were taken to be indicative of a superior model. The prediction accuracy of the calibration model was tested using the predicting set, and evaluated by the standard error of prediction (SEP), the root mean square error of prediction (RMSEP) and the correlation coefficient between the predicted and the measured parameters.[Citation25]
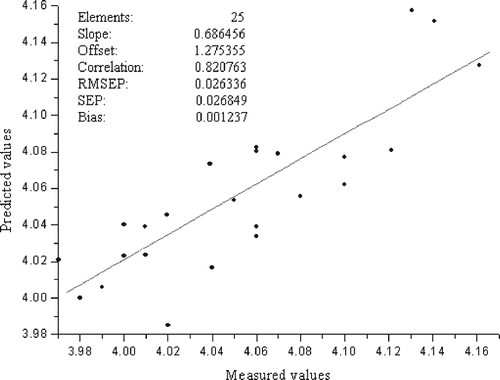
In this study, the calibration and validation results only established by PLS. In calibration part, SEC is 0.025, rc is 0.826 and RMSEC is 0.025. And in validation part, SECV is 0.031, rv is 0.802 and RMSECV is 0.032. PLS calibration model for acidity is presented in . When the model was used to predict the 25 unknown samples, prediction result (r = 0.821), SEP 0.027, and RMSEP is 0.026, as shows.
Figure 4 Vis/NIR calibration results of acidity for 40 samples from the PLS model.
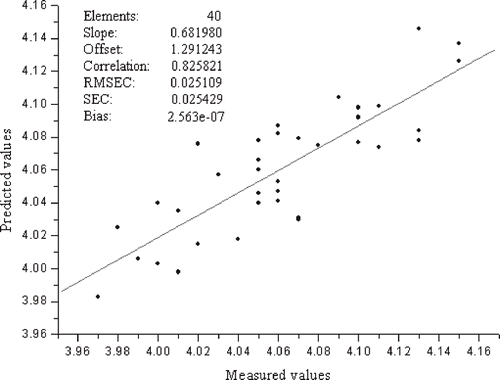
Figure 5 Vis/NIR prediction results of acidity for 25 unknown samples from the PLS model.
Partial Least Square Combined with Wavelet Transform
Because of spectral interferences, including varying backgrounds and noise. So, wavelet transform was used to compress the entire 65 sample spectral curve, each of them have 601 data points. Considered that different wavelet function (Db1, Db2, Db3) and decomposing length (1, 2, 3) will affect the compression result. So the predicted error sum of squares (PRESS) was used to choose the optimal wavelet function and decomposing length. The least PRESS was got when Daubechies2 and decomposing length 2 were used. So use the following program to compress the initial 601 spectra data:
Wavelet function Daubechies2 was applied to compress the matrix that contained 65 samples and 601 variables. The spectral signal was used as the input to a group of filters, and then the small coefficients were substituted with zeros. The high frequency signal contained mass noise and repeated information, and it could barely give any help to contribute models. The approximation parts at a large scale and remain the utmost energy of the source signals were used as final components.
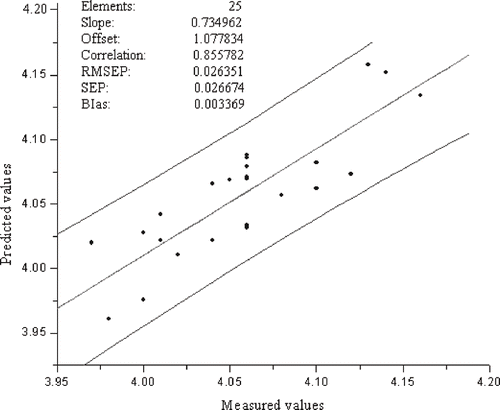
After wavelet transforms, the original matrix were replaced by the 65 samples and 152 data points. The PLS model was established using the same method described in 3.3. In calibration part, SEC is 0.026, R is 0.852 and RMSEC is 0.026. And in validation part, SECV is 0.032, R is 0.842 and RMSECV is 0.031. The PLS calibration model is presented in . When the model was used to predict the 25 unknown samples, prediction result (r = 0.856), SEP 0.027, and the RMSEP is 0.026, as shows.
Figure 6 Vis/NIR calibration results of acidity for 40 samples after wavelet transform.
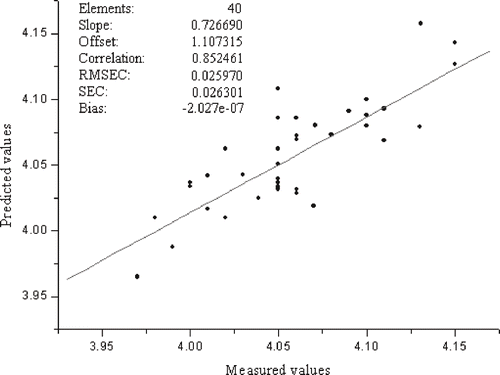
Figure 7 Vis/NIR prediction results of acidity for 25 unknown samples after wavelet transform.
CONCLUSIONS
Vis/NIR spectrum technique with the advantage of low cost, high efficiency, fast analytical speed, ease of operation, non-destruction and limited preparation, has been widely used in many fields. The pivotal step for spectroscopy technique is how to extract quantitative data from mass spectral curves and eliminate spectral interferences, including varying backgrounds and noise as more as possible. This paper proposed method of wavelet transform to preprocess the original spectra, and then PLS was used to establish the calibration model. It showed an excellent prediction performance better than only using PLS. The prediction results showed that correlation coefficient was 0856, SEP was 0.027, and the RMSEP was 0.026. Thus, it could be concluded that wavelet transform combined with PLS was an available alternative for prediction the acidity of strawberry based on Vis/NIR spectroscopy.
ACKNOWLEDGMENTS
This study was supported by the National Science and Technology Support Program (2006BAD10A09, 2006BAD10A04), Teaching and Research Award Program for Outstanding Young Teachers in Higher Education Institutions of MOE, PRC.
Related Research Data
REFERENCES
- Cen , H.Y. and He , Y. 2007 . Theory and Application of Near Infrared Reflectance Spectroscopy in Determination of Food Quality . Trends in Food Science & Technology , 18 ( 2 ) : 72 – 83 .
- Creaser , C.S. and Davies , A.M.C. 1988 . “ Chemometrics and Data Analysis ” . In Analytical Applications of Spectroscopy , 403 – 480 . London : Royal Soc. Chem .
- Naes , T. and Isaksson , T. 1990 . Locally Weighted Regression and Scatter Correction for Near-infrared Reflectance Data . Anal.Chem. , 62 : 664 – 673 .
- Holst , H. 1992 . Comparison of Different Calibration Methods Suited for Calibration Problems with Many Variables . Appl. Spec. , 46 ( 12 ) : 1780 – 1784 .
- He , Y. , Song , H.Y. , Garcia , P.A. and Hernandez , G.A. 2005 . A New Approach to Predict N, P, K and OM Content in a Loamy Mixed Soil by Using Near Infrared Reflectance Spectroscopy . Lecture Notes in Computer Science , 3644 : 859 – 867 .
- He , Y. , Zhang , Y. and Xiang , L.G. 2005 . Study of Application Model on BP Neural Network Optimized by Fuzzy Clustering . Lecture Notes in Computer Science , 3789 : 712 – 720 .
- Fu , X.G. , Yan , G.Z. , Chen , B. and Li , H.B. 2005 . Application of Wavelet Transforms to Improve Prediction Precision of Near Infrared Spectra . J. Food Eng. , 69 : 461 – 466 .
- Cen , H.Y. , He , Y. and Huang , M. 2006 . Fast Measurement of Soluble Solids Contents and Acidity in Orange Juice Using Chemometrics and Vis/NIRS . J. Agric. Food Chem. , 54 : 7437 – 7443 .
- Haalan , D.M. and Thomas , E.V. 1988 . Partial Least Squares Method for Spectral Analysis . Anal.Chem. , 60 : 1193 – 1202 .
- Walczak , B. and Massart , D.L. 1997 . Wavelets-something for Analytical Chemistry . TrAC-Trends Anal. Chem, , 16 : 451 – 463 .
- Jetter , K. , Depczynski , U. , Molt , K. and Niemöller , A. 2000 . Principles and Applications of Wavelet Transformation of Chemometrics . Anal. Chim. Acta , 420 : 169 – 180 .
- Shao , X.G. , Pang , C.Y. and Su , Q.D. 2000 . A Novel Method to Calculate the Approximate Derivative Photoacoustic Spectrum Using Continuous Wavelet Transform . Fresen. J. Anal. Chem , 367 : 525 – 529 .
- Dinc , E. , Baleanu , D. and Ustundag , O. 2003 . An Approach to Quantitative Two-component Analysis of a Mixture Containing Hydrochlorothiazideand Spironolactone in Tablets by One-dimensional Continuous Daubechies and Biorthogonal Wavelet Analysis of UV-spectra . Spectrosc. Lett. , 36 : 341 – 355 .
- Dinc , E. and Baleanu , D. 2003 . Multidetermination of Thiamine HCl and Pyridoxine HCl in Their Mixture Using Continuous Daubechies and Biorthogonal Wavelet Analysis . Talanta , 59 : 707 – 717 .
- Shao , X.G. , Leung , A.K.M. and Cau , F.T. 2003 . Wavelet:A New Trend in Chemistry . Acc. Chem. Res. , 36 : 276 – 283 .
- Mittermayr , C.R. , Tan , H.W. and Brown , S.D. 2001 . Robust Calibration with Respect to Background Variation . Appl. Spectrosc , 55 : 827 – 833 .
- Tan , H.W. and Brown , S.D. 2002 . Wavelet Analysis Applied to Removing Nonconstant, Varying Spectroscopic Background in Multivariate Calibration . J. Chemometrics , 16 : 228 – 240 .
- Shao , X.G. , Gu , H. , Cai , W.S. and Pan , Z.X. 1999 . Studies on Data Compression of 1-D NMR Spectra Using Wavelet Transform . Spectroscopy and Spectral Analysis , 19 ( 2 ) : 139 – 141 .
- Chen , B. , Fu , X.G. and Lu , D.L. 2002 . Improvement of Predicting Precision of Oil Content in Instant Noodles by Using Wavelet Transforms to Treat Near-infrared Spectroscopy . J. Food Eng. , 53 : 373 – 376 .
- Zhu , S.P. , Wang , Y.M. and Ch , Zhang, X. 2003 . Wavelet Denoising Theory and Its Application in Wheat Protein Content Prediction with Near Infrared Spectroscopy Analysis . Journal of Southwest Agricultural University , 25 ( 6 ) : 522 – 525 .
- Wang , F. , Chen , D. and Shao , X.G. 2004 . Application of Wavelet Transform and Partial Least Square in Prediction of Common Chemical Compositions in Tobacco Samples . Tobacco Science &Technology Inspection & Standard , 3 : 31 – 34 .
- Ying , Y.B. , Liu , Y.D. , Wang , J.P. , Fu , X.P. and Li , B.Y. 2005 . Fourier Transform Near-Infrared Determination of Total Soluble Solids and Available Acid in Intact Peaches . Trans. ASAE. , 48 : 229 – 234 .
- Martens , H. and Naes , T. 1989 . Multivariate Calibration , New York : John Wiley & Sons Inc .
- Naes , T. , Isaksson , T. , Fearn , T. and Davies , T. 2002 . A User-friendly Guide to Multivariate Calibration and Classification , UK : NIR Publications .
- Qi , X.M. , Zhang , L.D. and Du , Z.L. 2003 . Quantitative Analysis Using NIR by Buiding PLS-BP Model . Spectroscopy and Spectral Analysis , 23 ( 5 ) : 870 – 872 .