Abstract
The main aim of this study was to investigate the influence of two different levels (high and low) of Ca and P (calcium and phosphorous) content, residual lactose, and salt-to-moisture (S/M) ratio on viscoelastic properties of eight different process cheeses. Frequency sweep was performed at 750 Pa on all experimental process cheese samples to determine the power-law model parameters. Process cheeses with high Ca and P content and high S/M ratio were significantly harder (P < 0.05) (higher storage and loss modulus, and lower creep and recovery compliance) compared to low Ca and P content and low S/M ratio process cheeses. However, no significant difference was observed (P > 0.05) for power-law parameters between high/low residual lactose content process cheese samples. Six-element Kelvin-Voigt model was used to predict the creep compliances for eight different process cheeses. This model described the affect of above treatment's retardation spectra (compliances, viscosities, and retardation times) obtained from creep tests. Both of these measurements indicated the similar trend on linear viscoelastic properties for eight different process cheeses.
INTRODUCTION
Process cheese is frequently consumed as an ingredient with other food items. It is available in several forms, such as slices, blocks, shreds, and sauces for end use. Currently more than 2.24 billion pounds of process cheese are produced annually.[Citation1] Natural cheese is the major ingredient in process cheese manufacturing. Nearly 50% to 80% of natural cheese is used in the manufacturing process depending on the type of process cheese.[Citation2] Process cheese functional and rheological properties completely controlled by the amount and type of natural cheese, emulsifying salts, and other ingredients added during manufacturing.[Citation3,Citation4] Proper selection of natural cheese during formulation is important factor to obtain the desired viscoelastic characteristics in the final process cheese. Numerous researchers have highlighted that physicochemical characteristics of a natural cheese such as calcium and phosphorous content, residual lactose, and pH considerably influence the functional and rheological properties, especially viscoelastic characteristics of process.[Citation3–8]
Viscoelasticity in cheese deals with the combined effect of elastic or solid like and viscous or liquid like under wide range of conditions. According to Ferry,[Citation9] the simplest form of viscoelastic behavior is linear viscoelasticity, where measured properties are independent of magnitude of the input variable. The properties for any viscoelastic materials can be characterized using stress relaxation (constant strain) test, dynamic oscillatory test, and creep compliance (constant stress) test.[Citation10] During short time, the cheese behavior is mainly elastic, where a test piece regains it original shape after the applied stress is removed. However, during long time, the cheese behavior is more viscous than elastic, where most of the deformation remains after the stress is removed.[Citation11]
Venugopal and Muthukumarappan[Citation12] studied stress relaxation characteristics during heating and cooling of Cheddar cheese containing various fat and moisture contents. In their study,[Citation12] they observed that Peleg model and Maxwell model containing eight elements well described the stress relaxation behavior of melted Cheddar cheeses. They further recommended the stress relaxation test as a tool to study cheese viscoelasticity. Joshi et al.[Citation13] also assessed stress relaxation characteristics on various level (high and low protein content) of process cheeses made from Cheddar cheeses manufactured with ultra filtered and condensed milk. They observed that higher values of viscoelasticity were attributed to higher protein and lower fat content compared to lower protein and higher fat content in the process cheeses. Subramanian et al.[Citation14] studied linear viscoelastic properties of regular, and reduced fat pasteurized process cheese during heating and cooling. They observed that dynamic (stress and frequency), transient (creep and recovery) rheological properties, and Maxwell model elements (viscosity distribution against relaxation time) were higher for the reduced fat cheese compared to the regular fat process cheese. This was may be due to the fat content, and more compact protein matrices in reduced fat cheese compared to regular fat cheese.
Presence of calcium and phosphorous, residual lactose and salt-to-moisture (S/M) ratio at different levels in cheese play an important role in determining its functionality.[Citation15–18] Calcium (Ca) and phosphorous (P) act together and form cross-links within and among casein micelles during coagulation during cheese manufacturing, which in turn reduce the meltability.[Citation18, Citation19] Very recently, Kapoor et al.[Citation20] suggested that process cheeses manufactured from high/low Ca and P content, residual lactose, and S/M ratio natural cheeses affects the process cheese melting and others viscoelastic characteristics, like DSR (dynamic stress rheometer) melt temperature, viscous modulus (G”), and RVA (rapid visco analyzer) hot apparent viscosity. They suggested that there was a significant increase in viscoelastic properties of the process cheeses prepared from higher Ca and P content, and S/M ratio natural cheeses.
Many scientific literatures are available on Cheddar and Mozzarella cheese viscoelastic characteristics, but very little research was done on viscoelastic evaluation of process cheeses, especially the study on process cheese with varying level (high/low) of Ca and P, residual lactose, and S/M ratio. The objectives of this study were to investigate the effects of Ca and P content (high/low), residual lactose (high/low) and salt-to-moisture (S/M) ratio on stress and frequency sweep, and power-law behaviors of process cheese. Mechanistic model (Kelvin-Voigt six-element model) was also used to characterize the creep behavior of process cheese at 20°C.
MATERIALS AND METHODS
Process Cheese Manufacturing
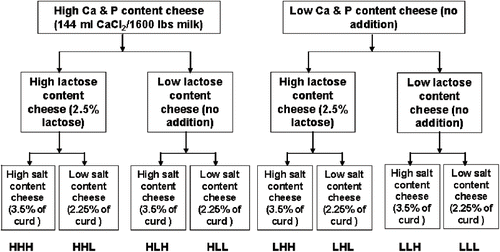
Four different treatments of Cheddar cheese with two levels (high—addition of 144 ml CaCl2/1600lbs of milk, and low—no addition) of calcium (Ca) and phosphorus (P), and two levels (high—addition of 2.5% lactose, and low—no addition) of residual lactose were manufactured as described by Upreti and Metzger.[Citation21] Each treatment was subsequently split prior to the salting step of cheese manufacturing and salted at two levels (high—addition of 3.5% salt, and low—2.25% salt) for a total of eight treatments. Complete experimental design for Cheddar cheese preparation is shown in . The eight treatments included: High Ca and P, High lactose, High S/M (HHH); High Ca and P, High lactose, Low S/M (HHL); High Ca and P, Low lactose, High S/M (HLH); High Ca and P, Low lactose, Low S/M (HLL); Low Ca and P, High lactose, High S/M (LHH); Low Ca and P, High lactose, Low S/M (LHL); Low Ca and P, Low lactose, High S/M (LLH); and Low Ca and P, Low lactose, Low S/M (LLL). At the end of two months of ripening, each treatment for Cheddar cheese was used to manufacture process cheese food using a Blentech™ twin-screw (BTS) process cheese cooker blender (Blentech Corporation, Rohnert Park, CA). All process cheese food formulations were balanced for moisture, fat, and salt with the values for moisture (43.5%), fat (25%), and salt (2%), respectively. The prepared eight different process cheeses have been indicated by the same nomenclature that was used for eight different natural cheese treatments from where the process cheeses were manufactured (total in 3 replications) as mentioned above.
Figure 1 Experimental design of Cheddar cheese preparation for process cheese manufacturing.
Among other ingredients non-fat dried milk (∼7%) (low heat) (Dairy America™, Fresno, CA), anhydrous butter oil (∼0.15%) (Mid-America Farms, Springfield, MO), water (∼18%), and trisodium citrate (2.5%) (Archer Daniels Midland Company, Decatur, IL) as emulsifier salt were used. Average formulation for eight different process cheeses is shown in . All of these ingredients along with natural Cheddar cheese were mixed at 75 rpm for 30 min at room temperature. The temperature of the pre-blend was increased to 80°C in 5 min and held for an additional 5 min. The auger speed was 140 rpm during the heating and the holding period of the manufacturing process. The cooked process cheeses were filled hot in 1 kg boxes and transferred to a cold room (4°C) after 15 min. All the cooked process cheeses were stored at 4°C until further analysis was completed.
Table 1 Average formulations with different ingredients for eight different process cheeses
Chemical Composition
The moisture content of process cheese was analyzed by using a vacuum oven as described by Bradley and Vanderwarn.[Citation22] Fat content was determined using the Mojonnier method.[Citation23] Salt content was measured using a Corning Chloride Analyzer 926. pH was measured with a Corning pH/ion meter (Model 450, Corning Glass Works, Medfield, MA) method as described by Kapoor and Metzger.[Citation24] Total calcium and total phosphorous of process cheese was determined by the method described by Brooks et al.[Citation25] and AOAC 991.25,[Citation26] respectively. Lactose content was determined by using HPLC as described by Zeppa et al.[Citation27]
Cheese Sample Preparation
Process cheese samples were prepared by cutting a thin slice (∼ 2.0 mm) using a food slicer (Model 1042W, The Rival Co. Kansas City, MO). Cylindrical cheese samples of diameter 28.3 mm were cut with help of a cork borer and a cylindrical mallet from the same slice. The specimens were placed in a covered Petri plate to minimize moisture loss and kept inside the refrigerator at 4°C – 6°C until testing. Before running the actual test, the specimen along with Petri plate was placed at room temperature for 15 min to bring up the temperature around 20°C. The samples were then subjected to stress sweep, frequency sweep, and creep test respectively.
Stress and Frequency Sweep
Stress sweep experiment for process cheese was carried out using a ATS Rheosystems rheometer (Rheologica Instruments Inc., NJ) with parallel plate geometry of diameter 30 mm at 20°C. Fine sandpaper (400 grits, wet or dry, 3M) was glued to the upper plate of the rheometer to prevent sample slippage. During sample loading, it was placed on the lower plate and upper plate was brought in contact over the sample. Exposed sample edge was then coated with vegetable oil (Midwest Country Fare, Des Moines, IA) to minimize drying during measurements. Stress sweep was performed at a frequency of 1.5 Hz, and with a stress range starting from 1Pa to 3000Pa at 20°C. Before starting of actual test preshear of samples were done at 11 s−1 for 20 sec, followed by 25 sec equilibrium time. Maximum stress limit for linear viscoelastic region was obtained as 750 Pa in stress sweep. In frequency sweep measurements, 750Pa stress (maximum stress limit for linear viscoelastic region obtained from stress sweep) was used with the frequency range from 0.1Hz to 100Hz at 20°C.
Creep Test
Quantification of creep behavior of food materials has been traditionally based on generalized Kelvin-Voigt model with discrete number of elements.[Citation28] The generalized equation for Kelvin-Voigt model is stated below,
where, J(t) is the total creep compliance at time t; J0 is the instantaneous rigidity compliance; J1, J2, … Jn are the retarded compliances; τ1, τ2, … τn are the retardation times; and ηv is the Newtonian viscosity.
Creep test was carried out using the same procedure as stated in the stress and frequency sweep section. A constant shear stress (σ) of 750 Pa (LVR obtained from stress sweep test) was applied on the process cheese samples and resultant strain was measured as a function of time, γ(t) for first 150 sec. The data obtained were expressed in terms of instantaneous shear creep compliance (Jt), this can be defined as:
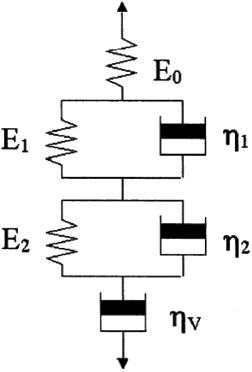
At the end of 150 sec, the stress was removed and γ(t) was measured for second 150 sec of recovery. For our experiment we analyzed γ(t) versus σ for first 150 sec during creep. The data were then best fitted into six-element Kelvin-Voigt mechanical model containing springs and dashpots (). This mechanistic model was used to facilitate the physico-mechanical interpretation of process cheese rheological characteristics. The viscoelastic parameters of six-element Kelvin-Voigt mechanical model were obtained by using SIGMAPLOT™ (Version 8) nonlinear regression analysis.
Figure 2 Six-element linear viscoelastic (Shear stress = 750 Pa) mechanical model used for describing creep behavior of process cheeses. E0 = Instantaneous elastic modulus of free spring; E1 and E2 = Retarded modulus of the first and second Kelvin-Voigt element respectively; η1 and η2 = Retarded viscosity of the first and second Kelvin-Voigt element respectively; ηv = Newtonian viscosity of the free dashpot.
Statistical Analysis
Observations for all the parameters were done in duplicate, and the data were analyzed using a split-split-plot design with Ca and P content (high/low), lactose (high/low) and salt-to-moisture (S/M) ratio (high/low) as the whole plot factors. PROC GLM procedure of SAS software[Citation29] was used to find LSD means with minimum significance established at P < 0.05 level.
RESULTS AND DISCUSSION
Process Cheese Composition
The chemical composition of eight different process cheeses is presented in . The pH of process cheeses was observed range from 5.65 to 6.16. Process cheeses with high Ca and P content (HHH, HHL, HLH, and HLL), and high S/M ratio (HHH, HLH, LHH, and LLH) were significantly higher pH values than low Ca and P content (LHH, LHL, LLH, and LLL) and low S/M ratio (HHL, HLL, LHL, and LLL) process cheeses. No significant difference (P > 0.05) was found for moisture and fat content among the cheeses, which ranges between 42.9% to 43.57%, and 25.18% to 25.65%, respectively. Total Ca and P contents for HHH (0.56% and 0.39%), HHL (0.53% and 0.38%), HLH(0.56% and 0.39%) and HLL(0.56% and 0.39%) were significantly higher (P<0.05) than that of LHH (0.48% and 0.35%), LHL (0.48% and 0.35%), LLH (0.46% and 0.34%) and LLL (0.46% and 0.33%) process cheeses. Significant difference (P < 0.05) was also observed for lactose content among eight different process cheeses.
Table 2 Composition of process cheese
Stress and Frequency Sweep
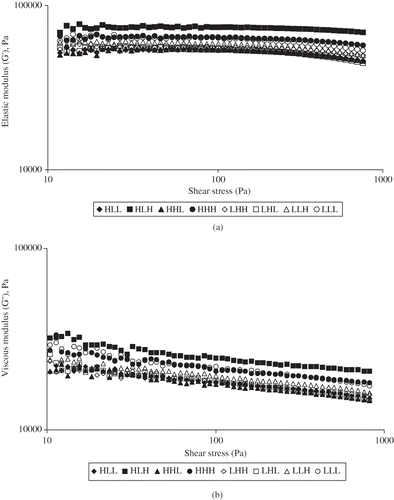
Constant G' and G” (region of linear viscoelasticity) of eight different process cheeses in stress sweep is illustrated in . The highest shear stress for the linear region was observed about 750Pa for all process cheese samples. Process cheese with high Ca and P content (HHH, HHL, HLH, and HLL), high residual lactose content (HHH, HHL, LHH, and LHL), and high S/M ratio (HHH, HLH, LHH, and LLH) showed higher G′ and G″ values than that of low Ca and P content (LHH, LHL, LLH, and LLL), low residual lactose content (HLH, HLL, LLH, and LLL), and low S/M ratio (HHL, HLL, LHL, and LLL) cheeses.
Figure 3 Region of linear viscoelasticity (a) G' and (b) G” for process cheeses at 20°C.
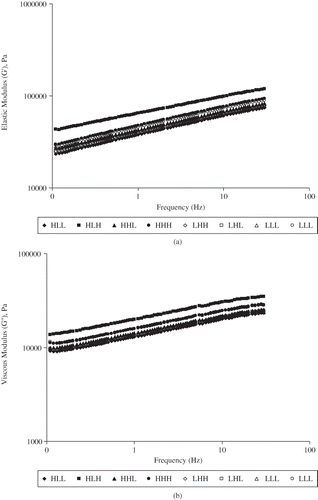
The region of linear viscoelasticity in frequency sweep for the process cheese samples were studied and in illustrated in . Similar observation like stress sweep was also noticed in case of frequency sweep. High Ca and P content (HHH, HHL, HLH, and HLL), high residual lactose content (HHH, HHL, LHH, and LHL), and high S/M ratio (HHH, HLH, LHH, and LLH) cheeses showed greater G′ and G″ values compare to low Ca and P content (LHH, LHL, LLH, and LLL), low residual lactose content (HLH, HLL, LLH, and LLL), and low S/M ratio (HHL, HLL, LHL, and LLL) process cheeses (). Moreover, both elastic (G′) and viscous (G″) modulus of eight different process cheeses were dependent on frequency. With the increase in frequency at constant shear stress of 750Pa, G′ and G″ values were also increased linearly. It was observed that maximum frequency for linear region among all process cheeses was 30 Hz.
Figure 4 Frequency dispersion of (a) elastic and (b) viscous modulus at 20°C for process cheese.
Above observations for stress and frequency sweep in process cheeses were may be due to the presence of lower bound calcium in protein matrices, and higher proteolytic changes in low Ca and P, and low S/M ratio cheeses as described by Upreti et al.[Citation30,Citation31]
Dynamic Spectra by Using Power-Law Parameters
Variation of elastic (G′) and viscous (G″) modulus within the linear viscoelastic region (at shear stress = 750Pa) is shown in the frequency dispersion graphs for all process cheese treatments (). Individual straight lines had set of data with different slopes, which were fitted by a power-law equation as written below:
where a: low-frequency storage or elastic modulus, kPa; b: power-law index for storage or elastic modulus; c: low-frequency loss or viscous modulus, kPa; and d: power-law index for loss or viscous modulus.
Power-law model parameters for eight different process cheeses are presented in . It was observed that at constant temperature of 20°C the low frequency elastic (G′) and viscous (G″) modulus (a and c in Equationequation 3(3)) for high Ca and P content with high S/M ratio cheeses (HHH and HLH) were significantly higher (P < 0.05) than low Ca and P content with high/low S/M ratio content, and high Ca and P content with low S/M ratio content cheeses (LHH, LHL, LLH, LLL, HHL, and HLL). However, the power-law indices [b and d in EquationEq (3)
(3)] for G′ and G″ were higher for high/low Ca and P content with low S/M ratio content cheeses (LLL, HLL, and LHL) than high Ca and P content with high S/M ratio content cheeses (HHH, and HLH). This is due to the fact that calcium and phosphorous acts as a buffering substances and forms a linkage within and among casein micelles, salt-to-moisture (S/M) ratio in the system also alters protein-protein interactions, and variation in pH values (5.65 to 6.16) may affects the rheological properties.[Citation19,Citation32–35] It was also observed that R2 values in power-law model for all the process cheeses were 0.99 ().
Table 3 Power-law model parameters for process cheeses
Creep and Recovery Strain Profiles
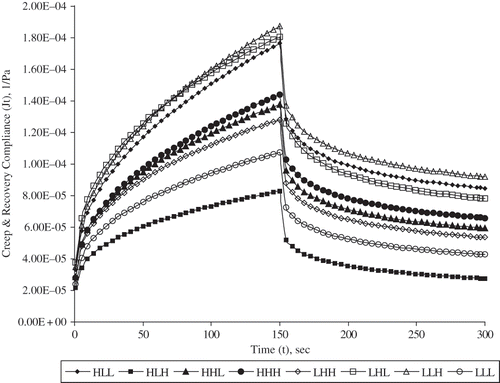
The instantaneous creep (first 150 sec), and recovery (second 150 sec) compliance (Jt) data at 20°C are presented in . It has been observed for all process cheeses that there was no full 100% recovery of strain at the end of second 150 sec. This showed that viscoelastic behavior of process cheese, i.e. rather than being fully elastic in nature at 20°C. The instantaneous creep and recovery compliances of low Ca and P content and low S/M content process cheeses (LLH, LHL, and HLL) were higher compared to other process cheeses. High Ca and P content and high S/M content (HLH) cheese showed the least instantaneous creep and recovery compliances profiles among all other cheeses.
Figure 5 Creep and recovery compliance for process cheeses at 20°C (Shear stress = 750 Pa).
Interpretation of Creep Compliance Using a Mechanistic Model
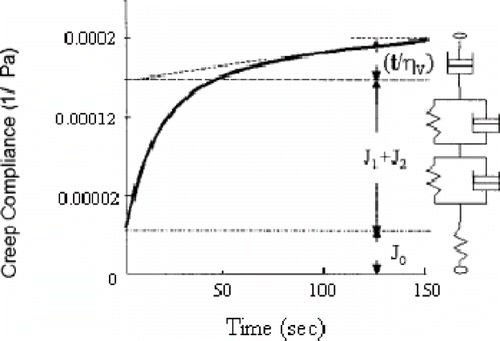
Foods and biomaterials generally exhibit two or more retardation times when subjected to constant stress. This phenomenon can be explained by six-element Kelvin-Voigt mechanical model.[Citation36] We used a six-element Kelvin-Voigt mechanical model as presented in , and found to be best fit compared to other simple models like three, four and five elements in designing the experimental creep data as given in EquationEquation 1(1). Similar six-element model had been used by Ma et al.[Citation37] and Subramanian et al.[Citation38] to describe the creep compliances (Jt) of reduced-fat and full-fat Cheddar and Mozzarella cheeses. The typical creep curve and corresponding six- element mechanical model are shown in . Three segments of the creep curve, Hookean or elastic (J0), Kelvin- Voigt or retardation elasticity (J1 and J2), and Newtonian or viscous (ηv) elements are shown in . J1 and J2 retarded compliances represented the principal components of viscoelastic behavior of different process cheese.
Figure 6 Typical creep response showing correspondence to six-element mechanical model and Equation (4.4) J0 = Instantaneous rigidity compliance, J1 and J2 = retarded compliance, ηV = Newtonian viscosity, t = time.
The instantaneous shear creep compliance (Jt) as a function of time (t) for six-element model is defined by EquationEq. (4)(4):
Each parameters of the equation is described in except τ1 and τ2, which are retardation time of first and second Kelvin-Voigt element respectively.
The viscoelastic parameters were calculated for eight different treatments of process cheese and presented in . Process cheeses with low Ca and P content (LHL and LLH) and low S/M ratio content (HLL) showed significantly (P < 0.05) higher instantaneous compliance (J0) values than other process cheeses. Where as, high Ca and P content, high lactose, and high S/M ratio content (HHH) process cheese had lowest J0 value. Instantaneous elastic compliance (J0) may be related to the undistributed protein network structure.[Citation39] Low Ca and P content (LHL and LLH) and high Ca and P content (HLL) process cheeses with high J0 values indicated that it was less rigid than other cheeses. However, high Ca and P content, high residual lactose, and high S/M ratio process cheese (HHH) had smaller J0 value indicated it was more rigid than the others. This may due to the fact that high Ca and P content with high S/M ratio interacts with polypeptide linkage in casein network, which makes it relatively tougher from other process cheeses. Moreover, Newtonian viscosity of the free dashpot (ηv) attributed to the breakdown of protein network structure.[Citation40] Cheese with high Ca and P content and high S/M ratio content (HLH) observed for higher ηv value, and low S/M content (HLL) observed for lowest ηv value. No significant difference was observed for ηv values among other process cheeses. Larger ηv for HLH indicated greater resistance to flow than that of HLL process cheese.
Table 4 Viscoelastic parameters for six-element mechanical model in creep test for process cheeses at 20°C
Overall, higher values were observed for J0, and retarded compliances (J1 and J2) by low Ca and P content, and low S/M ratio content than that of high Ca and P content and high S/M content process cheeses. Retarded viscosities (η1 and η2) decrease from high Ca and P content and high S/M content to low Ca and P content and low S/M content. No significant difference was observed in different viscoelastic parameters for high/low residual lactose content process cheese. This was mainly due to the presence of higher bound calcium in cheese protein matrices, and lower proteolytic changes in high Ca and P content, and high S/M ratio process cheeses as described by Upreti et al.[Citation30, Citation31] In general, the model, R2 = 0.99, fit the experimental data very well.
CONCLUSIONS
Effect of Ca and P content, residual lactose, and S/M ratio on the model parameters of process cheese linear viscoelastic properties was studied and the results indicated that stress limit for linear viscoelastic behavior of all process cheeses was 750Pa at 20°C. Within this linear viscoelastic region, process cheeses with high Ca and P content, high lactose content, and S/M ratio were higher G′ and G″ values than low Ca and P content, low residual content, and low S/M ratio cheeses for both stress and frequency sweeps. Moreover, Power-law parameters such as “a” and “c” for high Ca and P content, and high S/M ratio cheeses were higher than that of low Ca and P content, and low S/M ratio process cheeses. However, the indices “b” and “d” were higher for low Ca and P content, and low S/M ratio cheeses compare to high Ca and P content, and high S/M ratio process cheeses.
Viscoelasic parameters such as instantaneous compliance (J0), retarded compliances (J1 and J2), Newtonian viscosity (ηV), and retardation time (τ) from six-element Kelvin-Voigt model were useful to explain structural characteristics and changes due to applied stress on process cheese. Creep test differentiated the viscoelastic properties between high/low Ca and P content and high/low S/M ratio content process cheeses. These rheological studies revealed that high/low Ca and P content and high/low S/M ratio process cheeses has different effects in improving the casein micelle structure during process cheese manufacturing.
ACKNOWLEDGMENTS
This research undertaking is based upon work supported and funded by Dairy Management Inc. (DMI), and Agricultural Experimental Station (AES), South Dakota State University, Brookings, SD, USA.
Notes
2. United Food and Drug Administration. 21 CFR, Part 133.169 to 133.180. USFDA, Department of Health and Human Services: Washington, DC, 2006.
REFERENCES
- International Dairy Foods Association . 2006 . Dairy facts. Milk Industry Foundation , Washington, DC : IDFA .
- 2. United Food and Drug Administration. 21 CFR, Part 133.169 to 133.180. USFDA, Department of Health and Human Services: Washington, DC, 2006.
- Thomas , M.A. 1973 . The Manufacture of Processed Cheese — Scientific Principles , 1st , Richmond, , N.S.W. Australia : New South Wales Department of Agriculture .
- Zehren , V.L. and Nusbaum , D.D. 2000 . Processed Cheese , 2nd , Madison, WI : Cheese Reporter Publishing Co. Inc .
- Templeton , H L. and Sommer , H.H. 1930 . Some observations on processed cheese . Journal Dairy Science , 13 : 203 – 220 .
- Barker , C.R. 1947 . Practical suggestions on the manufacture of process cheese . National Butter and Cheese Journal , 38 : 42 44 – 46 .
- Olson , N.F. and Price , W.V. 1958 . A melting test for pasteurized process cheese spreads . Journal of Dairy Science , 41 : 999 – 1000 .
- Meyer , A. 1973 . Processed Cheese Manufacture , London : Food Trade Press Ltd .
- Ferry , J.D. 1980 . Viscoelastic properties of polymers , 3rd , New York : John Wiley & Sons .
- Mitchell , J.R. 1980 . The rheology of gels . Journal of Texture Studies , 11 : 315 – 337 .
- Walstra , P. and Peleg , M. 1991 . General considerations , Bull. 268 Brussels, , Belgium : International Dairy Federation .
- Venugopal , V. and Muthukumarappan , K. 2003 . Rheological properties of Cheddar cheese during heating and cooling . International Journal of Food Properties , 6 ( 1 ) : 99 – 114 .
- Joshi , N.S. , Jhala , R.P. , Muthukumarappan , K. , Acharya , M.R. and Mistry , V.V. 2004 . Textural and rheological properties of process cheese . International Journal of Food Properties , 7 ( 3 ) : 519 – 530 .
- Subramanian , R. , Muthukumarappan , K. and Gunasekaran , S. 2006 . Linear Viscoelastic Properties of Regular- and Reduced-Fat Pasteurized Process Cheese during Heating and Cooling . International Journal of Food Properties , 9 ( 3 ) : 377 – 393 .
- Strandholm , J.J. , Prochnow , R.R , Miller , M.S , Woodford , L.E and Neunaber , S.M. Method for controlling melting properties of process cheese . Kraft Inc. United States Patent, US 4885183 . 1989 .
- Aizawa , S. and Yoneda , Y. . Preparation of melt-resistant process cheese . Comm. of XXIII Intrl. Dairy Congress, Vol. II, 537 . October 8–12 1990 , Montreal. Brussels, , Belgium : International Dairy Federation .
- McMahon , D.J. , Oberg , C.J. and McManus , W. 1993 . Functionality of Mozzarella cheese . Australian Journal of Dairy Technology , 48 : 99 – 104 .
- Lucey , J.A. and Fox , P.F. 1993 . Importance of calcium and phosphate in cheese manufacture: a review . Journal of Dairy Science , 76 : 1714 – 1724 .
- Walstra , P. 1990 . On the stability of casein micelles . Journal of Dairy Science , 73 : 1965 – 1979 .
- Kapoor , R. , Metzger , L.E. , Biswas , A.C. and Muthukumarappan , K. 2006 . Effect of natural cheese characteristics on process cheese properties . Journal of Dairy Science , 90 : 1625 – 1634 .
- Upreti , P. and Metzger , L.E. 2006 . Influence of calcium and phosphorous, lactose, and salt-to-moisture ratio on Cheddar cheese quality: Manufacture and composition . Journal of Dairy Science , 89 : 420 – 428 .
- Bradley , R.L. Jr. and Vanderwarn , M.A. 2001 . Determination of moisture in cheese and cheese products . AOAC , 84 : 570 – 592 .
- Atherton , H.V. and Newlander , J.A. 1977 . “ Tests for fat: Babcock, Gerber and Mojonnier ” . In Chemistry and Testing of Dairy Products , 4th , 71 – 116 . Westport, CT : AVI Publ. Co., Inc .
- Kapoor , R. and Metzger , L.E. 2004 . Evaluation of salt whey as an ingredient in process cheese . Journal of Dairy Science , 87 : 1143 – 1150 .
- Brooks , I.B. , Luster , G.A. and Easterly , D.G. 1970 . A procedure for the rapid determination of the major cations in milk by atomic absorption spectrophotometry . Atomic Absorption Newsletter 9, No. , 4 : 93 – 94 .
- Association of Official Analytical Chemists, International . 1995 . Official Methods of Analysis , 16th , Arlington, VA : AOAC .
- Zeppa , G. , Conterno , L. and Gerbi , V. 2001 . Determination of organic acids, sugars, diacetyl, and acetoin in cheese by high-performance liquid chromatography . Journal of Agriculture Food Chemistry , 49 : 2722 – 2726 .
- Purkayastha , S. , Peleg , M. and Normand , M.D. 1984 . Presentation of creep curves of solid biological materials by a simplified mathematical version of the generalized Kelvin-Voigt model . Rheologica Acta. , 23 : 556 – 563 .
- SAS® . 1999 . Users' guide: Statistics , Version 8.0 , Cary, NC : SAS Inst. Inc .
- Upreti , P. , Metzger , L.E. and Hayes , K.D. 2006 . Influence of calcium and phosphorus, lactose, and salt-to-moisture ratio on Cheddar cheese quality. Changes in residual sugars and water soluable organic acids during ripening . Journal of Dairy Science , 89 : 429 – 443 .
- Upreti , P. , Metzger , L.E. and Hayes , K.D. 2006 . Influence of calcium and phosphorus, lactose, and salt-to-moisture ratio on Cheddar cheese quality. Proteolysis during ripening . Journal of Dairy Science , 89 : 444 – 453 .
- Lucey , J.A. and Fox , P.F. 1993 . Importance of calcium and phosphate in cheese manufacture: a review . Journal of Dairy Science , 76 : 1714 – 1724 .
- Guinee , T.P. and Fox , P.F. 1993 . “ Salt in cheese: Physical, chemical, and biological aspects ” . In Cheese: Chemistry, Physics and Microbiology , 2nd , Edited by: Fox , P.F. Vol. 1 , 257 – 269 . 295 – 298 . London : Chapman and Hall .
- Marchesseau , S , Gastaldi , E. , Lagaude , A. and Cuq , J.L. 1997 . Influence of pH on protein interactions and microstructure of process cheese . Journal of Dairy Science , 80 : 1483 – 1489 .
- Pastorino , A.J. , Hansen , C.L. and McMahon , D.J. 2003 . Effect of salt on structure-function relationships of cheese . Journal of Dairy Science , 86 : 60 – 69 .
- Mohsenin , N.N. 1986 . “ Rheology and texture of food materials ” . In Physical Properties of Plant and Animal Materials: Structure, Physical Characteristics and Mechanical Properties , rev , 383 – 480 . New York, NY : Gordon and Breach, Sci. Publ., Inc .
- Ma , L. , Drake , M.A. , Barbosa-Cánovas , G.V. and Swanson , B.G. 1997 . Rheology of full-fat Cheddar cheeses as related to type of fat mimetic . Journal of Food Science , 62 ( 4 ) : 748 – 752 .
- Subramanian , R. , Muthukumarappan , K. and Gunasekaran , S. 2003 . Effect of methocel as a water binder on the linear viscoelastic properties of Mozzarella cheese during early stages of matuaration . Journal of Texture Studies , 34 : 361 – 380 .
- Lynch , M.G. and Mulvihill , D.M. 1994 . The influence of caseins on the rheology of carrageenan gels . Food Hydrocolloids , 8 : 317 – 329 .
- Lynch , M.G. and Mulvihill , D.M. 1994 . The influence of caseins on the rheology of τ-carrageenan gels . Food Hydrocolloids , 8 : 317 – 329 .