Abstract
Traditional (Basmati 370) and developed (Pusa Basmati 1) varieties were characterized on the basis of biochemical and cooking properties. Electrophoregram of glutelin fraction gave clear distinction to Basmati 370 having single distinct subunit of 20 kDa while Pusa Basmati 1 had multiple bands of varying molecular weights. The coefficient of dimensional changes distinguished the two genotypes clearly. Developed Basmati rice revealed shorter cooking time, higher elongation ratio, and lower solid loss, but it lacked the classic aroma as compared to traditional variety. Specific proteins might be associated with the superior characteristics of the Basmati genotypes.
INTRODUCTION
Rice (Oryza sativa L.) is commercially grown in 112 countries, covering all the continents. The ranking order of food preference in Asia is rice followed by wheat, maize and sweet potato. The protein quality of rice ranks only below to that of oats and surpasses that of whole wheat and of corn.[Citation1] Among the rice cultivars Basmati constitutes a small but special group of rice. Aroma is rated the highest desired trait followed by taste and elongation after cooking. The popcorn-like smell of aromatic rices stems primarily from 2-acetyl-1-pyrroline content[Citation2] and plays a vital role in consumer acceptability. The demand for Basmati in USA alone is reported increasing at the rate of 50% a year.[Citation3]
New high yielding varieties are being developed with similar traits to those of traditional Basmati, still the consumers' rate traditional Basmati higher than new genotype varieties. Among the newly developed varieties, Pusa Basmati 1 was first ever dwarf, photo-insensitive, input responsive high yielding one. Its ancestor is comprised of Basmati-370 and Karnal Local for aroma and grain quality characteristics, while TKM-6, IR-8, Ratna, and IR-72 for yield and resistance.[Citation4] Pusa Basmati 1 has high yield potential but its level of aroma does not match that of traditional varieties like Basmati 370.
Although several workers have attempted to differentiate Basmati from non-Basmati rice[Citation5,Citation6,Citation7] but use of exotic germplasms and interclass breeding to improve disease resistance, yield, and protein content has led to cultivars with heterogeneous kernel characteristics that are not easily identifiable.[Citation8] In the current study, an attempt has been made to differentiate the two Basmati cultivars: Basmati 370 (traditional) and Pusa Basmati 1 (developed) on the basis of their biochemical and cooking characteristics. Since proteins are a direct product of genetic matter, special attention was paid to protein patterns to establish the identity of two varieties. An attempt has also been made to correlate the proteins with particular quality attributes.
MATERIALS AND METHODS
Rice cultivars Basmati 370 and Pusa Basmati 1 representing traditional and developed varieties respectively were obtained from Punjab Agricultural University, Ludhiana (India).
Preparation of Defatted Flour
Paddy samples were dehusked (HT McGill Inc., USA) and brown rice was ground in Brabender Quadramatic Junior Mill (Duisburg, Germany). The flour was mixed with petroleum ether in the ratio of 1:10, stirred for 30 min and centrifuged (8888 × g, 15 min, 4°C). The defatting steps were repeated twice. Finally the flour was air-dried, and the resulting flour was stored in airtight glass jars at ambient temperature.
Nutrient composition
Moisture, lipid, minerals, and protein were determined by AOAC methods.[Citation9] Carbohydrate content was determined by difference. The calorific value (kJ) was calculated by multiplying the values of the carbohydrates, fat, and protein with factors 16.74, 37.68, and 16.74 respectively.
Protein Fractionation
Rice protein fractions were prepared by sequentially extracting defatted flour with 0.5M NaCl (albumin and globulin), 70% aqueous ethanol (prolamin), and 0.1N NaOH (glutelin) at 25°C. Following each extraction, the slurry was centrifuged (8888 × g, 15 min), and the supernatant was filtered (Whatman No. 1) to remove insoluble particles. Supernatants were dialyzed (Pore size 2.4 nm, Hi media Laboratories Ltd., India) with double distilled water for 24 h with six water changes. After dialysis, the albumin-globulin fraction was centrifuged (8888 × g, 15 min). Protein fractions were stored in plastic bottles at −20°C until used for further analysis. The protein content of extracts was measured by Lowry method.[Citation10] Solution A (0.5 g CuSO4.5H2O + 1 g Na3C6H5O7.2H2O, volume made to 100 ml), and solution B (20 g Na2CO3 + 4 g NaOH, volume made to 1000 ml) were mixed in the proportion of 1:50 to make solution C. The protein extract (0.5 ml) and solution C (2.5 ml) were mixed and kept for 10 min. Then 0.25 ml of solution D (Folin Ciocalteu reagent and distilled water, 1:1) was added and further kept for 25 min. The absorbance was read at 540 nm on UV-Visible spectrophotometer (Shimadzu, Japan). The concentration of protein was calculated from the BSA (bovine serum albumin) standard curve.
Electrophoresis
Gel was run using vertical mini slab electrophoresis system (PROTEAN-3, Bio-Rad Laboratories, USA). SDS-PAGE was carried out according to the method of Bollag et al.[Citation11] on 14% polyacrylamide gel. Gel was fixed in the fixing solution overnight and then silver stained. Gels were analyzed using Gel Documentation System (Ultra Lum Inc., USA).
Cooking Behavior
The polished grains were cooked in boiling water bath. Elongation index was calculated as the ratio of L/B of cooked rice to L/B of raw polished rice. Ratio of difference in length of raw and cooked kernels to the difference in width of raw and cooked kernels was expressed as coefficient of dimensional changes. Coefficients of longitudinal and latitudinal expansion were expressed on the basis of length and breadth, respectively. Water absorption (g water/g initial mass) was determined on the basis of gain in weight of grains after cooking. Swelling number was calculated as ratio of weight of cooked rice to the weight of raw rice. Stickiness of the rice grains after cooking was determined by the rice cluster distribution method using the equation n = −1/ln (1-N/No), where No is the number of grains before cooking and N is the number of clusters after cooking.[Citation12] The gruel left after cooking was evaporated at 100°C for 10 h, and the solids left were expressed as percent solid loss on the basis of raw rice. Minimum time taken to gelatinize the core was reported as cooking time.
Stastical Analysis
All the analysis was done in triplicates. Mean and standard deviation were reported for the data. Data were statistically analysed according to student's ‘t’ test for the significant differences (p < 0.05) among the values.
RESULTS AND DISCUSSION
Nutrient Composition
Nutrient composition of the two cultivars was quite similar (). Brown rice contained 1.10 and 1.16% ash while milled rice contained 1.40 and 1.61% for Basmati 370 and Pusa Basmati 1, respectively. Crude fat content was 2.46–2.72% for brown and 1.40–1.61% for Basmati 370 and Pusa Basmati 1, respectively. The protein content was higher in Pusa Basmati 1 (brown as well as milled), as compared to Basmati 370. Protein contents of aromatic rice did not show distinctive variations among varieties.[Citation13] Carbohydrates were found to be falling in a range of 71–75% for both cultivars. Calorific values of two cultivars varied from 1455–1477 kJ/100 g. A Thai rice grain (Luang 11) has been reported to contain 12.27% moisture, 5.18% protein, 0.28% fat, 0.21% ash, and 82.50% carbohydrates.[Citation14] Student ‘t’ test was used to compare the nutrient parameters of two cultivars. It indicated significant difference in protein and calorific values of two cultivars in brown and milled rice, while the carbohydrate content varied significantly in milled rice only (p < 0.05).
Table 1 Nutrient composition of Basmati 370 (traditional) and Pusa Basmati 1 (developed) rice cultivars (n = 3)
Fractionation of Proteins
Quantitative ratios of protein fractions varied significantly between the Basmati 370 and Pusa Basmati 1. Ratios of albumin, globulin, prolamin and glutelin were 4:10:4:82 and 15:16:5:64 for brown rice of Basmati 370 and Pusa Basmati 1, respectively (). Huebner et al.[Citation15] also observed that total amounts of each protein class differed among many varieties. Glutelin appeared to be the dominant fraction in both the cultivars. The total protein yield of Osborne fractions was 83.76% and 86.84% for Basmati 370 and Pusa Basmati 1, respectively, which were comparable to the earlier reported values.[Citation16] Student ‘t’ test indicated significant (p < 0.05) difference in all the protein fractions of the two cultivars under investigation.
Table 2 Osborne fractions of Basmati 370 (traditional) and Pusa Basmati 1 (developed) cultivars
Protein Characterization
Although Basmati 370 and Pusa Basmati 1 belong to the same category, but a wide variation was apparent from the SDS-PAGE of two genotypes.
Albumin
SDS-PAGE resolved the albumin fraction of Basmati 370 and Pusa Basmati 1 into seven and six bands respectively with a range of 17.5–90 kDa (, ). The most intense band of Pusa Basmati I appeared at 24.37 kDa while 20.46 kDa was the predominant band for Basmati 370. Two high molecular weight bands of Pusa Basmati 1 (90.32 kDa and 81.04 kDa) were found to be similar to Basmati 370 (91.65 and 82.36 kDa). However, 64.98 and 34.25 kDa bands of Pusa Basmati 1 were missing in Basmati 370, but three subunits of 50.67, 47.09, and 39.06 kDa were present in the same region. The molecular weight range of the bands was quite close but dominant bands differed from earlier reported values.[Citation17]
Figure 1 SDS-PAGE of Pusa Basmati 1 and Basmati 370 on 14% gel. (M: Marker; Lane 1: Albumin; Lane 2: Globulin; Lane 3: Prolamin; and Lane 4: Glutelin of Pusa Basmati 1; Lane 5: Albumin; Lane 6: Globulin; Lane 7: Prolamin; and Lane 8: Glutelin of Basmati 370).
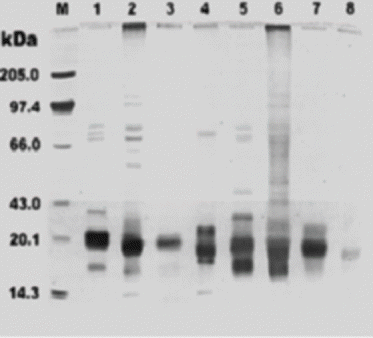
Table 3 Molecular weight (kDa) and mass proportion (%) of albumin and globulin fractions of Basmati 370 and Pusa Basmati 1 under reduced electrophoretic conditions
Globulin
Pusa Basmati I resolved into ten bands with the most intense bands having a molecular weight of 19.63 kDa followed by 29.88 kDa while Basmati 370 resolved into 11 bands, with 20.46 kDa as the dominant subunit followed by 34.25, 47.09, and 63.19 kDa subunits (, ). Two high molecular weight bands of both the cultivars appeared to be quite similar to each other. Iwasaki et al.[Citation17] also observed many similarities with some clear differences in the albumin and globulin fractions of three rice varieties.
Prolamin
Prolamin being the minor fraction of rice grain was composed of three subunits in Pusa Basmati 1 (30.75, 21.52, and 17.94 kDa) and two subunits in Basmati 370 (32.06 and 23.3 kDa). The 17.94 kDa band provided a clear distinction to Pusa Basmati 1 against Basmati 370 (, ). Lookhart and Bean[Citation18] also differentiated the rice cultivars on the basis of their prolamin patterns.
Table 4 Molecular weight (kDa) and mass proportion (%) of prolamin and glutelin fractions of Basmati 370 and Pusa Basmati 1 under reduced electrophoretic conditions
Glutelin
The most predominant protein fraction of rice grain varied most between the two cultivars. Glutelin of Pusa Basmati 1 belonging to the class of developed varieties was remarkably different from traditional variety Basmati 370 (, ). Pusa Basmati 1 resolved into seven distinct bands (14–76 kDa) with major bands having molecular weight of 29.44 and 20.46 kDa, while Basmati 370 had a single band of 20 kDa. A molecular weight range of 14–51 kDa has been reported for glutelin polypeptide by several other researchers.[Citation19,Citation20] The single subunit of traditional cultivar can be used as indication of purity of a sample.
Cooking Characteristics
Cooking results revealed that Pusa Basmati 1 had higher L/B ratio than Basmati 370 while coefficient of longitudinal expansion and elongation index were greater for Basmati 370 (). A wide variation was observed in coefficient of dimensional changes (CDC) in the two cultivars. Although Pusa Basmati 1 had better elongation on cooking than Basmati 370, the aroma in Pusa Basmati 1 was quite faint as compared to Basmati 370,which reduces the price of Pusa Basmati 1 in the domestic, as well as in the international market. The aromatic rice contained higher concentration of aroma volatiles.[Citation21] CDC can be better utilized to detect adulteration of highly aromatic Basmati 370 with Pusa Basmati 1. Mahindru[Citation6] and Hirannaiah et al.[Citation22] also supported that this parameter could be used to distinguish Basmati.
Table 5 Cooking characteristics of polished rice from Basmati 370 (traditional) and Pusa Basmati 1 (developed) rice cultivars (n = 3)
Water absorption, swelling number, and W/S were higher in Basmati 370. Basmati 370 took longer time than Pusa Basmati 1 to gelatinize the core completely. Student ‘t’ test revealed a significant difference between the two cultivars in water absorption, swelling number, and W/S. Pusa Basmati 1 is more slender and has a higher surface area than Basmati 370, which might have reduced its cooking time. Bhattachrya and Sowbhagya[Citation23] observed that cooking time was directly related to grain thickness. Basmati 370 had higher solid loss as compared to Pusa Basmati 1, while stickiness varied only marginally between the two genotypes. Student ‘t’ test indicated significant (p < 0.05) higher loss of solids in Basmati 370. Hamaker and Griffin[Citation24] suggested a relationship between cooked rice texture and 60 kDa protein. A 60.89 kDa protein was found in the globulin fraction of Pusa Basmati 1 in the present study. This protein was found to be rich in disulfide linkages[Citation25] and correlated well with amylose content and cooked rice stickiness.[Citation26]
High elongation and low solid loss in Pusa Basmati 1 rice may be attributed to greater strength of cell wall line, which is able to hold the pressure until maximum elongation takes place without rupturing of the cell wall. A 17.4 kDa peptide of prolamin fraction was found to be missing in Basmati 370. It may be suggested that this subunit is related to some favorable or unfavorable characteristic of Pusa Basmati 1 genotype. Chandrashekar and Mazhar[Citation27] observed that the cell walls were the site of protein deposition and prolamins were bound to the cell wall in the mature grain. A single low molecular weight subunit was found in the glutelin fraction of Basmati 370 that might be responsible for the aromatic character of this traditional Basmati genotype. Basak et al.[Citation28] also suspected the likely involvement of high molecular weight protein of glutelin in providing the non-Basmati aromatic character.
CONCLUSION
Basmati cultivars could be characterized on the basis of physical, biochemical and cooking aspects. Differences in all the protein fractions were observed but glutelin fraction varied the most. Since Basmati 370 has been involved in the breeding program of Pusa Basmati 1, close similarities were observed in the electrophoregrams of albumin and globulin fractions. Thus, besides identification, electrophoresis can also be used as a tool to analyze the pedigree of a new cultivar. Proteins are the second most abundant component of rice grain; their association with other major components like starch might exert a strong influence on the cooking attributes. An elaborate research work is still underway to identify and ascertain the interrelationship of protein subunits with the classic attributes of pure Basmati varieties, so that, specific subunits may be used as markers of quality traits to be better utilized in breeding programs, as well as to establish the basis of functional properties of rice proteins.
Notes
1. Kik, M.C. The nutritive value of rice and its by-products. Arkansas Agricultural Experiment Station Bulletin, 1957; 589.
9. Association of Official Analytical Chemists. Official methods of analysis of the Association of Official Analytical Chemists. Virginia: AOAC Inc.: Arlington, VA 1990.
REFERENCES
- 1. Kik, M.C. The nutritive value of rice and its by-products. Arkansas Agricultural Experiment Station Bulletin, 1957; 589.
- Bhattacharjee , P. , Singhal , R.S. and Kulkarni , P.R. 2002 . Basmati rice: A review . International Journal of Food Science and Technology , 37 : 1 – 12 .
- Huke , R.E. and Huke , E.H. 1990 . In Rice: Then and now , 44 Los Banos, Phillippines : International Rice Research Institute .
- Siddiq , E.A. 1990 . Export prospects of Indian Basmati rices . Indian Farming , 40 : 45 – 47 .
- Goyal , J.L. and Pingale , S.V. 1971 . Detection of admixture in Basmati rice . Bulletin of Grain Technology , 9 : 47 – 50 .
- Mahindru , S.N. 1995 . Manual of Basmati rice , 307 New Delhi, India : Metropolitan Publications .
- Vaingankar , N.M. and Kulkarni , P.R. 1986 . Preliminary observations on cooking quality parameters as indicators of adulteration of Basmati rice . Journal of Science of Food and Agriculture , 37 : 707 – 708 .
- Lookhart , G.L. , Albers , L.D. , Pomeranz , Y. and Webb , B.D. 1987 . Identification of U.S. rice cultivars by high performance liquid chromatography . Cereal Chemistry , 64 : 199 – 206 .
- 9. Association of Official Analytical Chemists. Official methods of analysis of the Association of Official Analytical Chemists. Virginia: AOAC Inc.: Arlington, VA 1990.
- Lowry , O.H. , Rosebrough , N.J. , Farr , A.C. and Randal , R.J. 1951 . Protein analysis with folin-phenol reagent . Journal of Biological Chemistry , 193 : 265 – 275 .
- Bollag , D.M. , Rozycki , M.O. and Edelstein , S.J. 1996 . Protein methods , 2nd , New York : John Wiley .
- Chrastil , J. 1990 . Chemical and physicochemical changes of rice during storage at different temperatures . Journal of Cereal Science , 11 : 71 – 85 .
- Chaubey , P.K. , Nanda , B.B. and Richariya , A.K. 1988 . Quality attributing characters of scented and non-scented rice . Oryza , 25 : 325 – 328 .
- Israkarn , K. and Charoenrein , S. 2007 . Influence of annealing temperature on Tg of cooked rice stick noodles . International Journal of Food Properties , 9 : 759 – 766 .
- Huebner , F.R. , Bietz , J.A. , Webb , B.D. and Juliano , B.O. 1990 . Rice cultivar identification by high performance liquid chromatography of endosperm proteins . Cereal Chemistry , 67 : 129 – 135 .
- Cagampang , G.B. , Quiz , L.J. , Espirites , S.G. , Santiago , R.G. and Juliano , B.O. 1966 . Studies on the extraction and composition of rice proteins . Cereal Chemistry , 43 : 145 – 155 .
- Iwasaki , T. , Shibuya , N. , Suzuki , T. and Chikubu , S. 1982 . Gel filtration and electrophoresis of soluble rice proteins extracted from long, medium and short grain varieties . Cereal Chemistry , 59 : 192 – 195 .
- Lookhart , G.L. and Bean , S.R. 1995 . Rapid differentiation of Oat cultivars and of rice cultivars by capillary zone electrophoresis . Cereal Chemistry , 72 : 312 – 316 .
- Steenson , D.F. and Sathe , S.K. 1995 . Characterization and digestibility of Basmati rice (Oryza sativa L. Var. Dehraduni) storage proteins . Cereal Chemistry , 72 : 275 – 280 .
- Zarins , Z. and Chrastil , J. 1992 . Separation and purification of rice oryzenin subunits by anion exchange and gel permeation chromatography . Journal of Agricultural and Food Chemistry , 40 : 1599
- Wilkie , K. , Wootton , M. and Paton , J.E. 2004 . Sensory testing of Australian fragrant, imported fragrant and non fragrant rice aroma . International Journal of Food Properties , 7 : 27 – 36 .
- Hirannaiah , B.V. , Bhashyam , M.K. and Ali , S.Z. 2001 . An improved cooking quality test for Basmati rice . Journal of Food Science and Technology , 38 : 116 – 119 .
- Bhattacharya , K.R. and Sowbhagya , C.M. 1971 . Water uptake by rice during cooking . Cereal Science Today , 16 : 420 – 424 .
- Hamaker , B.R. and Griffin , V.K. 1993 . Effect of disulfide bond containing protein on rice starch gelatinisation and pasting . Cereal Chemistry , 70 : 377 – 380 .
- Villareal , C.P. and Juliano , B.O. 1986 . Waxy gene factor and residual protein of rice starch granules . Starch/Staerke , 38 : 118
- Hamaker , B.R. , Griffin , V.K. and Moldenhauer , K.A.K. 1991 . Potential influence of a starch granule-associated protein on cooked rice stickiness . Journal of Food Science , 356 : 1327
- Chandrashekar , A. and Mazhar , H. 1999 . The biochemical basis and implications of grain strength in Sorghum and Maize . Journal of Cereal Science , 30 : 193 – 207 .
- Basak , S. , Tyagi , R.S. and Srivastav , K.N. 2002 . Biochemical characterization of aromatic and non-aromatic rice cultivars . Journal of Food Science and Technology , 39 : 55 – 58 .