Abstract
Quantification and evaluation of selected Arabica (Coffea arabica L.) coffee beans' shape and size was performed. Twenty different coffee types originating from 13 different countries were analyzed. The main dimensions for individual coffee types were quantified. Sphericity, as a useful parameter for the calculation of processing and handling operations, was also quantified and ranged from 0.006536 to 0.009452. Calculation of shape variability using elliptic Fourier descriptors showed relevant differences among individual coffee samples. A dominant importance and the relevance of length-to-width ratio were quantitatively confirmed. A simple mathematical formula describing coffee grain contour was used with a satisfying correlation coefficient. Applicability of the approach was shown on the calculation of curvature radius.
INTRODUCTION
The criteria commonly used to evaluate the quality of coffee beans include bean size, color, shape, roast potential, processing method, crop year, flavor or cup quality, and the presence of defects;[Citation1] however, specific studies that correlate the presence of such defects with physical and chemical characteristics of the beans are still scarce. Balanced filling and uniform ripening of coffee berries, thus yielding a better-quality product, is the aim of all coffee breeders. The simple tool used, for example, for on-line sorting and selecting shape-defective beans would considerably help coffee manufacturers in achieving effective and superior production, but an exact mathematical description of a “regular” bean and its shape variability is essentially needed. Due to increasing computer performance and data processing capacities and rates, such on-line evaluation based on image or video analysis can soon be expected. Size and shape of coffee berries and beans (as well as their other properties) depend on many factors such as coffee variety,[Citation2] bean quality,[Citation3] planting conditions,[Citation4] geographical zone,[Citation5] and other parameters. The Coffea arabica bean shape was first statistically reviewed by Wormer.[Citation6] Many other authors have later dealt with this phenomenon and introduced different approaches.[Citation2,Citation7,Citation8]
Object shape (including agricultural products) can influence its mechanical or thermal properties. Thus, its knowledge is critical, e.g., for designing manipulation, handling, and processing devices. This fact was confirmed by a number of works covering different biological and agricultural materials and products.[Citation9–12 The evaluation of the coffee grain shape is relatively difficult owing to its complexity. The exact evaluation of the grain shape must be generally based on the use of 3-D scanning, but for the solution of many problems it is sufficient to know the shape of the contour of the grain projection in given directions. The accurate description of these grain contours can be obtained from digital images. A frequent problem, which occurs while manipulating with coffee beans (sieving, sorting, and/or grinding), is also the calculation of the exact volume and surface area. High-level mathematical formulas should be used to calculate the volume and surface area; therefore, the determination of the solid mechanical and handling properties of any granular food material using sphericity is very difficult and also not very practical.[Citation13] One of the objectives of this work is, therefore, to calculate the bean sphericity with the use of a simple approach, to compare the shape variability of different coffee types by the use of Fourier descriptors, and to determine and compare bean curvature radius. In view of the aforementioned, the general objective of the present study was to present the powerful tools for determination and description of shape and size attributes of Coffea arabica coffee beans. Simple methods, mostly based on the measurement of main axial dimensions, were presented by other authors,[Citation2,Citation3,Citation6] but these methods are not sufficient for the above-mentioned on-line computer assisted processing.
MATERIAL AND METHODS
Coffee Samples
Roasted Arabica coffee beans were used for analyses. Arabica coffees were produced in Brazil [B1, B2], Colombia [C1, C2, C3], Costa Rica [CR], Ethiopia [E], Guatemala [G], Honduras [H], Indonesia [I1, I2, I3], Kenya [K1, K2, K3], Mexico [M], Panama [P], Papua New Guinea [P-NG], Peru [PE], and Tanzania [T]. The abbreviations in square brackets indicate the coffee type and it is used in the text hereinafter. All Arabica samples were submitted to a light roast. The beans were ordered from a commercial distribution network in the Czech Republic. All analyses were performed for samples of 100 beans randomly selected from each lot. Sample details are listed in .
Table 1 Selected physical characteristics of different coffee brands
Quantitative Measurement of the Bean Weight and Dimensions
The weight of the roasted beans was measured using a Kern–KB electronic balance (Germany). Dimensions in the main axes (D1, D4, D7—see ) were measured using a SOMET digital calliper (Germany). With regards to measurement accuracy and relevance, one decimal number was considered. According to indications by other authors,[Citation2] D1, D4, and D7 dimensions correspond to W (width), D (depth), and L (length), respectively. The remaining dimensions (D2, D3, D5, D6; ) were determined from digital images using Corel DRAW X3 (Corel Corporation, USA).
Figure 1 Illustration of measuring sides for coffee beans (reworked version of Fig. 2 presented in Bayram[Citation13]).
![Figure 1 Illustration of measuring sides for coffee beans (reworked version of Fig. 2 presented in Bayram[Citation13]).](/cms/asset/7eb05b1a-81aa-4ba5-815f-8260683e75a7/ljfp_a_487967_o_f0001g.gif)
Image Analysis
An Olympus SP-560UZ digital camera (Olympus, Japan) was used to capture the pictures of the beans.
Calculation of Volume and Sphericity
Volume as well as sphericity was calculated using Microsoft Office Excel software (Microsoft, USA). The average volumes of the beans were calculated from measurements of major, minor, and intermediate diameters (D1, D4, D7) of individual beans and the assumption that each bean could be taken as half a triaxial ellipsoid.[Citation14] The sphericity was calculated using EquationEq. (1), derived by Bayram,[Citation13]
Evaluation of the Variation of Coffee Bean Shape Based on Image Analyses Using Elliptic Fourier Analyses
The beans were photographed using an Olympus SP-560UZ digital camera (Olympus, Japan) and digital images with a resolution of 180 dpi were acquired. The raw images were converted to full color (24-bit) bitmap format. This procedure was followed by converting the images to greyscale. The greyscale images were converted to binary images in which the objects and background are represented as 1 (white) and 0 (black), respectively. The image analysis software SHAPE[Citation15] was used to perform all the following steps. The closed contours of the beans were obtained through binary images with appropriate thresholds and were described by a chain-code.[Citation16] Namely, each contour was represented as a sequence of x and y coordinates of ordered points that were measured counter-clockwise from an arbitrary starting point. Assuming that the contour between the (i - 1)th and ith chain-coded points is linearly interpolated and that the length of the contour from the starting point to the pth point and the perimeter of the contour are denoted by the tp and T, respectively, then the elliptic Fourier expansions of the coordinates on the contour are
The same or similar method was used for the petal shape variation analysis,[Citation17] chicken egg shape analysis,[Citation18] hazelnut shape analysis,[Citation19] or e.g., sperm head shape analysis.[Citation20] The coefficients of elliptic Fourier descriptors that were normalized to avoid variations related to the size, rotation, and starting point of the contour traces were then calculated from the chain-code through the procedure based on the ellipse of the first harmonic.[Citation21] By this procedure, the peach shape was approximated by the first 20 harmonics, which correspond to the 77 coefficients of normalized elliptic Fourier descriptors.
In order to summarize the information contained in the coefficients of the Fourier descriptors, the principal components analysis based on a variance–covariance matrix of the coefficients was performed. The scores of the components were used in subsequent analysis as the peach shape characteristic. The variation in shape accounted for by each component was visualized using the inverse Fourier transformation.[Citation22]
Determination of Curvature Radius
From the dimensional measures of individual grains, the contours of single projections could be accurately described in a user-defined Cartesian coordinate system. The shape of the grain counter can be described using the polar coordinates r, as:
Another approximation can be given by the polynomial fit:
If we denote
RESULTS AND DISCUSSION
The mean values of experimentally found weights (g), dimensions (mm) along main bean axes, and volume (m3) (including standard deviation values) are listed in . Mean values represent the average of 100 individual measurements in each lot of coffee beans. As can be seen in , the bean width (D1) ranged from 7.56 mm (E) to 9.76 mm (M), the bean depth (D4) from 4.50 mm (CR) to 5.07 mm (K2), and bean length (D7) from 10.36 mm (P-NG) to 14.90 mm (M). Generally, the least variable bean parameter was bean depth (D4) with a coefficient of variation of 0.05, followed by bean width (D1) (CV = 0.18), and bean length (D7) (CV = 0.85).
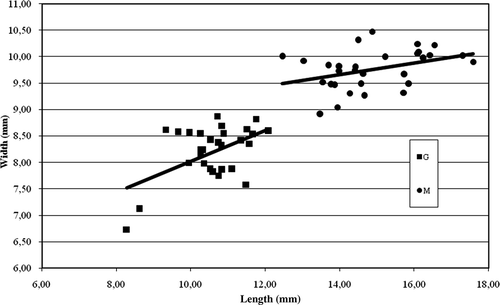
Ghosh and Gacanja[Citation2] derived the general relationship between length (D7), width (D1), and depth (D4) of Arabica beans. The relationship has the following form: D7 = 1.300, D1 = 2.082 D4. This conclusion was confirmed by the presented study, where the calculation of the given relationship yielded in: D7 = 1.290 to 1.534 D1 (G, M, respectively) = 2.210 to 2.655 D4 (PE, M, respectively). The only relevant difference was found for the length/depth (D7/D4) ratio, where the presented research revealed slightly higher values. The coefficient of correlation for the ratios of length/width ranged from 0.301 (C2) to 0.787 (CR), length/depth from 0.376 (P) to 0.924 (P-24), and width/depth from 0.461 (H) to 0.813 (P-NG). The values of correlation coefficients are listed in . demonstrates that the parameters of the shape (length-to-width ratios of G and M are shown as an example) are mutually dependent. Similar dependencies can be created with the analogical result for other shape parameters and coffee types. The average volumes of the beans were calculated according to the formula reported by Dutra et al.[Citation14] The volumes ranged from 201.5 to 430.3 (×10−9 m3) for CR, M, respectively.
Table 2 Correlation (r) for length/width, length/depth, and width/depth ratios
Figure 2 Relation between selected bean shape dimensions.
Sphericity
The applicability and proof of EquationEq. (1) was carried out by Bayram[Citation13] using the following shapes: sphere, cube, rectangular solid, and cylinder. The approach was successfully applied for sphericity calculations of beans, chickpeas, lentils, and wheat. The values of Arabica bean sphericity (including standard deviation values) are listed in . The average value of sphericity ranged from 0.006536 to 0.009452 for K1, M, respectively. A statistically significant difference at α = 0.05 for average sphericity values for 100 samples was found for all coffee types. Due to important problems in available measurement and calculation methods to determine exact volume and surface area for granular materials, EquationEq. (1) can be used easily for solid mechanics and handling operations to determine the sphericity of coffee beans.
Table 3 Mean and s.d. values of calculated sphericity
Shape Variability Quantified by Fourier Descriptors
Comparative analyses of coffee bean shape variability were performed by image analysis, employing principal analysis components of elliptic Fourier descriptors. The mean bean shape (for each lot) was drawn using the mean values of the standardized Fourier coefficients. The first four principal components provide a good summary of the data, accounting for almost 100% of the total variance (). The first component represents the length-to-width ratio, the second component represents the position of the center of gravity, the third component represents curvature, and the fourth component substitutes the degree of roundness. An example (coffee B1) of a complete set of principal contribution components is given in . The influence of the first and most important component (length-to-width ratio) ranges from 70.87 to 74.64 for E, I1, respectively.
Table 4 Contributions (%) of first four principal components (cumulative) and first component
Table 5 Contributions of individual principal components—coffee B1
Since mean values of single components of individual coffee types are known or can be determined by the above-described method, unusual detected values can show the defective state of a coffee bean and can serve as a tool for the definition of specific irregularities. Generally, there are two major advantages of using elliptic Fourier descriptors and principal component analysis. First, this approach can accurately detect small shape variations. Detection of rather small variations is difficult for humans, but the analyses based on component scores can clearly detect significant variations among individual coffee beans. Second, the analyses can evaluate the shapes of objects independently of size. This independence is a great advantage because human visual judgment of shape is often deceived and misled by size factors. The above-mentioned method represents a relatively simple but powerful interpretation tool, which perfectly suits for evaluating of biological shapes. This study demonstrates the potential of modern techniques using shape-based methods on digital images to achieve high efficiency performance in fruit/beans/seeds grading and classification.
Curvature Radius
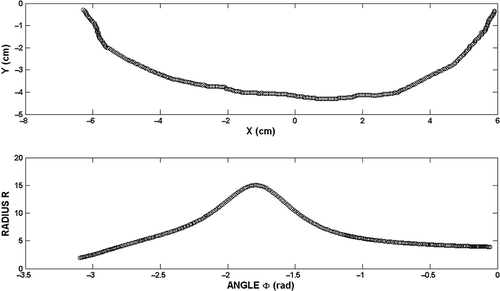
The function described by EquationEq. (6) has been used for evaluation of the grain shape, as described in the previous section. A selected “average-like” coffee bean from each coffee type was used for sample calculation. The results are given in . It can be seen that the correlation coefficient between measured and computed grain profiles ranges from 0.9680 to 0.9987 for M and T coffee, respectively. There is a lack of works using analogous procedures and focused on biological materials, although the similar procedures were already used for technical materials and objects of non-biological nature.[Citation23] The knowledge of the equation describing the grain contour is necessary, namely for the numerical simulation of grain behavior under different mechanical loading, for numerical simulation of different heat treatment, and also for the determination of radius of curvature R. An example of an experimental and fitted contour for coffee C1 is given in The values of the curvature radius calculated by use of EquationEq. (8) can be plotted (and listed) for any coffee grain as can be seen in the sample picture (), where half of the grain C1 is shown.
Table 6 Calculation coefficients and fit correlation coefficient for tested coffee types
Figure 3 Experimental and fitted contour of C1 coffee bean.
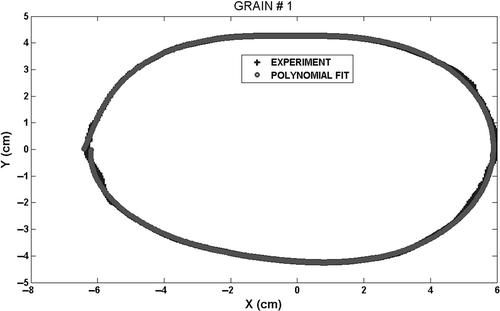
Figure 4 Example of curvature radius behavior—C1 coffee grain (half-display).
CONCLUSIONS
It was found that all main dimensions, particularly length (D7), width (D1), and depth (D4) have changed for individual coffee types. The least variable bean parameter was bean depth (D4) with a coefficient of variation 0.05, followed by bean width (D1) with a coefficient of variation of 0.18, and bean length (D7) with a coefficient of variation of 0.85. The experiments partially confirmed partially improved previous findings concerning the relationship between length (D7), width (D1), and depth (D4) of Arabica beans. The only significant difference was revealed for the length/depth (D7/D4) ratio—presented values are higher than those in previous works. The coefficient of correlation for the length/width ratios ranged between 0.301 (C2) and 0.787 (CR), for length/depth ratios between 0.376 (P) and 0.924 (P-24), and for width/depth ratios between 0.461 (H) and 0.813 (P-NG). Sphericity, calculated according to a procedure described by Bayram[Citation13] ranged from 0.006536 to 0.009452 for K1, M, respectively. The possibility of simple quantification of this parameter provides a large advantage for the design and evaluation of solid mechanics and handling operations. The highest value of sphericity was calculated for the same coffee type, where the highest values of D1 and D7 dimensions, and volume were found. Effort was also focused on the quantification of coffee shape variability by means of elliptic Fourier descriptors. Reconstructed shapes indicated that the first principal component (which represents the length-to-width ratio) is a very good measure of the total shape variation. It represents 70.87 to 74.64% (for E and I1 coffee, respectively) of the total shape variation in case of the front view. Numerical simulation of the coffee grain behavior under different mechanical loading, heat treatment, and determination of curvature radius R can be supported by proposed mathematical formulas describing grain contour with a satisfying correlation coefficient between experimental and computed data ranging from r 2 = 0.9680 to 0.9987.
ACKNOWLEDGMENT
The research has been supported by the Grant Agency of the Czech Academy of Sciences under Contract No. IAA201990701.
Related Research Data
REFERENCES
- Banks , M. , McFadden , C. and Atkinson , C. 1999 . The World Encyclopaedia of Coffee , London : Anness Publishing Limited .
- Ghosh , B.N. and Gacanja , W. 1970 . A study of the shape and size of wet parchment coffee beans . Journal of Agricultural Engineering Research , 15 ( 2 ) : 91 – 99 .
- Franca , A.S. , Oliveira , L.S. , Mendonca , J.C.F. and Silva , X.A. 2005 . Physical and chemical attributes of defective crude and roasted coffee beans. Food Chemistry . 90 ( 1–2 ) : 89 – 94 .
- Muschler , R.G. 2001 . Shade improves coffee quality in a sub-optimal coffee-zone of Costa Rica . Agroforestry Systems , 51 ( 2 ) : 131 – 139 .
- Costa Freitas , A.M. and Mosca , A.I. 1999 . Coffee geographic origin—An aid to coffee differentiation . Food Research International , 32 ( 8 ) : 565 – 573 .
- Wormer , T.M. 1966 . Shape of bean in Coffea Arabica L. in Kenya . Turrialba , 16 : 221 – 236 .
- Ghosh , B.N. 1969 . Physical properties of different grades of arabica beans . Transactions of the ASABE , 9 ( 3 ) : 592 – 593 .
- Dias , L.F.L. 2007 . Avalicao de Algumas Propriedades fisicas de Graos de Café (Coffea arabica) Organico e Convencional , Doctoral Thesis, Marechal Candido Rondon .
- Nedomová , Š. , Severa , L. and Buchar , J. 2009 . Influence of hen egg shape on eggshell compressive strength . International Agrophysics , 23 ( 3 ) : 249 – 256 .
- Strezov , V. and Evans , T.J. 2005 . Thermal analysis of the reactions and kinetics of green coffee during roasting . International Journal of Food Properties , 8 ( 1 ) : 101 – 111 .
- Akcali , I.D. , Ince , A. and Guzel , E. 2006 . Selected physical properties of peanuts . International Journal of Food Properties , 9 ( 1 ) : 25 – 37 .
- Razavi , S.M.A. , Bostan , A. and Rahbari , R. 2010 . Computer image analysis and physico-mechanical properties of wild sage seed (Salvia macrosiphon) . International Journal of Food Properties , 13 ( 2 ) : 308 – 316 .
- Bayram , M. 2005 . Determination of the sphericity of granular food materials . Journal of Food Engineering , 68 ( 3 ) : 385 – 390 .
- Dutra , E.R. , Oliveira , L.S. , Franca , A.S. , Ferraz , V.P. and Afonso , R.J.C. 2001 . A preliminary study on the feasibility of using the composition of coffee roasting exhaust gas for the determination of the degree of roast . Journal of Food Engineering , 47 ( 3 ) : 241 – 246 .
- Iwata , H. and Ukai , Y. 2002 . SHAPE: A computer program package for quantitative evaluation of biological shapes based on elliptic Fourier descriptors . Journal of Heredity , 93 ( 5 ) : 384 – 385 .
- Freeman , H. 1974 . Computer processing of line drawing images . ACM Computing Surveys , 6 ( 1 ) : 57 – 97 .
- Yoshioka , Y. , Iwata , H. , Ohsawa , R. and Ninomiya , S. 2004 . Analysis of petal shape variation of Primula sieboldii by elliptic Fourier descriptors and principal component analysis . Annals of Botany , 94 ( 5 ) : 657 – 664 .
- Havlíček , M. , Nedomová , Š. , Simeonovová , J. , Severa , L. and Křivánek , I. 2008 . On the evaluation of chicken egg shape variability . Acta Universitatis Agriculturae et Silviculturae Mendelianae Brunensis , 56 ( 5 ) : 69 – 74 .
- Menesatti , P. , Costa , C. , Paglia , G. , Pallottino , F. , D'Andrea , S. , Rimatori , V. and Aguzzi , J. 2008 . Shape-based methodology for multivariate discrimination among Italian hazelnut cultivars . Biosystems Engineering , 101 ( 4 ) : 417 – 424 .
- Severa , L. , Máchal , L. , Švábová , L. and Mamica , O. 2010 . Evaluation of shape variability of stallion sperm heads by means of image analysis and Fourier descriptors . Animal Reproduction Science , 119 ( 1–2 ) : 50 – 55 .
- Kuhl , F.P. and Giardina , C.R. 1982 . Elliptic Fourier features of a closed contour . Computer Graphics and Image Processing , 18 ( 3 ) : 236 – 258 .
- Furuta , N. , Ninomiya , S. , Takahashi , S. , Ohmori , H. and Ukai , Y. 1995 . Quantitative evaluation of soybean (Glycine max. L. Merr.) leaflet shape by principal component scores based on elliptic Fourier descriptor . Breeding Science , 45 ( 3 ) : 315 – 320 .
- Rios , P.R. and Glicksman , M.E. 2007 . Topological and metrical aspects of normal and abnormal grain growth . Materials Research , 10 ( 4 ) : 371 – 375 .