Abstract
Roasted green wheat is a high-value product made by roasting green (under-mature) wheat. Due to its high initial moisture content, drying is needed to avoid fast deterioration. Open sun drying of this product is by far the most common practice due to its simplicity, effectiveness, and low cost. The assumption of open sun drying adequacy to prevent deterioration was tested in this study. The drying data were fitted into eight common thin-layer drying models. Goodness of fit for each model was evaluated using coefficient of determination (R2) and root mean square error. The two-term exponential model was found to best describe open sun drying of roasted green wheat with R2, and root mean square error values of 0.988 and 0.038, respectively. A fuzzy model of open sun drying for roasted green wheat was also developed and compared with conventional modeling. The results showed a much better performance of fuzzy model compared to conventional models with a much lower value of root mean square error (1.2 × 10⁻⁶). The effective diffusivity was also evaluated for roasted green wheat kernels and found to be 1.7 × 10⁻¹¹ m2/s, which was in agreement with published data. The results showed that open sun drying for 5.5 h was effective and adequate to reduce moisture content to a safe level and to prevent deterioration of this product. These findings will provide valuable information for the design of a commercial roasted green wheat solar drying system.
INTRODUCTION
Roasting of green (under-mature) wheat is a common practice in Middle Eastern countries and throughout parts of the world, such as Turkey and Australia. In Middle Eastern countries, the product is commonly known as frikeh (also known as frekeh or freekah). Roasting provides the green wheat with a distinctive, favorable, smoked flavor. Yearly production of this food staple in the Middle East region is between 200 and 300 thousand tons.Citation[1] Nutritional composition of roasted green wheat shows that it has superior nutritional value compared to rice and wheat, where it contains 77% carbohydrates, 12.7% protein, 16.5% dietary fiber, high amounts of potassium, magnesium, and calcium, and small amounts of vitamin A, B1, B2, C, and E.Citation[2]
Drying of agricultural commodities is one of the oldest preservation methods. Drying is used to extend shelf life and reduce volume and weight of agricultural commodities. This leads to minimum handling, transportation, and packaging costs.Citation[3] Sun drying has been used to dry a variety of crops in tropical and subtropical regions throughout the world. Although it has some disadvantages, such as uncontrolled rate of drying, inferiority in product quality, and dependence on climatic and weather variations, it has the advantages of being an inexhaustible, environment friendly, and cheap source of energy.Citation[4]
Mathematical modeling of thin layer drying has been used to predict the performance of drying systems, and in the design of artificial food dryers under deep-bed drying conditions. There have been many studies on thin layer drying of field grains, including barley,Citation[5] rice,Citation[6] and wheat.Citation7–10 Several studies have been reported on using solar and artificial drying to dry agricultural commodities.Citation11–13 Conventional mathematical modeling of non-linear systems, however, has some limitations including the need for good starting points for parameter estimates, which are difficult to get sometimes, and the difficulty to converge to an absolute minimum. To date, relatively little attention has been devoted to the modeling of drying kinetics using intelligent techniques, such as fuzzy or neural fuzzy approaches. All of the previously discussed regression-based models are aimed at obtaining conventional solutions that simply model the data with the best possible accuracy, without paying much attention to the capability of these models to predict new measurements. Therefore, fuzzy modeling (FM) was used in this work to model drying kinetics and compared the results with those from conventional models.Citation[14]
Roasted green wheat production provides an economic advantage for local farmers, since it is commonly sold at a price that is three times as high as ripe wheat. The amount of production, however, is limited by two main factors: the first is the dependence of this industry on traditional, non-mechanized methods, and secondly, the need for efficient drying of the product to reduce moisture from about 45% to less than 12% (w.b.) in less than 1 day to avoid spoilage. Sun drying of this product remains the most acceptable practice since it is gentle, simple, effective, and the least expensive. A good understanding of sun drying behavior, therefore, would help improve production efficiency and minimize crop spoilage. Thus, the objective of this research is to model sun drying kinetics using conventional and fuzzy modeling (FM) and to check the adequacy of this drying practice.
MATERIALS AND METHODS
Roasted Green Wheat Preparation
Roasted green wheat was prepared according to the traditional procedure from under-mature durum wheat (variety Hourani) on May 5, 2008 at a nearby wheat field in Northern Jordan. According to the traditional method, wheat sheaves were cut and collected in the morning and allowed to dry for 3 h in an open place. After drying, sheaves were placed on clean pieces of metal sheets and burned by dried remains of barley straw. Sheaves were turned frequently with a pitch fork to expose the green leaves and glumes to direct fire. Burning stopped after 15 min when the glumes were charred and the tips of some of the grains were slightly blackened. The spikes were then left to cool in the open atmosphere. Two hours later, the heads were threshed by feeding them into a threshing machine that was brought to the site. Five kilograms of roasted green wheat were filled in polyethylene plastic bags directly after threshing and stored in a refrigerator at 4°C to preserve quality until use.
Moisture Content
Moisture content was measured according to ASAE standards,Citation[15] as follows: triplicates of 10-g samples were obtained using a Boerner grain divider (Kartar Scientific Industries, Haryana, India). The samples were oven dried at 103°C for 72 h, then transferred into a desiccator with a desiccant and allowed to cool down. The sample weights were then recorded using a digital balance to ±0.005 g (Denver Instruments, Bohemia, NY, USA). Average moisture content was obtained and found to be 43.2% (w.b.).
Open Sun Drying
At 10:00 a.m. of the following day after roasting green wheat, three plastic trays each containing 300 g of roasted green wheat at 43.2% moisture content were spread in a single layer at a thickness of 0.4 ± 0.01 cm and placed in an open sun field. The weight of roasted green wheat was recorded for each tray every half-hour using a digital balance to ±0.01 g. The drying was completed after 5.5 h when the weight of the samples became approximately constant as they dropped below 10% m.c. required for safe storage.
Theoretical Considerations
Newton's law of cooling in heat transfer was originally used to model the mass transfer of water in thin layer drying as follows: Citation[16]
Table 1 Conventional mathematical models for crop drying given by different authors
Mathematical Modeling the Effective Moisture Diffusivity
Analytical solution of one-dimensional Fick's law for spherical objects with constant moisture diffusivity was used to calculate the effective diffusivity as follows:Citation[19]
Fuzzy Modeling
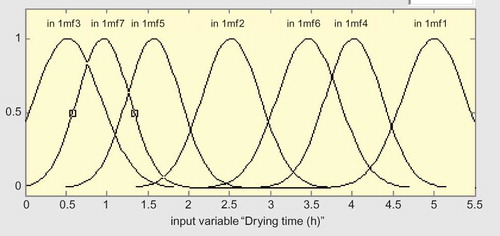
The input variable of this model was the drying time, while the output was moisture ratio (normalized moisture). The drying time was classified into seven trapezoidal membership functions as shown in The fuzzy model was generated using a subtractive method and trained using a hybrid technique.Citation[14]
Figure 1 The seven trapezoidal membership functions for fuzzy model. (Color figure available online.)
Statistical Analysis and Non-Linear Regression
To estimate model coefficients and the goodness of fit statistics, SAS non-linear least square regression was used.Citation[21] The adequacy of each model was measured using three criteria: Root mean square error (RMSE) and coefficient of determination (R 2) as follows:
RESULTS AND DISCUSSION
Analysis of Sun Drying Curve
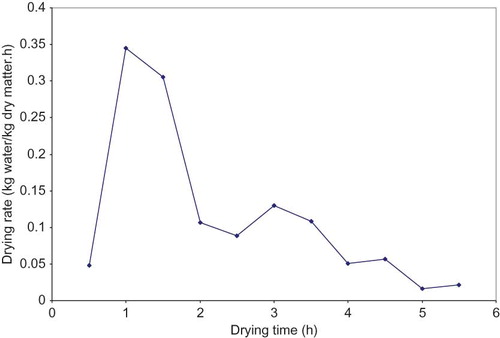
The variation of ambient temperature during sun drying of roasted green wheat under natural convection during the experiment and in a typical day at the first week of May is shown in During the drying experiment, the ambient temperature varied between 26 and 32°C. The highest temperatures were recorded between 11:00 a.m. and 3:00 p.m. The equilibrium moisture content of Me = 0.08 in the normalized moisture equation MR = (M − Me )/(Mo − Me ), was obtained from equilibrium moisture content charts for durum wheat at 30°C and RH = 20%.Citation[15] This assumption was made since about two-thirds of the drying period took place at relative humidity (RH) and temperatures of 16% and 30 to 32°C. This value of equilibrium moisture content would be more appropriate than a value of zero as shown in Citation[13] The drying curve was obtained by plotting the moisture ratio (MR) against the drying time in hours when Me = 0 and Me = 0.08. shows that assumption of zero equilibrium moisture content was not acceptable; therefore, Me = 0.08 was used instead. The drying rate curve was also obtained by plotting drying rate against drying time as shown in The results show that roasted green wheat samples were dried to a moisture ratio of 0.002, which corresponds to a moisture content of 12.3% (w.b.). The final moisture content was selected to assure safe storage. The drying rate curve showed that all drying took place during the falling rate region and there was no constant rate drying region. Drying rate during the first half hour was very low, which might be due to the sensible heating of the roasted green wheat kernels to reach the ambient temperature before drying starts effectively. The falling rate drying indicates that drying was controlled by diffusion of the moisture from the interior to the surface of the roasted green wheat kernel.Citation[22] Results were in agreement with Sun and WoodsCitation[5] for barley, and Sun and WoodsCitation[7] for wheat.
Figure 2 Variation of ambient temperature with time during the day of experiment and in a typical day in the first week of May. (Color figure available online.)
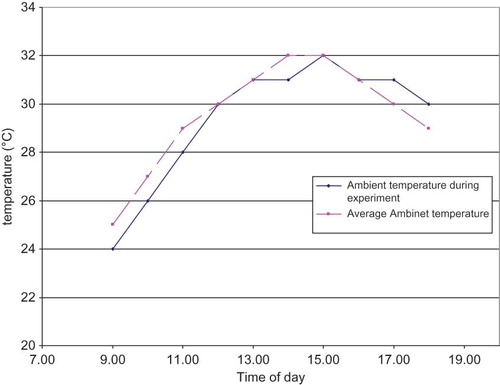
Figure 3 Variation of moisture ratio with drying time during open sun drying of roasted green wheat. (Color figure available online.)
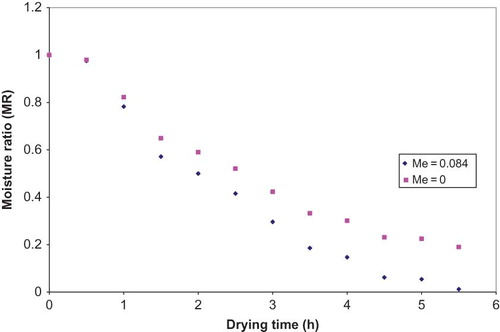
Figure 4 Variation of drying rate with time for roasted green wheat. (Color figure available online.)
Thin Layer Drying Models and Fuzzy Modeling
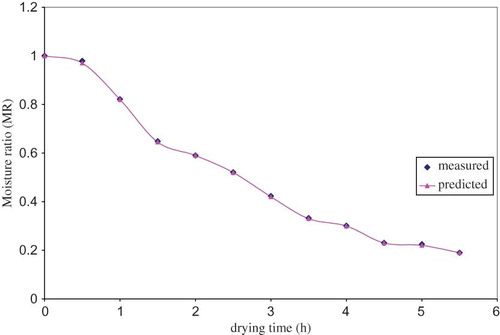
The drying data were fitted with seven known conventional thin-layer drying models, including Lewis, Page, Henderson and Papis, Logistic, Two-term exponential, Geometric, and Wange and Singh models. shows that R 2 varied between 0.85 for the Geometric model and 0.988 for the Two-term exponential model, while RMSE varied between 0.11 for the Geometric model and 0.038 for the Two-term exponential model. Based on the findings above, the Two-term exponential model was selected to model the sun drying of roasted green wheat (although other models, such as Page, Wang and Singh, and the Logistic models, performed well also). A plot of experimental moisture ratio and the Two-term exponential model predicted MR is shown in The figure shows a close agreement between the experimental and predicted values. Better results were obtained using fuzzy modeling with RMSE = 1.2 × 10⁻⁶ and R2 = 0.999. In addition, better agreement between experimental and predicted values was observed when using fuzzy model to predict moisture ratio for roasted green wheat as shown in
Table 2 Thin-layer model fitting results for roasted green wheat
Figure 5 Comparison between experimental and predicted moisture ratio for roasted green wheat sun drying using two–terms exponential model. (Color figure available online.)
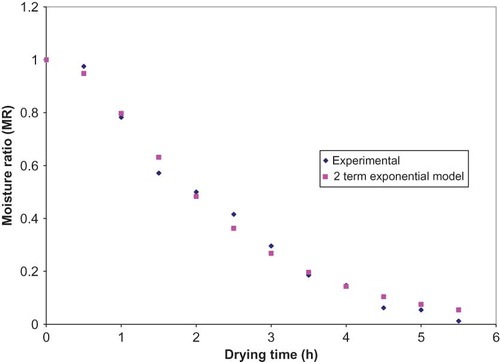
Figure 6 Comparison between experimental and predicted moisture ratio for roasted green wheat sun drying using fuzzy modeling. (Color figure available online.)
Effective Diffusivity
Effective diffusivity was obtained by plotting the relationship between ln (MR) and drying time (t) in hours. The slope of the relationship was used to calculate Deff. . The effective mean diameter of roasted green wheat kernels, measured using a digital caliper, was 4.74 ± 0.11 mm. Effective diffusivity was estimated to be 1.726 × 10⁻¹¹ m2/s after correcting for ellipsoidal shape of wheat kernel by multiplying by a factor of 0.86 according to findings reported by Gastón et al.Citation[10] They reported that effective diffusivity for wheat ranged between 3.336 and 7.772 × 10⁻¹¹ m2/s. Jaros et al.,Citation[23] however, reported a diffusivity range between 1 and 2.4 ×10⁻¹⁰ m2/s for wheat kernels. shows the effective diffusivity of some common crops. The present study results were in agreement with those reported by Madamba et al.Citation[24] It can be noted also that effective diffusivity is located within the general range of 10−09 to 10−11 m2/s for food materials.
Table 3 Comparison of moisture diffusivity of roasted green wheat with wheat and other grains
CONCLUSIONS
Drying roasted green wheat from 43 to 13% under sun drying conditions was accomplished in 5.5 h. Among the conventional thin layer drying models, the two-term exponential model was found to best fit the roasted green wheat sun drying data. Fuzzy modeling, however, provided better modeling capabilities compared to conventional models. All drying of roasted green wheat under sun drying conditions was in the falling rate period. Effective diffusivity of roasted green wheat was found to be 1.73 × 10⁻¹¹ m2/s, which was comparable to other agricultural crops.
NOMENCLATURE
| a, a 0, a 1, a 2, k, k 1, k 2 | = |
Constants in models |
| Deff | = |
Effective diffusivity (m2/s) |
| M | = |
Moisture content at time t (% w.b.) |
| Me | = |
Equilibrium moisture content (% w.b.) |
| Mo | = |
Initial moisture content (% w.b.) |
| M/Mo | = |
Moisture ratio when Me is assumed to be zero. |
| MRexp, I | = |
ith experimentally observed moisture ratio |
| MRpre, I | = |
ith experimentally predicted moisture ratio |
| N | = |
Number of observations |
| n | = |
Constant, positive integer |
| R 2 | = |
Determination of coefficient |
| R | = |
Radius (m) |
| t | = |
Drying time (h) |
| z | = |
Number of constants |
Related Research Data
REFERENCES
- Williams , P.C. and El-Haramein , F.J. 1985 . Frekeh making in Syria—A small but significant local industry . Rachis , 4 : 25 – 27 .
- Bird, A.R.; Mular, M. Product analysis: Greenwheat freekeh. CSIRO Health Sciences and Nutrition, Product Analysis Report, 2003; p. 4. http://www.greenwheatfreekeh.com.au/prod_analysis.pdf (http://www.greenwheatfreekeh.com.au/prod_analysis.pdf)
- Okos , M.R. , Nasimhan , G. , Singh , R.K. and Witnaue , A.C. 1992 . “ Food dehydration. In: D. R. Heldman; D. B. Lund; (Eds.) ” . In Handbook of Food Engineering , New York : Marcel Dekker .
- Basunia , M.A. and Abe , T. 2001 . Thin-Layer solar drying characteristics of rough rice under natural convection . Journal of Food Engineering , 47 : 295 – 301 .
- Sun , D. and Woods , J.L. 1994 . Low-temperature moisture transfer characteristics of barley: Thin-layer models and equilibrium isotherms . Journal of Agricultural Engineering Research , 59 : 273 – 283 .
- Imoudu , P.B. and Olufayo , A.A. 2000 . The effect of sun-drying on milling yield and quality of rice . Bioresource Technology , 74 ( 3 ) : 267 – 269 .
- Sun , D.W. and Woods , J.L. 1994 . Low temperature moisture transfer characteristics of wheat in thin layers . Transactions of ASAE , 37 ( 6 ) : 1919 – 1926 .
- Sinicio , R. , Muir , W. , Jayas , D.S. and Cenkowski , S. 1995 . Thin-layer drying and wetting of wheat . Postharvest Biology and Technology , 5 ( 3 ) : 261 – 275 .
- Giner , S.A. and Mascheroni , R.H. 2001 . Diffusive drying kinetics in wheat, Part 1: Potential for a simplified analytical solution . Journal of Agricultural Engineering Research , 80 ( 4 ) : 351 – 364 .
- Gastón , A.L. , Abalone , R.M. , Giner , S.A. and Giner , D.M. 2003 . Geometry effect on water diffusivity estimation in prointa-isla verde and broom wheat cultivars . Latin America Applied Research , 3 ( 33 ) 327–331
- Togrul , I.T. 2005 . Convective heat transfer coefficient of apricots under open sun drying conditions . Chemical Engineering Communication , 192 ( 8 ) : 1036 – 1045 .
- Srikiatden , J. and Roberts , J.S. 2008 . Measuring moisture diffusivity of potato and carrot (core and cortex) during convective hot air and isothermal drying . Journal of Food Engineering , 74 ( 1 ) : 143 – 152 .
- Roberts , J.S. , Kidd , D.K. and Padilla-Zakour , O. 2008 . Drying kinetics of grape seeds . Journal of Food Engineering , 89 : 460 – 465 .
- Babuska , R. 1998 . Fuzzy Modelling for Control , Dordrecht , , The Netherlands : Kluwer Academic Publishers .
- ASAE . 1983 . “ ASAE standard s352.1 ” . In Moisture measurement––Grains and seeds ASAE: St. Joseph , MI
- Lewis , W.K. 1921 . The rate of drying of solid materials . Journal of Industrial Engineering Chemistry , 13 ( 5 ) : 427 – 432 .
- Page , G. 1949 . Factor influencing the maximum rates of air drying shelled corn in thin layer , MS Thesis (unpublished), Purdue University, West Lafayette, IN, USA .
- Togrul , I.T. and Pehlivan , D. 2004 . Modelling of thin layer drying kinetics of some fruits under open-air sun drying process . Journal of Food Engineering , 65 ( 3 ) : 413 – 425 .
- Crank , J. 1975 . The Mathematics of Diffusion , Oxford , U.K : Clarendon Press .
- Riva , M. and Peri , C. 1986 . Kinetics of sun and air-drying of different varieties of seedless grapes . Journal of Food Engineering , 21 : 199 – 208 .
- SAS . 2002 . Users's Guide. Release, 8.2 , Cary , NC : SAS Institute Inc .
- Diamante , L.M. and Munro , P.A. 1993 . Mathematical modeling of thin layer solar drying of sweet potatoes slices . Solar Energy , 51 : 271 – 276 .
- Jaros , M. , Cenkowski , S. , Jayas , D.S. and Pabis , S. 1992 . A method of determination of the diffusion coefficient based on kernel moisture content and its temperature . Drying Technology , 10 ( 1 ) : 213 – 222 .
- Madamba , P.S. , Driscoll , R.H. and Buckle , K.A. 1996 . The thin layer drying characteristics of garlic slices . Journal of Food Engineering , 29 : 75 – 97 . 1996
- Adu , B. and Otten , L. 1996 . Diffusion characteristics of white beans during microwave drying . Journal of Agricultural Engineering Research , 64 ( 1 ) : 61 – 70 .
- Zuritz , C.A. and Singh , P. 1985 . An equation to compute the heat of evaporation of water for rough rice during drying . Drying Technology , 3 ( 3 ) : 421 – 424 .
- Suarez , C. , Viollaz , J. and Chirife , J. 2002 . Diffusion analysis of air drying of grain sorghum . Journal of Food Technology , 15 ( 5 ) : 523 – 531 .
- Kitic , D. and Viollaz , P.E. 1984 . Comparison of the drying kinetics of soybeans in thin layer fluidized beds . Journal of Food Technology , 19 ( 4 ) : 399 – 408 .
- Chandra , P.K. and Singh , R.P. 1995 . Applied Numerical Methods for Food and Agricultural Engineers , Boca Raton , FL : CRC Press .
- Liu , Q. and Bakker-Arkema , F.W. 1997 . Stochastic Modelling of Grain Drying: Part 2. Model Development . Journal of Agricultural Engineering Research , 66 ( 4 ) : 275 – 280 .
- Agrawal , Y.C. and Singh , R.D. 1977 . Thin layer drying studies for short grain rice , MI , USA : ASAE Press, St. Joseph . Paper No.: 77-3531
- Chhinman , M.S. 1984 . Evaluation of selected mathematical models for describing thin layer drying of in-shell pecans . Transactions of the American Society of Agricultural Engineers , 27 : 610 – 615 .
- Wang , C.Y. and Singh , R.P. 1978 . A single layer drying equation for rough rice , MI , , USA : ASAE Press, St. Joseph . Paper No. 78-3001
- Henderson , S.M. 1974 . Progress in developing the thin layer drying equation . Transactions of the ASAE , 17 : 1167 – 1168 .