Abstract
Two imported commercial cheeses (Cheddar and Gouda) were analyzed to characterize their textural changes during a storage period from 176 to 362 days at 4°C. Fractal dimension analysis was used to examine the structure of the cheeses, and a scaling model based on stress values was used to calculate fractal dimension (Df) by the Hausdorff dimension count method. It was found that the variation of Df of two cheeses showed a similar trend. When two cheeses were stored from 176 to 300 days, their Df ranged from 2.37 to 2.43 for Cheddar or from 2.06 to 2.23 for Gouda cheeses. After that, the final values of Df increased obviously to 2.87 (Cheddar cheese) or 2.63 (Gouda cheese) at the end of the storage period. The experiments carried out showed that the variation of Df had a poor relationship with the changes of pH 4.6 soluble nitrogen and two instrumental textural indices (hardness and springiness) of the cheeses, especially in the late storage period, but the inhomogeneous cavities existing in the cheeses could be reflected by their Df.
INTRODUCTION
During storage of cheeses, some biochemical changes occur and lead to the development of the typical textures for different cheese varieties,Citation1 Citation2 characterized by the facts, such as the body of the fresh cheese losing its firm, tough, and curd textures, and becoming softer.Citation3–5 Instrumental texture profile analysis, uniaxial compression, and puncture test were widely used to assay cheese texture and provide information on both the deformation and fracture properties of the cheeses.Citation6 Citation7 However, these texture analysis methods are somewhat empirical,Citation8 and the obtained assaying values were quite changeable with cheese varieties or batches, which made them difficult to become a universal or useful approach to monitor cheese quality.Citation9–11
The microscopy methods are widely applied to analyze cheese microstructure. The development of complex instrumentation, such as transmission, scanning, cry-scanning and environmental electron microscopy, confocal laser scanning microscopy, dynamic light scattering, and nuclear magnetic resonance, have facilitated us to understand the structures and to predict functional properties of the cheeses during ripening.Citation12–14 Unfortunately, most microscopic approaches are unable to qualitatively analyze the microstructure of the cheeses.Citation15 Fractal analysis technique now is a powerful tool in protein science. The concept of fractal analysis was originally developed as a quantitative method to measure the complexity of structures that show a pattern of self-similarity.Citation16 Citation17 Protein aggregates can be characterized as a kind of fractal, thus it is feasible to determine its fractal dimension (Df ) by using different methods, such as light-scattering, rheology, or microscopy.Citation18–21 Shih et al. developed a scaling theory about the elastic properties of colloidal gels by considering the network structures of the gels as packed fractal flocks, and found that both the elasticity of the gels (E) and the limit of linearity (γ0) exhibited a power-law behavior with respect to particle concentration (ψ), where the exponent was partly determined by Df .Citation22 Wu and MorbidelliCitation23 proposed a revised version of the model of Shih et al.,Citation22 through which the fractal dimension of colloidal gels could be estimated in any gelatin regime. Dávila and ParésCitation24 evaluated the fractal structure of plasma protein gels with the rheological model and scanning electron microscopy. They determined Df by the box count method, and found that the value of Df ranged from 2.63 to 2.83. However, the current method of applying the box count method to scanning electron microscopy (SEM) binary images is not suitable to cheeses. The cheese gels were different from the colloidal gels (a homogeneous body).
In the present article, the textural changes of two cheeses, Cheddar and Gouda cheese, were determined during their storage period, and the fractal dimension of the cheeses' texture was evaluated. The stress values were used to calculate Df by the Hausdorff dimension count method, which had been applied in other works.Citation25–27 The main aim was to analyze the correlation between Df and some macroscopic properties of the cheeses, and to show a new approach to predict some technological and textural properties of the cheeses with Hausdorff dimension.
MATERIALS AND METHODS
Materials
The Cheddar and Gouda cheese samples imported from Holland were obtained from a local supermarket in Harbin, and the pieces of Cheddar and Gouda cheeses with airtight packaging independently ranged from 176 to 362 days of maturation at 4°C. The chemical compositions of two cheeses were analyzed in triplicate with the methods below. All chemicals used were analytical reagents, and the water used was distilled water.
Analysis of Some Chemical Compositions
An appropriate sample size of the cheeses (about 50 g) was removed from various sections of the cheese blocks on the day following storage periods, and analyzed for fat, moisture, and protein content by the Babcock method 933.05, oven drying by method 926.08 and the Kjeldahl method 920.123,Citation28 respectively. Meanwhile, pH 4.6 soluble nitrogen (pH 4.6 SN) was determined with the method of Kuchroo and FoxCitation29 as indices of proteolysis. Twenty grams of cheese samples were mixed with 60 mL of distilled water and adjusted to pH 4.6 with 0.1 moL/L HCl, then homogenized for 10 min. The mixture was placed in a centrifuge tube, warmed to 40°C for 1 h, centrifuged at 3000× g for 30 min, and filtered through Whitman No. 4 filter paper. The residue was re-extracted with 60 g distilled water again. The extracts obtained were combined and subjected to nitrogen content analysis. All analyses were performed in triplicate.
Instrumental Texture Profile Analysis
Instrumental textural properties of the cheese samples were measured with an Instron Universal Testing Machine (QTS25 model, Instron Corporation, Stevens, UK). Cylinders of the cheese samples, 12.90 mm in diameter and 15.00 mm height, were prepared at 4°C from the inside of the cheese using a steel borer-type cutter, and left at room temperature (20 ± 1°C) for at least 2 h prior to testing. The test parameters applied were the same as those in the work of Pons and Fiszman.Citation30 Citation31 The samples were compressed to 66% of their original height at a crosshead speed of 1.0 mm/s; each test was repeated at least in triplicate.
Microstructure Observation
Cheese samples (in triplicate) were prepared and subjected for scanning electron microscopy analysis after different storage periods with the method of Madadlou et al.Citation32 Cheese blocks were cut into approximately 5–6 mm3 cubes with a sharp razor and immersed in 2.5% gluteraldehyde for 3 h. The cubes were then washed with distilled water six times (1 min each), dehydrated in a graded (40, 55, 70, 85, 90, and 95%) series of ethanol for 30 min each, followed by defatting with chloroform for three times (10 min each). The samples were kept refrigerated and covered with ethanol until they were freeze fractured in liquid nitrogen to approximately 1-mm pieces. The pieces were mounted on aluminum stubs with silver paint, dried to critical-point and coated with gold for 6 min in a sputter-coater (type SCD 005, BalTec Inc., Balzers, Switzerland). The samples were viewed with a scanning electron microscope (model CM12, Philips, Eindhoven, the Netherlands) operated at 15.0 kV. Photomicrographs were recorded at 3000 and 5000 magnifications.
Calculation of Hausdorff Dimension from the Stress Values of the Cheese Samples
The cheeses stress (r) was determined by a uniaxial compression test with a TA-XT2 texturometer (Stable Micro Systems Ltd., Surrey, UK) using a cylindrical aluminium plunger of 50 mm diameter at 176, 205, 238, 268, 300, 330, and 362 days. The assaying was carried out at room temperature according to the following conditions: preload force of 10−3 N, force ramp rate of 5 mm/min. The samples evaluated were cut into cylindrical portions of 12.90 mm diameter and 15.00 mm height with a steel borer-type cutter. The measures were performed in triplicate. The stress values subsets were obtained as the plunger was compressing until samples were destroyed, and used to calculate Df . The definition of the Hausdorff dimension was given in EquationEq. (1), where Df is the Hausdorff dimension of r, N(r) denotes the numbers of Df -dimensional Hausdorff object with r to measure, the parameter C is constant. EquationEquation (1) can be expressed in logarithm form as EquationEq. (2):
The fractal dimension of the cheese is designed as Df , which is the linear slope of EquationEq. (2). The parameter r represents the stress of the cheese samples, and its value typically ranges from 0.01 to 8.92 N for the cheese gels. N(r) represents the drop serial numbers of stress values.Citation25–27 Since the determination of df by linear analysis is based on one dimension, it is necessary to add two extra dimensions to calculate value in the three-dimensional features of the cheese according to EquationEq. (3).Citation24
Statistical Analysis
Analysis of variance (ANOVA) was conducted using SPSS version 12 (SPSS Inc., Chicago, IL, USA). Replicate means were considered significantly different at P < 0.05 unless stated differently. When significant differences were indicated by ANOVA, Tukey pair-wise comparisons were performed to indicate where the differences between properties existed.
RESULTS AND DISCUSSION
Chemical Composition of the Cheeses
Some chemical compositions of Cheddar and Gouda cheese samples during storage periods are shown in . No difference was found for moisture, proteins, or fat due to each sample being sealed airtight independently.
Table 1 Main chemical compositions of two cheeses during storage period studied
Hausdorff Dimensions of the Cheeses
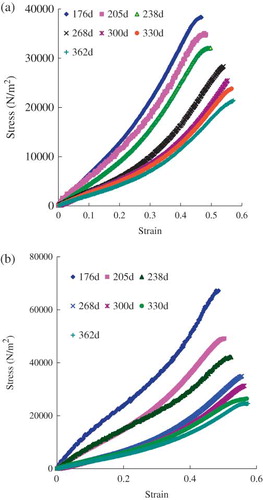
Figure 1 gives the corresponding stress–strain curves for Cheddar and Gouda cheese samples stored at 176, 205, 238, 268, 300, 330, and 362 days. After the determination of the limit of linearity for each cheese sample, double-logarithmic plots of the serial numbers (N(r)) versus drop order stress values (r) were constructed, and the values were used to calculate Df by the Hausdorff dimension count method using EquationEq. (2), which are given in . The values of Df ranged from 2.37 to 2.43 for Cheddar or 2.06 to 2.23 for Gouda between 176 days and 300 days showing a slow variation, and then the values of Df obviously increased to 2.87 (Cheddar) and 2.63 (Gouda) for the rest of the storage period.
The Df , which reflected structure changes, occurred in the cheese samples and gave the information about cheese texture, depending on stress values. The stress–strain tests based on large destructive deformations was applied to study fracture properties of the cheese.Citation33 Stress–strain and stress relaxation measurements had been successfully used to describe the textural changes of several cheeses during ripening.Citation34–36 In the authors' work, all lines of stress–strain showed an upward trend, and the levels decreased progressively with an extension of the storage time, reaching the lowest values at 362 days (). However, the feature of Df based on the stress values used to calculate fractal dimension by the Hausdorff dimension count method was quite different from stress–strain curves, it was distinctly increased at the end of the storage period. The results indicated that the Hausdorff dimension might be used to describe the structures of the protein aggregates and the cavities among them.
Table 2 pH 4.6 soluble nitrogen (SN) and two textural parameters of Cheddar and Gouda cheese samples during storage period related to corresponding Hausdorff dimension (D f )
Figure 1 Stress-strain curves for (a) Cheddar and (b) Gouda cheese samples stored at 176, 205, 238, 268, 300, 330, and 362 days. (Color figure available online.)
Correlations of Df and pH 4.6 Soluble Nitrogen of the Cheeses During Storage
The pH 4.6-soluble nitrogen (SN) of the two cheeses during the storage period studied is shown in . Analysis indicated that pH 4.6-SN of both cheeses continued to increase during the whole storage period, the values of Gouda cheese increased from 17.6 to 31.63%, while that of Cheddar cheese increased from 26.90 to 33.59%. This result was due to continuous proteolysis in the cheeses, which was the most important reaction occurring during ripening of the cheeses.Citation37–39 It is wildly believed that proteolysis is responsible for these textural changes in cheeses, and that their texture behavior could be influenced by changes in their degree of hydrate of proteins that interacted with the casein matrix in the curd.Citation40 Citation41 However, a poor relationship was found between the variations of the pH 4.6-SN during the storage period studied for the two cheeses and corresponding Df , especially in the late storage period. When the cheese samples were stored in a time period of 300 to 362 days, their pH 4.6-SN increased at a slower rate (from 32.40 to 33.59% for Cheddar, or from 26.75 to 31.63% for Gouda), in contrast, the value of Df increased clearly (from 2.42 to 2.87 for Cheddar, or from 2.23 to 2.63 for Gouda). This result meant that there was no clear relationship between proteolysis and Df changes with storage time.
Df and Instrumental Textural Characteristics of the Two Cheeses
Instrumental textural characteristics are widely applied indexes to quantify cheese texture, but there is often a poor relationship between these parameters and quality of cheeses.Citation9 Citation10 In this work, the variations of some textural characteristics of two cheeses during storage period are given in . An obvious and rapid decrease in hardness was found for two cheeses during a storage period of 176 to 300 days. Then, a slow decrease in hardness occurred during the storage period of 300 to 362 days. The variation of textural characteristics of two cheeses was different from their Df , because Df showed little or a slight increase during the first storage time from 176 to 300 days and then a clear increase for the rest of the storage period. There existed no relationship between the hardness (or springiness) and Df of the cheeses. The results suggested that Hausdorff dimension probably was useful for indirectly probing the complex texture and quality of the cheese during storage, which made it impossible with any one of the two instrumental characteristics of the cheeses.
Df and Microstructure of the Two Cheeses
Some SEM images of two cheeses at the different storage times are given in . The size of the aggregates and the cavities among clusters in two cheeses became larger and more inhomogeneous as the storage time increased. The correlation between microstructure and Df of two cheeses was that the more inhomogeneous the cavities were, the higher values of Hausdorff dimension the cheese had. Compared to the Gouda cheese, the Cheddar cheese exhibited more inhomogeneous cavity, so its values of Df were higher than that of Gouda cheese. As the storage periods increased, the two cheeses became more inhomogeneous, and their values of Df exhibited an increasing trend. Based on this result, Hausdorff dimension might be a good alternative to reflect the microstructural changes of the cheeses during storage period.
Figure 2 The SEM photos for Cheddar cheese stored for (a) 240 and (b) 334 days, or Gouda cheese stored for (c) 241 and (d) 330 days.
CONCLUSIONS
The Hausdorff dimension count approach was used to qualitatively analyze microstructural characteristics of Cheddar and Gouda cheese during their storage period of 176 to 362 days, and a scaling model based on stress values was used to calculate fractal dimension (Df ) by the Hausdorff dimension count method. The main compositions (moisture, proteins, and fat) of the two cheeses were kept stable, but the values of Df of the two cheeses had a similar variation trend. When the storage period from 176 days increased to 300 days, the Df of the cheeses changed slightly, after that their Df showed a clear increase. The variations of the pH 4.6-SN, hardness and springiness of two cheeses showed no relation to the Df , especially in the late storage period. The inhomogeneous cavities that existed in the two cheeses could also be reflected by Hausdorff dimension.
ACKNOWLEDGMENTS
This work was supported by the National High Technology Research and Development Program (“863” Program) of China (No. 2006AA10Z324) and Program for Innovative Research Team of Northeast Agricultural University (No. CXT007-1-3).
Related Research Data
REFERENCES
- Fox , P.F. and McSweeney , P.L.H. 2004 . “ Cheese, an overview ” . In Cheese: Chemistry, Physics and Microbiology , 3rd , Edited by: Fox , P.F. , McSweeney , P.L.H. , Cogan , T.M. and Guinee , T.P. 1 – 18 . London , , UK : Elsevier .
- Dervisoglu , M. , Tarakci , Z. , Aydemir , O. , Temiz , H. and Yazici , F. 2009 . A survey on selected chemical, biochemical and sensory properties of Kes cheese, a traditional Turkish cheese . International Journal of Food Properties , 12 ( 2 ) : 358 – 367 .
- Dufour , E. , Mazerolles , G. , Devaux , M.F. , Duboz , G. , Duployer , M.H. and Mouhous Riou , N. 2000 . Phase transition of triglycerides during semi-hard cheese ripening . International Dairy Journal , 10 ( 1 ) : 81 – 93 .
- Karami , M. , Ehsani , M.R. , Mousavi , S.M. , Rezaei , K. and Safari , M. 2009 . Changes in the rheological properties of Iranian UF-Feta cheese during ripening . Food Chemistry , 112 ( 5 ) : 539 – 544 .
- Watkinson , P. , Boston , G. , Campanella , O. , Coker , C. , Johnston , K. and Luckman , M. 1997 . Rheological properties and maturation of New Zealand Cheddar cheese . Le Lait , 77 ( 1 ) : 109 – 120 .
- Benedito , J. , Simal , S. , Clemnte , G. and Mulet , A. 2006 . Manchego cheese texture evaluation by ultrasonics and surface probes . International Dairy Journal , 16 ( 2 ) : 431 – 438 .
- Park , Y.W. 2007 . Rheological characteristics of goat and sheep milk . Small Ruminant Research , 68 ( 1 ) : 73 – 87 .
- Tunick , M.H. 2000 . Rheology of dairy foods that gel, stretch and fracture . Journal of Dairy Science , 83 ( 8 ) : 1892 – 1898 .
- Del Nobile , M.A. , Chillo , S. and Falcone , P.M. 2007 . Textural changes of Canestrello Pugliese cheese measured during storage . Journal of Food Engineering , 83 ( 5 ) : 621 – 628 .
- Hort , J. and Le Grys , G. 2001 . Developments in the textural and rheological properties of UK Cheddar cheese during ripening . International Dairy Journal , 11 ( 3 ) : 475 – 481 .
- Muir , D.D. , Hunter , E.A. , Banks , J.M. and Horne , D.S. 1996 . Sensory properties of Cheddar cheese: Changes during maturation . Food Research International , 28 : 561 – 568 .
- Auty , M.A. , Gardiner , G.E. and McBrearty , S.J. 2001 . Direct in situ viability assessment of bacteria in probiotic dairy products using viability staining in conjunction with confocal scanning laser microscopy . Applied and Environmental Microbiology , 67 : 420 – 425 .
- Budiman , M. , Stroshine , R.L. and Cornillon , P. 2002 . Moisture measurement in cheese analogue using stretched and multi-exponential models of the magnetic resonance T2 relaxation curve . Journal of Dairy Research , 69 : 619 – 632 .
- Everett , D.W. and Auty , M.A.E. 2008 . Cheese structure and current methods of analysis . International Dairy Journal , 18 : 759 – 773 .
- Karami , M. , Rezaei , K. and Safari , M. 2009 . Microstructural properties of fat during the accelerated ripening of ultrafiltered Feta cheese . Food Chemistry , 113 : 424 – 434 .
- Dickinson , E. 1992 . An Introduction to Food Colloids , New York : Oxford University Press .
- Mandelbrot , B. 1983 . The Fractal Geometry of Nature , New York : W.H. Freeman .
- Hagiwara , T. , Kumagai , H. and Nakamura , K. 1996 . Fractal analysis of aggregates formed by heating dilute BSA solutions using light scattering methods . Bioscience Biotechnology and Biochemistry , 60 ( 11 ) : 1757 – 1763 .
- Hagiwara , T. , Kumagai , H. and Matsunaga , T. 1997 . Fractal analysis of the elasticity of BSA and beta-lactoglobulin gels . Journal of Agricultural and Food Chemistry , 45 ( 10 ) : 3807 – 3812 .
- Ikeda , S. , Foegeding , E.A. and Hagiwara , T. 1999 . Rheological study on the fractal nature of the protein gel structure . Langmuir , 15 ( 25 ) : 8584 – 8589 .
- Verheul , M. , Roefs , S.P.F.M. , Mellema , J. and de Kruif , K.G. 1998 . Power law behavior of structural properties of protein gels . Langmuir , 14 ( 9 ) : 2263 – 2268 .
- Shih , W.H. , Shih , W.Y. , Kim , S.I. , Liu , J. and Aksay , I.A. 1990 . Scaling behavior of the elastic properties of colloidal gels . Physical Review A , 42 ( 8 ) : 4772 – 4779 .
- Wu , H. and Morbidelli , M. 2001 . A model relating structure of colloidal gels to their elastic properties . Langmuir , 17 ( 4 ) : 1030 – 1036 .
- Dávila , E. and Parés , D. 2007 . Structure of heat-induced plasma protein gels studied by fractal and lacunarity analysis . Food Hydrocolloids , 21 : 147 – 153 .
- Niu , W.Y. 1988 . Application of Zipf theorem and its extension in quantitative calculation of natural resources . Journal of Natural Resources , 3 ( 3 ) : 271 – 280 .
- Song , J.S. and Guo , E.Z. 2006 . Application of fractal dimension in evaluate of urban comprehensive strength . Journal of Harbin Institute of Technology , 38 ( 8 ) : 1213 – 1215 .
- Song , J.S. and Yu , X.Q. 2003 . Fractal properties and scale structure of Heilongjiang city systems . Journal of Harbin Institute of Technology , 35 ( 8 ) : 1002 – 1005 .
- AOAC . 1990 . AOAC Official Methods of Analysis , 15th , Arlington , VA : Association of Official Analytical Chemists .
- Kuchroo , C.N. and Fox , P.F. 1982 . Soluble nitrogen in Cheddar cheese: Comparison of extraction procedures . Milchwissenschaft , 37 ( 3 ) : 331 – 335 .
- Pons , M. and Fiszman , S.M. 1996 . Instrumental texture profile analysis with particular reference to gelled systems . Journal of Texture Studies , 27 ( 4 ) : 597 – 624 .
- Dimitreli , G. and Thomareis , A.S. 2009 . Instrumental textural and viscoelastic properties of processed cheese as affected by emulsifying salts and in relation to its apparent viscosity . International Journal of Food Properties , 12 ( 1 ) : 261 – 275 .
- Madadlou , A. , Khosrowshahi , A. , Mousavi , M.E. , Emamdjome , Z. and Zargaran , M. 2007 . Effect of cream homogenization on textural characteristics of low-fat Iranian white cheese . International Dairy Journal , 17 : 547 – 554 .
- Messens , W. , Van de Walle , D. , Arevalo , J. , Dewettinck , K. and Huyghebaert , A. 2000 . Rheological properties of high-pressure-treated Gouda cheese . International Dairy Journal , 10 : 359 – 367 .
- Buffa , M.N. , Trujillo , A.J. , Pavia , M. and Guamis , B. 2001 . Changes in textural, microstructural, and colour characteristics during ripening of cheeses made from raw, pasteurized or high-pressure-treated goats' milk . International Dairy Journal , 11 ( 8 ) : 927 – 934 .
- Fenelon , M.A. and Guinee , T.P. 2000 . Primary proteolysis and textural changes during ripening in Cheddar cheeses manufactured to different fat contents . International Dairy Journal , 10 : 151 – 158 .
- Pavia , M. , Guamis , B. , Trujillo , A.J. , Capellas , M. and Ferragut , V. 1999 . Changes in microstructural, textural and colour characteristics during ripening of Manchego-type cheese salted by brine vacuum impregnation . International Dairy Journal , 9 ( 1 ) : 91 – 98 .
- Diane , L. , Michael , H. and Young , W.P. 2004 . Rheological and proteolytic properties of Monterey Jack Goat's milk cheese during aging . Journal of Agricultural and Food Chemistry , 52 : 5372 – 5377 .
- Prieto , B. , Franco , I. and Fresno , J.M. 2004 . Effect of ripening time and type of rennet (farmhouse rennet from kid or commercial calf) on proteolysis during the ripening of León cow milk cheese . Food Chemistry , 85 : 389 – 398 .
- Fox , P.F. 1989 . Proteolysis during cheese manufacture and ripening . Journal of Dairy Science , 72 : 1379 – 1400 .
- Van den Berg , G. and Exterkate , F.A. 1993 . Technological parameters involved in cheese ripening . International Dairy Journal , 3 : 485 – 507 .
- Alizadeh , M. , Hamedi , M. and Khosroshahi , A. 2006 . Modeling of proteolysis and lipolysis in Iranian white brine cheese . Food Chemistry , 97 ( 2 ) : 294 – 301 .