
Abstract
Dielectric properties were measured across a frequency range from 200 MHz to 20 GHz and temperature range from 25 to 85°C for pork meat samples (grouped in four different quality classes). Dielectric properties varied widely with frequency and the loss tangents of different meat quality classes followed different trends. Discriminant analysis indicated that 2400 MHz was most significant (P < 0.05) for separation of the different classes. There were significant changes (P < 0.05) in the dielectric properties within the range of the temperatures corresponding to protein denaturation temperatures. There was clear segregation between the firm and non-exudative (red, firm, and non-exudative; pale, firm, and non-exudative) and the soft and exudative (red, soft, and exudative; pale, soft and exudative) samples. The results showed that dielectric properties could be useful in meat quality classifications.
INTRODUCTION
Current trends indicate that consumers are ready to pay premiums for high quality pork meat. These demands have increased the need of using integrated technologies for assessment of pork meat in order to match consumers’ expectations. Post mortem conversion of glycogen to lactic acid plays an important role in technological pork meat quality attributes. Good quality pork meat, which is red, firm, and non-exudative (RFN), can be obtained from a moderate rate of chilling. However, if lactic acid is produced at an accelerated rate when temperature of the carcass is still high, there will be a rapid fall in pH resulting in degraded meat quality. A combination of an acidic environment with high carcass temperatures enhances denaturation of proteins, contraction of myofibrillar muscle, expulsion of juice present in the meat, and increased light scattering. This results in a pale, soft, and exudative (PSE) meat. Another class of pork meat quality is, namely, red, soft, and exudative (RSE) characterized by a low water-holding capacity (WHC) similar to the PSE meat but with a reddish-pink color as the RFN meat.[Citation1,Citation2]
The extent of denaturation of the muscle proteins differs between RFN and PSE meat.[Citation3,Citation4] Offer and Knight[Citation5] suggested that there is strong evidence that denaturation of myofibrillar proteins, especially myosin, is the cause of the low WHC in PSE pork. The extent of myosin denaturation in RSE pork is not as much as in the PSE class. Some authors reported RSE’s protein denaturation profile as similar to that of RFN meat.[Citation6,Citation7] It has been suggested that denaturation of sarcoplasmic proteins contributes to the low WHC of the RSE quality class.[Citation7Citation–Citation9] The low WHC of RSE meat was also suggested to be caused by low ultimate pH and deposition of phosphorylase and creatine kinase onto the myofibrils.[Citation7] A more recent quality class is the pale, firm, and non-exudative (PFN), which has the texture of good quality meat, but has undesirable color.[Citation10] To the authors’ knowledge, there is not enough information on the protein denaturation profile of the PFN class; observations have not been conclusive. Kazemi et al.[Citation11] suggested that the denaturation of sarcoplasmic proteins is involved in the quality attributes inherent to the PFN class.
The differences in color, WHC, and texture among the different quality classes are widely presumed to be caused by the changes in the proteins denaturation profile of each class. Heat is the major source of changes in the WHC of the constituent structural proteins.[Citation12] Myosin, which accounts for more than 40% of the myofibrillar protein content,[Citation13] denatures in the temperature range of 40 to 60°C.[Citation14] Sarcoplasmic proteins account for about 5.5% of muscle proteins[Citation15] and denature at about 65°C.[Citation16] Collagen is the major connective tissue protein present in meat, and it denatures from 64 to 70°C.[Citation12] Finally, actin is the most heat stable protein and it denatures at temperatures ranging from 71 to 83°C.
Dielectric properties determine the response of a material to an electromagnetic field.[Citation17,Citation18] The dielectric constant (ϵ′) is the measure of the food’s ability to store electromagnetic energy, while the dielectric loss factor (ϵ″) represents the food’s ability to dissipate it.[Citation19] When proteins denature, they change their water and salt binding capacity; since the free water in the system changes during protein denaturation, dielectric properties of the meat are affected. Based on available information, it is possible to use dielectric properties as a means to understand protein denaturation.[Citation17,Citation18] Furthermore, since every meat class is presumed to have a different protein denaturation profile, it could be used to identify pork quality classes by measuring their dielectric properties.[Citation17] However, there is a lack of information in the literature concerning changes of dielectric properties of pork meat in terms of its quality. The purpose of the present study was to determine dielectric properties of pork meat over a wide range of temperature and frequencies and to investigate the relationship between pork quality classes and dielectric properties.
MATERIALS AND METHODS
Equipment
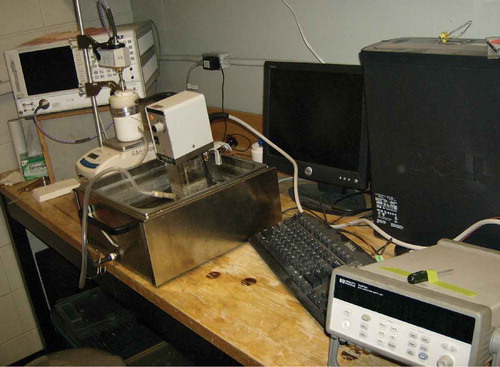
Measurements of the dielectric properties were made with an Agilent 8722 ES s-parameter network analyzer (Agilent Technologies, Santa Clara, CA, USA) equipped with a high temperature probe (model 85070B) and controlled with the Agilent 85070D Dielectric Probe Kit Software Version E01.02 installed in a Dell optiplex computer running on Windows XP Professional. A specially designed sample cell fitted with a thermocouple and water jacket for circulating hot water was used to hold samples for dielectric property measurements. A temperature-controlled water bath was used to circulate water and control the sample temperature during measurements. The complete experimental setup is shown in .
FIGURE 1 Experimental setup for measuring dielectric properties.
Sample Preparation
Samples that were identified as belonging to four different quality classes of pork meat (PFN, RFN, PSE, and RSE) were collected from a nearby pork processing plant and they were transported at controlled temperature (on ice pack) to MacDonald Campus of McGill University. These one-day post-mortem samples were classified subjectively by a meat specialist (with more than 10 years experience). This subjective quality assessment is the standard routine quality control and classification method used in the plant. The samples were collected at different times from October to December 2006. Some samples were analyzed immediately as fresh samples, whereas others were vacuum packed and kept frozen below −18°C (for a maximum period of 2 months, wherein the pork processing plant guarantees a shelf life of 6 months when storage is maintained below −18°C) and analyzed after thawing overnight in a refrigerator at 5°C. This was done to determine the influence of freezing and thawing on dielectric properties. The samples were cut into a disk shape of 20 mm diameter and 10 mm thickness in order to fit the sample holder for the dielectric property measurements. All measurements were replicated thrice.
Dielectric Measurement Procedure
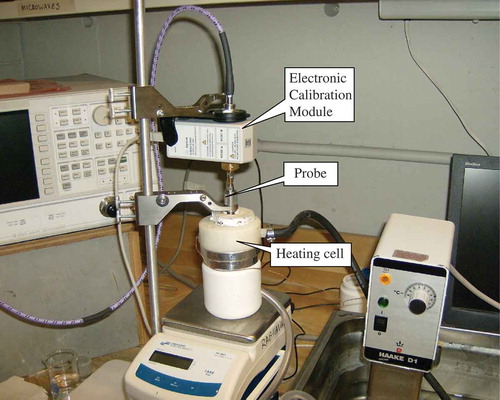
The probe was mounted with the stand, facing downwards in order to ensure that it was in contact with the samples at all times. Calibration of the probe was done before each experiment using a shorting block, air, and water. Then the set-up was checked by measuring the dielectric properties of distilled water to ensure that the calibration was stable. The samples were heated by circulating water from the temperature-controlled water bath set at 80°C (). Measurements were taken every 10°C interval as the samples heated from 20°C to 70°C and at 75°C. This temperature range was chosen in order to allow enough time to set up the apparatus for each measurement, while the meat samples warmed up and also considering that protein denature occurred around 70°C beyond which the dielectric properties should be significantly different from those for raw meat.[17] The heating rate was approximately 5°C/min allowing a homogeneous temperature within the sample. Temperatures of the samples were measured using a thermocouple connected through the bottom of the cell and inserted into the meat to a 5 mm depth. The dielectric properties (ϵ′ and ϵ″) were measured at 51 different frequencies ranging from 200 MHz to 20 GHz.
FIGURE 2 Meat samples placed in the cell for dielectric properties measurements.
Statistical Method
The loss tangent (ϵ′/ϵ″) was calculated from the dielectric properties and SAS version 10.0 (SAS Institute Inc, Cary, NC, USA) was used for the statistical analysis of data. Canonical discriminant analysis (CDA) was used to aid in the visualization of the class distributions. STEPDISC procedure within SAS version 10.0 was used to identify the most important frequencies for the discrimination of samples among classes. Once the discriminant frequencies were chosen, discriminant analysis (DA) was carried out on all data sets in order to assess the feasibility of using dielectric properties as means of quality classification. All the data sets were analyzed with a confidence level of 0.05.
RESULT AND DISCUSSION
Dielectric Properties at 2400 MHz
and show the variation of dielectric properties as function of temperature at 2400 MHz. This frequency was the first to be selected as a discriminant for classification of meat quality. It is also close to the regular household microwave frequency of 2450 MHz. The results show that both ϵ′ and ϵ″ were inversely proportional to temperature. Many authors have reported that dielectric properties decrease with increasing temperature.[Citation12,Citation20Citation–Citation22] Barringer and Bircan[Citation17] reported that the dielectric constant and loss factor of beef at 2450 MHz decreased slightly initially but started to increase between 65 and 75°C. Changing the frequency from 2450 to 915 MHz increased both the absolute values of the dielectric constant and loss factor as well as the extent of the increase at denaturation temperatures. It is difficult to directly compare the results for this study to the others in the literature because of differences in samples and the frequency range used. However, the range of values obtained in this study for the pork meat samples are comparable with those reported for turkey meat[Citation20] and beef meat.[Citation17]
FIGURE 3 Dielectric constant of various pork quality classes for fresh and frozen samples (left and right), respectively, at 2400 MHz.
FIGURE 4 Dielectric loss factor of various pork quality classes for fresh and frozen samples (left and right), respectively, at 2400 MHz.
Protein Denaturation
There was little or no difference between the fresh and frozen samples. The effect of temperature on dielectric properties of the different classes of meat quality was varied. The patterns of change in dielectric constant and dielectric loss for RFN meat were generally similar to the patterns for RSE. There was a marked change in the properties at about 60°C, which apparently correspond to peak of denaturation of collagen in the samples. Joo et al.[Citation3] noted that samples from these two classes do not differ in their sarcoplasmic, myofibrillar, and total protein solubilities, thus, implying that they show a similar protein denaturation profile. Kazemi et al.[Citation11] also reported that RFN and RSE samples exhibited similar protein denaturation characteristics and were not significantly different in their thermodynamic protein denaturation parameters.
Dielectric Properties
Dielectric constant of PFN samples did not change much over the temperature range used in this study. There was a sudden increase in dielectric loss of PFN samples at 70°C. Sacroplasmic proteins denatured at a temperature close to 70°C.[Citation15] Kazemi et al.[Citation11] used differential scanning calorimetry analysis to show that although PFN pork meats have similar myofibrilar protein denaturation characteristics, they have significantly different sarcoplasmic protein denaturation characteristics when compared to normal (RFN) pork meats. Although the mechanisms that govern the variations of dielectric properties are not well understood, it appears that the changes might be related to levels of protein denaturation and availability of water in the samples.
shows changes in loss tangent with respect to temperature. Loss tangent of the meat samples remained almost constant with marked changes at about 70°C. This indicates that significant denaturation occurred around this temperature.[Citation17,Citation18] Values of loss tangent at 70°C decreased with increasing frequency as shown in . Although the loss tangents of different meat quality classes followed different trends, they have an overall decreasing trend. Thus, the difference between loss tangents reflects the difference between pork meat qualities.
FIGURE 5 Loss tangent as a function of temperature at 2400 MHz for fresh and frozen samples (left and right), respectively.
FIGURE 6 Loss tangent as a function of frequency at 70°C for fresh and frozen samples (left and right), respectively.
Canonical Discriminant Analysis (CDA)
The plot of CDA results for fresh and frozen meat samples at 70°C is shown in and , respectively. There was a clear segregation between the FN (RFN and PFN), and the SE (PSE and RSE) samples. The STEPDISC procedure selected 9 out of 55 frequencies to be discriminant for the classification of pork quality at 70°C. These frequencies were: 200, 2180, 2400, 4160, 4560, 5350, 6140, 8120, and 18,000 Mhz. The significance levels for the STEPDISC procedure were both set at 0.05, for the inclusion and removal of variables. The difference in loss tangent values was statistically significant (p < 0.05) only in the above mentioned frequencies. As a result, to build the classification model, these nine frequencies were used and tested.
FIGURE 7 Canonical analysis plot of fresh meat samples from four quality classes based on their dielectric properties.
FIGURE 8 Canonical analysis plot of frozen meat samples from four quality classes based on their dielectric properties.
A leave-one-out cross-validation method was performed to evaluate the predictive ability of the model. A classification accuracy of 100% was obtained for the classification of meat samples in the four quality classes, using dielectric properties of fresh and frozen meat samples (). To simplify the model, the number of frequencies was reduced; using only the 2400 MHz frequency, an accuracy of 100% was achieved. The cross-validation results suggest that it is possible to use both dielectric properties, expressed as loss tangent, to differentiate between the four pork meat quality classes. The 2400 MHz frequency used to build the classification model is close to the Industry, Science and Medicine permitted frequency of 2450 MHz. The network analyzer used to generate this frequency is relatively inexpensive.
TABLE 1 Cross-validation matrix for the classification of fresh and frozen meat into four quality classes using dielectric properties
CONCLUSION
This study suggests that dielectric properties measurements could be used as a non-destructive method to classify cooked meat into different quality classes. The best frequency used to build the classification model in order to discriminate pork meat upon its quality was 2400 MHz. The best classification was obtained at the thermal denaturation temperature of 70°C. More studies are required to clarify the relationship between different profiles of dielectric properties with denaturation of specific protein components in the different meat quality classes.
FUNDING
This study was funded by the Natural Sciences and Engineering Research Council (NSERC) of Canada.
REFERENCES
- Kauffman, R.G.; Cassens, R.G.; Scherer, A.; Mecker, D.L. Variation in Pork Quality; National Pork Producers Council Publication: Des Moines, IA, 1992.
- Kauffman, R.G.; Sybesma, W.; Smulders, F.J.M.; Eikelenboom, G.; Ebgel, B.; van Laack, R.L.J.M.; Hoving-Bolink, A.H.; Sterrenburg, P.; Nordheim, E.V.; Walstra, P.; van der Wal, P.G. The effectiveness of examining early post-mortem musculature to predict ultimate pork quality. Meat Science 1993, 34, 283–300.
- Joo, S.T.; Kauffman, R.G.; Kim, B.C.; Park, G.B. The relationship or sarcoplasmic and myofibrillar protein solubility to colour and water-holding capacity in porcine longissimus muscle. Meat Science 1999, 52, 291–297.
- Swatland, H.J. On-line monitoring of meat quality. In: Meat Processing: Improving Quality; Kerry, J.; Kerry, J.; Ledward, D.; Eds.; CRC Press, Woodhead Pub.: Cambridge, England, 2002.
- Offer, G.; Knight, P. The structural basis of water-holding in meat. In: Developments in Meat Science, 4th Ed.; Lawrie, R.A.; Ed.; Elsevier Applied Science: London, 1988; 63–243.
- Warner, R.D. Physical properties of porcine musculature in relation to postmortem biochemical changes in muscle proteins. Ph.D. Thesis, University of Wisconsin-Madison, Madison, WI, 1994.
- Warner, R.D.; Kauffman, R.D.; Greaser, M.L. Muscle protein changes post mortem in relation to pork quality traits. Meat Science 1997, 33, 359–372.
- Wilson III, G.G.; van Laack, R.L.J.M. Sarcoplasmic proteins influence water-holding capacity of pork myofibrils. Journal of the Science of Food and Agriculture 1999, 79, 1939–1942.
- Boles, J.A.; Parrish, F.C. Jr.; Huiatt, T.W.; Robson, R.M. Effects of porcine stress syndrome on the solubility and degradation of myofibrillar/cytoskeletal proteins. Journal of Animal Science 1992, 70, 454–464.
- Van Laack, R.L.J.M.; Kauffman, R.G.; Sybesma, W.; Smulders, F.J.M.; Eikelenboom, G.; Pinherio, J.C. Is colour brightness (L-value) a reliable indicator of water-holding capacity in porcine muscle? Meat Science 1994, 38, 193–202.
- Kazemi, S.; Ngadi, M.O.; Gariépy, C. Protein denaturation in pork longissimus muscle of different quality groups. Journal Food and Bioprocess Technology 2009, In Press. DOI: 10.1007/s11947-009-0201-3.
- Brunton, N.P.; Lyng, J.G.; Zhang, L.; Jacquier, J.C. The use of dielectric properties and other physical analyses for assessing protein denaturation in beef biceps femoris muscle during cooking from 5 to 85°C. Meat Science 2006, 72, 236–244.
- Greaser, M.L.; Wang, S.M.; Lemanski, l.F. New myofibrillar proteins. Proceedings of the American Meat Science Association 1981, 34, 12–16.
- Bendall, J.R.; Wismer-Pederson, J. Some properties of the fibrillar proteins of normal and watery pork muscle. Journal of Food Science 1962, 27, 144–159.
- Keeton, J.T.; Eddy, S.M. Chemical methods for decontamination of meat and poultry. In: Preharvest and Post Harvest Food Safety. Contemporary Issues and Future Directions; Beier, R.C.; Pillai, S.D.; Phillips, T.D.; Eds.; Blackwell Publishing: Ames, IA, 2004; 319–336.
- Bertram, H.C.; Zhiyun, W.; van der Berg, F.W.J. NMR relaxometry and differential scanning calorimetry during meat cooking. Meat Science 2006, 74, 684–689.
- Barringer, S.A.; Bircan, C. Use of the dielectric properties to detect protein denaturation. In: Advances in Microwave and Radio Frequency Processing; Willert-Porada, M.; Ed.; Report from the 8th International Ampere Conference on Microwave and High Frequency Heating; Springer: New York, 2006; 107–118.
- Bircan, C.; Barringer, S.A.; Mangino, M.E. Use of dielectric properties to detect whey protein denaturation. Journal of Microwave Power Electromagnetic Energy 2001, 36, 179–186
- Datta, A.K.; Sumnu, G.; Raghavan, G.S.V. Dielectric properties of foods. In: Engineering Properties of Foods, 4th Ed.; Rao, M.A.; Rizvi, S.S.H.; Datta, A.K.; Eds.; CRC Press: Boca Raton, 2005; 501–565.
- Sipahioglu, O.; Barringer, S.A.; Taub, I.; Yang, A.P.P. Characterization and modeling of dielectric properties of turkey meat. Journal of Food Science 2003, 68 (2), 521–527.
- Fasina, O.O.; Farkas, B.E.; Fleming, H.P. Thermal and dielectric properties of sweetpotato puree. International Journal of Food Properties 2003, 6 (3), 461–472.
- Coronel, P.; Simunovic, J.; Sandeep, K.P.; Kumar, P. Dielectric properties of pumpable food materials at 915 MHz. International Journal of Food Properties 2008, 11 (3), 508–518.