Abstract
Rice protein isolates and extracts of protein fractions were prepared from Indian rice cultivars, namely, Jaya, HKR-120, P-44, Sharbati, Bas-370, and HBC-19. The protein extracts were characterized using SDS-PAGE. The total protein contents of rice cultivars ranged from 5.46 to 7.02 g/100 g sample with albumin and glutelin fractions showing the highest variability among rice cultivars. The electrophoretic patterns of protein fractions exhibited many varietal differences with glutelin fraction revealing the most heterogeneous (10–17 polypeptide units) and prolamin fraction revealing the most homogenous polypeptide composition (3 polypeptide units). The alkali extracted rice endosperm protein isolates showed favorable emulsifying and foaming capacities particularly at an alkaline pH of 11. The total protein content was significantly correlated positive with foaming capacity (r = 0.917, p < 0.01) and negative with oil absorption capacity (r = −0.914, p < 0.05). The total protein content was also correlated significantly positive with cooking time (r = 0.956, p < 0.01) and cooked grain hardness (r = 0.966, p < 0.01).
INTRODUCTION
Protein is an important part of rice endosperm not only because it is the second most abundant component, but also because of its ability to bind with starch and affect the overall rice grain functionality. The protein quality of rice ranks high as it is rich in lysine. Rice proteins have unique hypoallergenic properties compared with other cereal and legume proteins.[Citation1] The hypoallergenic property and the high nutritive quality could make rice protein concentrate or isolate a competitive protein ingredient in the food ingredients market. Rice starch is widely used in food systems, cosmetics, and medicines, but the use of rice protein in food systems is now limited due to its unavailability and unknown functional properties. The protein content of brown rice ranges from 5 to 17% with globulin (about 12%) and glutelin or oryzenin (about 80%) as the two major proteins, and albumin (about 5%) and prolamin (about 3%) as the minor one.[Citation2] The biologically active rice albumins have a wide range of molecular weights from 10 to 200 kDa.[Citation3] Glutelins, the major rice storage proteins, are soluble in dilute acid or alkaline solution. The two subunits of glutelins are classified as acidic and basic subunits with apparent molecular weights of 30–39 and 19–25 kDa, respectively.[Citation3]
There have been normally two approaches used for the preparation of rice protein isolates. The one is alkali solubilization followed by acid precipitation, and the second is by using starch hydrolyzing enzymes to separate the rice proteins from rice flour by solubilizing and removing starch.[Citation4] However, due to comparatively more favorable protein composition, higher solubility, and lower degree of thermal denaturation of alkali extracted proteins,[Citation4] the most commonly used method for preparing rice protein isolates is alkali extraction followed by acid precipitation. The major dominant technique utilized by the cereal chemists to characterize the proteins for their composition is electrophoresis, such as sodium dodecyl sulfate polyacrylamide gel electrophoresis (SDS-PAGE) and SDS capillary electrophoresis (SDS-CE), which have been developed to separate cereal proteins. Agboola et al.[Citation5] characterized an Australian rice variety for its different protein fractions using capillary electrophoresis (SDS-CE) and SDS-PAGE, and observed that SDS-CE showed slightly higher molecular weight compared to equivalent bands from SDS-PAGE. White rice and brown rice proteins have been reported to contain high molecular weight polypeptides than those of rice bran proteins as studied by SDS-PAGE.[Citation6] The electrophoregram of rice proteins prepared by alkaline extraction method and enzymic solubilization method revealed major polypeptides of 13 kDa albumin, 26 kDa globulin, 22–23 kDa and 37–39 kDa glutelin, and small quantities of 10 kDa and 16 kDa prolamin as characterized by SDS-PAGE.[Citation7] Steenson and Sathe[Citation8] reported major polypeptides in albumin, globulin, prolamina, and glutelin having molecular masses 14.1 kDa; 13.9 kDa and 20.3 kDa; 13.6 kDa; and 20.4 and 30.9 kDa, respectively, as studied using SDS-PAGE in Basmati Dehraduni variety of rice.
Although cooking, eating, and processing qualities of rice are mainly attributed to the starch component of the endosperm, rice proteins also appear to play important role in determining rice quality. The greatest part of the total protein is located in the endosperm and the main characteristics of the proteins are determined by the properties of the endosperm storage protein, i.e., glutelin.[Citation9] A number of studies have shown the relationship between protein content and rice quality attributes. Juliano et al.[Citation10] demonstrated that increased protein content within a cultivar resulted in a firmer texture of cooked rice. Teo et al.[Citation11] reported that modification of the protein component, rather than the starch, was primarily responsible for rheological changes associated with aging of rice flour. The determination of protein content and its electrophoretic characterization not only provides a basis for varietal difference, but it also provides useful information regarding the cooking and textural quality characteristics of different rice cultivars. Understanding of basic physicochemical and functional properties of a protein is very important for its application in food products. The hydration properties, foaming ability, emulsification capacity, and fat absorption capacity of the proteins directly influence the characteristics of a food system. Chandi and Sogi[Citation12] have concluded that functional properties of rice bran protein concentrates were approximately equivalent to those of casein. Rice glutelin has been reported to show good gelling properties, which could be important for food applications.[Citation5] Similarly, proteins in brown rice, white rice, and rice bran have also been studied to have favorable functional properties in systems with high concentration of salts or sugars.[Citation6] The method of extraction has also been reported to have an impact on the functional properties of the rice endosperm proteins. Higher emulsifying and foaming properties of alkali and salt-extracted proteins could make them a potential ingredient in food systems with protein functionality.[Citation13] The solubility and the emulsification capacity of the rice endosperm proteins have also been reported to improve by controlled enzymic modification of the proteins.[Citation14] Therefore, these could have good potential for utilization in food industry. Although there have been many studies on the isolation and characterization of rice bran protein concentrates and isolates, the studies on rice endosperm protein isolates with reference to their functional properties, particularly in Indian rice cultivars are very limited. The objective of this study was to understand the varietal differences among rice cultivars based on the electrophoretic characterization of their protein compositions along with investigation of the functional properties of rice endosperm proteins extracted from some basmati and non-basmati cultivars grown in India. Knowing the functional properties of rice proteins, assessment of an alternative food protein source can be made. An attempt was also made to establish correlations among protein content and protein components, and cooking and textural properties of the rice grains.
MATERIALS AND METHODS
Two basmati rice cultivars, namely, HBC-19 and Bas-370 and four non-basmati rice cultivars, namely, Jaya, P-44, HKR-120, and Sharbati were procured from the Rice Research Centre of Chaudhary Charan Singh Haryana Agricultural University, Hisar, India. Paddy samples were dehusked and polished uniformly utilizing the locally available milling facilities (Indosaw, India). The milled rice grains from different rice cultivars were ground to flour using a laboratory flour mill (Navdeep flour mill). Defatting of the flour was done by steeping the flour samples in acetone overnight at room temperature. All the chemicals and reagents used were of analytical grade. Moisture, ash, and fat contents were determined using the standard methods of analysis.[Citation15] Starch content of rice flour was determined using a method of Clegg.[Citation16]
Extraction of Protein Fractions
Rice proteins were extracted using a sequential extraction method of Pan and Reeck.[Citation17] Defatted rice flour was sequentially extracted with 0.5M NaCl (to remove albumin and globulin), 70% ethanol (to remove prolamin), and 0.5% sodium dodecyl sulfate (SDS) with 0.6% β-mercaptoethanol (to remove glutelin). The sample was stirred with two volumes of solvent at room temperature for 20 min. The extract was separated from residue by centrifugation at 3500× g for 10 min. The process was repeated three times. The extracts were stored in a freezer at −20°C. To separate out albumin from globulin, ammonium sulfate was added to the extract to 35% of saturation, where some of the proteins precipitated. The supernatant and precipitate represented the albumin and globulin fractions, respectively. A direct extraction with 0.5% SDS and 0.6% β-mercaptoethanol was also performed to extract total rice proteins. Defatted milled rice flour was extracted with two volumes of this solvent three times, for 20 min each time, at room temperature. The residue was removed by centrifugation at 3500× g for 10 min.
Preparation of Protein Isolates from Milled Rice
For the preparation of protein isolate, the defatted flour was extracted with 0.05N NaOH. The flour suspension was stirred for 15 min at low speed. The extraction was repeated three times. Combined supernatant was precipitated by acidifying with 6N hydrochloric acid to pH 5, and centrifuged at 3000× g for 15 min. The pellet was washed twice with water and 70% ethanol and centrifuged again. The pellet was dried in a hot-air oven at 40°C.
Protein Estimation
The protein content of defatted rice flour samples was determined using a standard method of Kjeldahl[Citation15] using a nitrogen conversion factor of 5.95. The protein content of extracts from various cultivars was measured by the method as given by Lowry et al.[Citation18]
SDS-Polyacrylamide Gel Electrophoresis
The protein extracts were characterized for their composition using SDS-PAGE performed according to the method of Laemmli.[Citation19] The extracted protein fractions were also characterized by SDS-PAGE under reducing conditions (2-mercaptoethanol) using a mini vertical electrophoresis unit (Atto, Tokyo, Japan). Polyacrylamide gels composed of 2.5% stacking and 15% resolving gel were prepared. After electrophoresis, the gels were stained by Coomassie Blue R-250 and then destained with methanol and glacial acetic acid. The molecular weight of the protein bands was determined by electrophoresis of standard molecular weight marker protein.
Water and Oil Absorption Capacity
The water absorption capacity (WAC) of the rice protein isolates was determined by the method as described by Janicki and Walczak.[Citation20] A protein sample (1.0 g) was weighed into a calibrated graduated glass centrifuge tube. Distilled water (5.0 ml) was added gently down the side and mixed with a thin glass rod. Any particles adhering to the glass rod were carefully washed with 2.0 ml of distilled water into the same tube. The slurry was centrifuged at 3000 rpm for 25 min at 27°C. The supernatants were drained and water absorption capacity (ml/g) was determined by measuring the sedimented paste weight. Oil absorption capacity was determined using the method of Sosulski et al.[Citation21] Refined groundnut oil (10.0 ml) was added to dried protein powder (1.0 g) and mixed thoroughly. The mixture was kept aside for 30 min with gentle stirring using a glass rod every 5 min. The unabsorbed oil was determined by centrifugation of the slurry at 5000× g at 27°C for 30 min. The complete removal of oil was achieved by draining the tube by keeping it at a 45° angle for 1 h. The amount of oil retained was calculated by measuring the difference in the weight of the protein sample before and after equilibration with oil. The oil absorption capacity was expressed as the amount of oil absorbed (ml/g sample).
Foaming and Emulsifying Capacity
A suspension of protein sample (2.0 g/100 ml water) was blended at 12,000 rpm for 6 min at 27°C in an electric blender. The contents were immediately transferred quantitatively to a measuring cylinder (250 ml) and the volume of the foam was recorded. Foaming capacity was expressed according to Lawhon et al.[Citation22] as the percentage increase in volume. For the measurement of foaming capacity as a function of pH, the aqueous suspension of protein was adjusted to the desired pH with 0.1 M NaOH solution. The emulsifying capacity (EC) of the rice protein was determined by the method of Beuchat et al.[Citation23] using refined groundnut oil. The EC was expressed as amount of oil (ml) emulsified by 1.0 g of the sample. The EC was also determined as a function of pH after adjustment of the protein solution with 0.1N NaOH to the desired pH value before the addition of oil.
Statistical Analysis
The data were analyzed using one factor analysis of variance (ANOVA) in completely randomized design using Opstat exe.1 software (Sheoran O.P., CCS Haryana Agricultural University, Hisar, India). Pearson correlation coefficients (r) were calculated using SPSS 11.0 statistical software (Sheoran O.P.).
RESULTS AND DISCUSSION
The moisture, ash, fat, and starch content of the rice cultivars are given in . The cultivars showed no significant differences in their moisture, fat, and starch contents. Jaya cultivar differed significantly in its ash content from other cultivars (p < 0.05). The starch contents from different rice cultivars varied from 68.73 to70.24 g/100 g sample.
Table 1 Chemical properties of milled rice
Protein Content
Protein content of various fractions extracted from flours of various rice cultivars is given in . The basmati cultivars tended to have a higher protein content than non-basmati cultivars. The total protein contents of rice cultivars ranged from 5.46 to 7.02 g/100 g sample with Bas-370 showing the highest value. These results were comparable with the rice protein content range of 5.6–9.09 and 8.2 g/100 g sample as reported by Basak et al.[Citation24] and Hou et al.,[Citation25] respectively. Soluble fractions of rice protein showed that glutelin constituted the major portion and prolamin as the minor portion. The higher variability was observed in protein content of albumin and glutelin fractions of different rice cultivars. The amount of protein in the prolamin fraction was the lowest in all cultivars and it ranged from 3.3 to 4.8 g/100 g sample. The relative percentage of glutelin was highest in Sharbati and lowest in HBC-19. These observations are in agreement with those of previous researchers who found glutelin as a major storage protein, whereas alcohol soluble prolamin remained as a minor fraction.[Citation26,Citation27] The relative percentages of protein fractions observed for rice in the present study were in reasonable agreement with those reported by Basak et al.[Citation24]
Table 2 Protein contents of various fractions extracted from milled rice
Electrophoretic Characterization by SDS-PAGE
SDS-PAGE patterns of total rice protein polypeptides and individual fractions polypeptides are shown in –. The number of bands in total rice protein varied from 8 to 12, with the minimum in Jaya and maximum in HBC-19 (). The total protein level was the lowest in Jaya as also depicted in lane 1 in the electrophoregram for total protein. The molecular weights (MW) of polypeptides present ranged from 11.72 to 66.54 kDa. The major subunits present in the total protein were estimated at ∼14.99, 21.21, 30.19, and 35.70 kDa. Several other researchers have also reported the molecular weight of total protein in the range of 14.5 to 38 kDa.[Citation8,Citation17] The glutelin fraction contained the most heterogeneous polypeptide composition of the four fractions (10–17 different MW polypeptide subunits) (). Variation in the molecular weight of glutelin protein of rice cultivars was observed and molecular weights of protein fraction of different rice cultivars ranged from 11.90 to 67.75 kDa. The polypeptides with molecular weights ranging from 20 to 40 KDa were in abundance in glutelin fraction of all cultivars. Chandi and Sogi[Citation28] observed electrophoregram of glutelin fraction for Basmati 370 having single distinct subunit of 20 kDa while Pusa Basmati 1 having multiple bands of varying molecular weights. In the present study also, prominent bands were observed at 20 and 29 KDa in the case of Bas 370. Sharbati showed the highest level of glutelin in which the glutelin bands were more defined and intense as compared to other cultivars. HBC-19 had a significantly less glutelin content (p < 0.05). The major subunits of glutelin fraction were estimated at ∼15.54, 20.30, 33.84, and 55.99 kDa. The higher molecular weight subunit of 55.99 kDa indicates that smaller polypeptide units have linked by disulfide bonds resulting in 55.99 kDa species. These results were in reasonable agreement with the electrophoretic pattern of rice glutelin as studied by previous researchers who reported glutenin polypeptides in the range of 14–57 kDa.[Citation29,Citation30]
Figure 1 Electrophoretic patterns of total protein, glutelin, albumin, globulin, and prolamin fractions from different rice cultivars (M: molecular marker; Lane 1: Jaya; Lane 2: HKR-120; Lane 3: P-44; Lane 4: Sharbati; Lane 5: Bas-370; Lane 6: HBC-19).
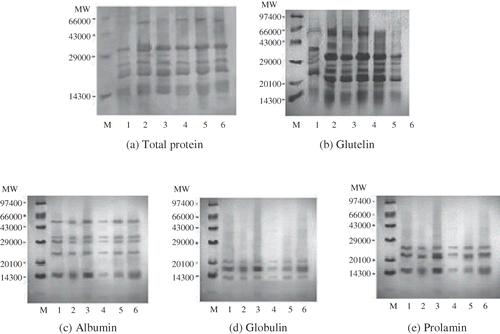
The electrophoretic pattern of albumins by SDS-PAGE exhibited many varietal differences on the basis of intensity and number of protein bands (). The number of bands varied from 5 to 8 with P-44 showing a maximum of 8 bands, Basmati cultivars (Bas-370 and HBC-19) had 7 bands. The molecular weight ranged from 13.96 to 56.31 kDa, which is consistent with the results of Steenson and Sathe,[Citation8] who reported a similar range of 14 to 52 kDa for albumin fraction of Basmati Dehraduni rice. However, they had reported the 19 different polypeptide subunits as compared to 5–8 subunits in the present study. The difference could be due to variety and electrophoresis set up. The electrophoretic patterns of globulin fraction from different cultivars are presented in . The globulin fraction revealed less heterogeneous polypeptide composition with 3 to 5 different molecular weight subunits in the range of 12.92 to 27.24 kDa. P-44 had the maximum number of bands (5) among all the varieties. Rice globulin has been reported to contain the major polypeptide with a molecular weight of 26 kDa.[Citation7] Steenson and Sathe[Citation8] noted three major polypeptides of globulin with molecular weights of 13.6, 19.0, and 21.5 kDa in rice cultivar Basmati Dehraduni. Prolamin was the most homogenous of the four fractions with each cultivar showing three different molecular weight subunits in the range of 12.78 to 20.07 kDa (). The electrophoregram results showed the least level of prolamin in Sharbati cultivar. Similar findings have been reported for the Basmati Dehraduni cultivar of rice by Steenson and Sathe.[Citation8] They have reported the prolamin with a major subunit at 13.2 kDa and minor subunits at 16.5 and 18.2 kDa. Rice prolamin has been reported to contain major polypeptide with a molecular weight of 13 kDa.[Citation7]
Functional Properties of Rice Protein Isolates
Water and oil absorption capacity
The basmati rice cultivars’ protein isolates showed higher water absorption capacity but lower oil absorption capacity than non-basmati rice cultivars except Sharbati cultivar (). HBC-19 cultivar showed the highest WAC and the value was very close to that of Sharbati cultivar with no significant difference (p < 0.05). Jaya cultivar showed the lowest value for WAC. The water absorption capacity of the protein reflects the degree of hydration. The WAC values were in close agreement with those reported by Hou et al.,[Citation24] who observed water holding capacity of rice protein hydrolysates ranging from 1.96 to 2.93 g/g. The water absorption capacity of rice protein isolates was lower than those of rice bran protein concentrates.[Citation12] Oil absorption capacity ranged from 0.80 to 1.51 ml/g and the order of oil absorption capacity in different cultivars was Jaya > HKR-120 > P-44 > Bas-370 > Sharbati > HBC-19. The values for oil absorption capacity are slightly varied from that reported for rice bran protein concentrate by Prakash and Ramanatham.[Citation31] This may be due to the difference in protein present in rice bran and milled rice. Bran contains high amounts of albumins, and more than 90% of the oryzenin is located in the endosperm of the milled rice.
Table 3 Functional properties of rice endosperm protein isolates
Emulsifying capacity
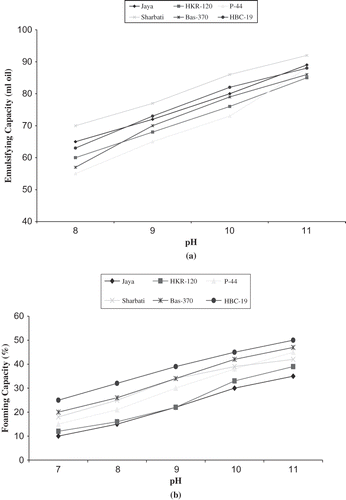
The emulsifying capacity (EC) of protein isolated from different rice cultivars measured at pH 11 is presented in . Emulsifying capacity was measured to test how much oil could be emulsified into an aqueous phase containing the test protein. The emulsifying capacities of protein isolates from rice cultivars were comparable to each other. Emulsifying capacity varied from 85 to 92 ml/g. Protein from HKR-120 showed the lowest emulsifying capacity, whereas from Sharbati showed the highest. The difference in the emulsifying properties of protein isolates observed in different cultivars may be attributed to the difference in composition, surface hydrophobicity, and solubility of proteins.[Citation4] The emulsifying capacity of the rice endosperm protein isolates was higher than that of rice bran protein concentrates as reported by Chandi and Sogi,[12] which indicates that rice endosperm protein isolates are more suitable for application in food systems like hypoallergenic sausages, soups, and salad dressings. shows the effect of pH on the emulsification capacity of protein isolated from different rice cultivars. An increase in emulsification capacity was observed with increasing pH. Zayas and Lin[Citation32] also reported similar results for corn germ proteins. To have emulsion properties, the proteins should be able to solubilize and unfold to form cohesive layers at the interface. This requires protein solubility and flexibility. Protein extracted from the cultivars did not show any emulsifying capacity at acidic or neutral pH, which could be attributed to the decrease in the solubility. Glutelin, the major component of rice protein is less soluble at neutral pH due to its hydrophobic bonding, disulfide linkages, high molecular weight, and heterogeneity.[Citation3]
Figure 2 Emulsifying (a) and foaming (b) capacities of isolated rice proteins as a function of pH.
Foaming capacity
The foaming capacity and foam stability values measured at pH 11 are given in . The foaming capacity of basmati cultivars protein isolates was significantly higher than non-basmati cultivars protein isolates (p < 0.05). Foaming capacity varied from 35 to 50% with Jaya having the lowest and HBC-19 having the highest. The range is lower than the foaming capacity reported for defatted oat protein concentrate (120%), wheat gluten (100%), and soy protein isolate (135%).[Citation33] The lower foaming capacity of rice protein isolates might be due to fewer secondary and tertiary structures in the rice protein isolates, and presence of large macromolecule complexes stabilized by disulfide bonding and extensive aggregation of glutelin subunits.[Citation34] The foaming capacities of rice protein from different cultivars at various pH values are presented in . There was an increase in foaming capacity of all the samples investigated with increasing pH. Prakash and Ramanatham[Citation31] also reported an increase in foaming capacity with increasing pH for rice bran protein concentrate. Protein for foaming should be stable in aqueous phase and it should concentrate at the interface. Alkali treatment usually improves the solubility of protein, particularly if the pH exceeds 10.5, causing dissociation of protein.[Citation35] The foam stability is measured by the rate at which foam volume decreases and is generally determined by loss of liquid resulting from destabilization (leakage). The foam stability of the protein samples was determined at 30 min intervals after foam formation. The value of foam stability varied from 40 to 50% with Sharbati and HBC-19 showing the highest value.
Correlations
The functional properties of protein isolates were correlated with total protein content and various protein fractions and the Pearson correlation coefficients are given in . A significant negative correlation was found between oil absorption capacity and total protein content (r = −0.914, p < 0.05). Water absorption capacity had a significant positive correlation with total protein (r = 0.829, p < 0.05). A significant positive correlation was also found between foaming capacity and total protein content (r = 0.917, p < 0.01).
Table 4 Pearson correlation coefficients of functional properties with total protein content and protein fractions
The Pearson correlation coefficients were also determined between total protein content, protein fractions and cooking and textural properties of rice grains (cooking and textural properties determined in another part of the study, data not given) as shown in . Cooking time had a highly significant positively correlation with total protein content (r = 0.956). The present results are in accordance with those reported earlier by Chakrabarthy et al.[Citation36] Since protein forms the matrix around the starch granules,[Citation37] its relation with cooking time may be explained in part by a physical barrier role. Solid loss in gruel was significantly negatively correlated with total protein content (r = −0.987, p < 0.01). The protein barrier limits the leaching of solids during cooking. The protein elongation ratio had a highly significant positive correlation with total protein (r = 0.983, p < 0.01). Total protein content had a highly significant positive correlation with cooked grain hardness (r = 0.966) and a negative correlation with adhesiveness (r = −0.935, p < 001). Roferos and Juliano[Citation38] have also reported a positive correlation between protein content and hardness of cooked rice. Total protein content was negatively correlated with cohesiveness (r = −0.900). Juliano et al.[Citation10] have also reported that rice samples with low protein content were more tender and cohesive than high protein samples. Hardness and gumminess were negatively correlated with prolamin content, which was in agreement with the findings of Baxter et al.[Citation39]
Table 5 Pearson correlation coefficients of cooking and textural properties of rice grains with total protein content and protein fractions
The electrophoretic patterns of protein fractions as revealed by SDS-PAGE exhibited many varietal differences on the basis of intensity and number of polypeptide bands with glutelin fraction revealing the most heterogeneous (10–17 different polypeptide subunits) and prolamin fraction revealing the most homogenous polypeptide composition (3 polypeptide units). The molecular weight ranged from 13.96 to 56.31 kDa for albumin, 12.92 to 27.24 kDa for globulin, 12.78 to 20.07 kDa for prolamin, 11.90 to 67.75 kDa for glutelin, and 11.72 to 66.54 kDa for total protein. Soluble fractions of rice protein showed that glutelin (69.2 to 78.8%) constituted the major fraction and prolamin (3.3 to 4.8%) as the minor fraction. The protein isolated from basmati cultivars showed significantly higher water absorption, foaming capacity but lower oil absorption capacity. Protein isolate from HKR-120 showed the lowest emulsifying capacity, whereas from Sharbati showed the highest. Since reasonably good emulsification and foaming properties are obtained from rice endosperm at higher pH, the need is to develop some modified methods for the extraction of proteins, which favorably improve the functional properties at pH suitable to most food products. Protein content had significant influence on the cooking and textural properties of cooked rice. Thus, protein content can be a secondary factor affecting the cooking and textural quality of rice, whereas amylose content of rice varieties is in the narrow range.
ACKNOWLEDGMENTS
The authors duly acknowledge the support and technical assistance rendered by Cotton Research Centre, Sirsa, India in using electrophoresis facility. The technical support rendered by Central Institute of Research on Buffaloes (CIRB), Hisar, India is also duly acknowledged.
REFERENCES
- Fiocchi , A. , Travaini , M. , D'Auria , E. , Banderali , G. , Bernardo , L. and Riva , E. 2003 . Tolerance to a rice hydrolysate formula in children allergic to cow's milk and soy . Clinical & Experimental Allergy , 33 : 1576 – 1580 .
- Juliano , B.O. 1994 . “ Polysaccharides, lipids and proteins of rice ” . In Rice: Chemistry and Technology , 2nd , Edited by: Juliano , B.O. 98 – 141 . St. Paul , MN : AACC .
- Juliano , B.O. 1985 . “ Polysaccharides, lipids and proteins of rice ” . In Rice: Chemistry and Technology , 2nd , Edited by: Juliano , B.O. 59 – 174 . St. Paul , MN : AACC .
- Paraman , I. , Hettiarachchy , N.S. and Schaefer , C. 2008 . Preparation of rice endosperm protein isolate by alkali extraction method . Cereal Chemistry , 85 ( 1 ) : 76 – 81 .
- Agboola , S. , Ng , D. and Mills , D. 2005 . Characterization and functional properties of Australian rice protein isolates . Journal of Cereal Science , 41 ( 3 ) : 283 – 290 .
- Cao , X. , Wen , H. , Li , C. and Gu , Z. 2009 . Differences in the functional properties and biochemical characteristics of congenetic rice proteins . Journal of Cereal Science , 50 ( 2 ) : 184 – 189 .
- Kumagai , T. , Kawamura , H. , Fuse , T. , Watanabe , T. , Saito , Y. , Masumura , T. , Watanabe , R. and Kadowaki , M. 2006 . Production of rice protein by alkaline extraction improves its digestibility . Journal of Nutritional Science and Vitamnology , 52 : 467 – 472 .
- Steenson , D.F. and Sathe , S.K. 1995 . Characterization and digestibility of basmati rice (Oryza sativa L. var. Dehraduni) storage proteins . Cereal Chemistry , 72 ( 3 ) : 275 – 280 .
- Resurreccion , A.P. , Juliano , B.O. and Tanaka , Y. 1979 . Nutrient content and distribution in milling fractions of the rice grain . Journal of Science of Food and Agriculture , 30 : 475 – 481 .
- Juliano , B.O. , Onate , L.U. and Del Mundo , A.M. 1965 . Relation of starch composition, protein content, and gelatinization temperature to cooking and eating qualities of milled rice . Food Technology , 19 : 1006 – 1011 .
- Teo , C.H. , Karim , A.B.D.A. , Cheah , P.B. , Norziah , M.H. and Seow , C.C. 2000 . On the roles of protein and starch in the aging of non-waxy rice flour . Food Chemistry , 69 : 229 – 236 .
- Chandi , G.K. and Sogi , D.S. 2007 . Functional properties of rice bran protein concentrates . Journal of Food Engineering , 79 : 592 – 597 .
- Paraman , I. , Hettiarachchy , N.S. , Schaefer , C. and Beck , M.I. 2006 . Physicochemical properties of rice endosperm proteins extracted by chemical and enzymatic methods . Cereal Chemistry , 83 : 663 – 667 .
- Paraman , I. , Hettiarachchy , N.S. , Schaefer , C. and Beck , M.I. 2007 . Hydrophobicity, solubility, and emulsifying properties of enzyme-modified rice endosperm protein . Cereal Chemistry , 84 ( 4 ) : 343 – 349 .
- AOAC . 1984 . Official Methods of Analysis of AOAC International , 14th , Arlington , VA : Association of Official Analytical Chemists .
- Clegg , K.M. 1956 . The application of the anthrone reagent to the estimation of starch in cereals . Journal of Science of Food and Agriculture , 7 : 40 – 45 .
- Pan , S.J. and Reeck , G.R. 1988 . Isolation and characterization of rice α-globulin . Cereal Chemistry , 65 ( 4 ) : 316 – 319 .
- Lowry , O.H. , Rosebrough , N.J. , Farr , A.L. and Randall , R.J. 1951 . Protein measurement with the Folin phenol reagent . Journal of Biological Chemistry , 193 : 265 – 275 .
- Laemmli , U.K. 1970 . Cleavage of structural proteins during the assembly of the head of bacteriophage T-4 . Nature , 227 : 680 – 685 .
- Janicki , N.A. and Walczak , J. 1954 . Wateriness in meat and methods for its determination . Advances Food Research , 10 : 355 – 394 .
- Sosulski , F.W. , Humbert , E.S. , Bui , K. and Jones , J.D. 1976 . Functional properties of rapeseed flours, concentrates and isolates . Journal of Food Science , 41 : 1349 – 1352 .
- Lawhon , J.T. , Cater , C.M. and Mattu , K.F. 1972 . A comparative study of the whipping potential of an extract from several oilseed flours . Cereal Science Today , 17 : 240 – 244 .
- Beuchat , L.R. , Cherry , J.P. and Quinn , M.R. 1975 . Physicochemical properties of peanut flour as affected by proteolysis . Journal of Agricultural and Food Chemistry , 23 : 616 – 618 .
- Basak , S. , Tyagi , R.S. and Srivastava , K.N. 2002 . Biochemical characterization of aromatic and non-aromatic rice cultivars . Journal of Food Science and Technology , 39 ( 1 ) : 55 – 58 .
- Hou , L. , Zhu , Y. and Li , Q. 2010 . Characterization and preparation of broken rice proteins modified by proteases . Food Technology and Biotechnology , 48 ( 1 ) : 50 – 55 .
- Iwasaki , T. , Shibuya , N. , Suzuki , T. and Chikubu , S. 1982 . Gel filtration and electrophoresis of soluble rice proteins extracted from long, medium, and short grain varieties . Cereal Chemistry , 59 ( 3 ) : 192 – 195 .
- Padhye , W.V. and Salunkhe , D.K. 1979 . Extraction and characterization of rice proteins . Cereal Chemistry , 56 ( 5 ) : 389 – 393 .
- Chandi , G.K. and Sogi , D.S. 2008 . Characterization of traditional (Basmati 370) and developed (Pusa Basmati 1) basmati rice . International Journal of Food Properties , 11 ( 4 ) : 910 – 918 .
- Jahan , M. , Uemura , Y. , Kumamaru , T. , Hamid , A. and Satoh , H. 2005 . Genetic variation of glutelin acidic subunit polypeptides in Bangladesh rice genetic resources . Genetic Resources and Crop Evolution , 52 : 977 – 987 .
- Martinez , A.L. , Ventura , E. , Maldonado , U. , Sanchez , M.M. , Bazaldua , C. and del Villar , A. 2005 . Characterization of storage proteins and anther culture for the development of high nutritional quality rice genotypes . Biotechnology and Applied Biochemistry , 22 : 41 – 44 .
- Prakash , J. and Ramanatham , G. 1995 . Effect of stabilization treatment of rice bran on functional properties of protein concentrates . Journal of Science of Food and Agriculture , 67 : 181 – 187 .
- Zayas , J.F. and Lin , C.S. 1989 . Emulsifying properties of corn germ proteins . Cereal Chemistry , 66 ( 4 ) : 263 – 267 .
- Ma , C.Y. 1983 . Chemical characterization and functionality assessment of protein concentrates from oats . Cereal Chemistry , 60 ( 1 ) : 36 – 42 .
- Sugimoto , T. , Tanaka , K. and Kasai , Z. 1986 . Improved extraction of rice prolamin . Agricultural and Biological Chemistry , 50 ( 11 ) : 2409 – 2411 .
- Kinsella , E.J. 1979 . Functional properties of soya proteins . Journal of the American Oil Chemists’ Society , 56 : 242 – 258 .
- Chakrabarthy , T.K. , Dwarakanath , K.R. and Prabhakar Bhat , B. 1972 . Studies on physico-chemical properties of some varieties of rice . Journal of Food Science and Technology , 9 : 140 – 143 .
- Derycke , V. , Veraverbeke , W.S. , Vandeputte , G.E. , De Man , W. , Hoseney , R.C. and Delcour , J.A. 2005 . Impact of proteins on pasting and cooking properties of non parboiled and parboiled rice . Cereal Chemistry , 82 ( 4 ) : 68 – 74 .
- Roferos , L.T. and Juliano , B.O. 1997 . Chemometrics of grain quality of raw and cooked Philippine milled rice . Philippine Agriculture , 80 : 211 – 236 .
- Baxter , G. , Blanchard , C. and Zhao , J. 2004 . Effects of prolamin on the textural and pasting properties of rice flour and starch . Journal of Cereal Science , 40 : 205 – 211 .