Abstract
Fourier transform infrared spectroscopy is considered as a rapid, non-destructive, reliable, sensitive, and cost-effective technique, which could be used for characterizing the chemical composition (identifying functional groups) of various microorganisms. In the present study, Fourier transform infrared spectroscopy was employed to differentiate (based on functional groups; spectral range between 3500–500 cm−1) between different genera of fungi (mainly Aspergillus sp. and Mucor sp.), capable of producing mycotoxins. From the results, it was clearly evident that irrespective of the overall similarities between the spectra of different fungi, there is a unique spectrum for each one with precise differences in the functional groups. These results can be useful and provide a suitable “finger print” for each of the fungal strains capable of producing mycotoxins. This method of differentiating between toxigenic fungi can also be effectively used in assisting quarantine rules. The results obtained in this study revealed Fourier transform infrared spectroscopy to show great potential for identification of molds capable of producing mycotoxins.
INTRODUCTION
Food and agricultural commodities regularly get contaminated by various types of toxigenic molds (fungi), which on consumption are competent of incurring various health-associated illnesses or risks, such as dizziness, diarrhea, vomiting, blurred vision, including neuro-degenerative disorders and cancer.[Citation1] Presence of toxigenic molds capable of producing mycotoxins (low-molecular-weight compounds produced as secondary metabolites) in a food commodity is considered to be a crucial and an extensively neglected problem.[Citation1,Citation2] Fungal species belonging to the genera of some of the common filamentous fungi, such as Aspergillus, Mucor, Penicillium, and Fusarium, are known to produce mycotoxins (such as aflatoxins, ochratoxins, and fumonisins).[Citation1,Citation3] Among these fungi, Aspergillus species are of high economic importance, and are capable of growing and thriving at low water activity (aw) and moisture levels. This group of fungi can tolerate high temperatures and relative humidity, especially those conditions that are encountered in the tropical regions of the world.
Today, most of the routinely employed techniques (physiological and molecular techniques) to identify a toxin producing mold/fungi are time consuming, expensive, and requires adequate expertise. Accurate and precise identification of a fungus can be a difficult task, with regular modifications and updates being commenced on the taxonomic schemes, making it a lengthy and complex process.[Citation4] Even though some of the common and routinely employed molecular techniques to identify a microorganism are highly accurate, there are certain limitations, such as cost of chemicals, selection of precise primers for each microbial species, protocol complexities, etc.[Citation5] In this regard, developing a more reliable, sensitive, and a rapid method for identification of toxigenic molds assumes prior importance.
Fourier transform infrared (FTIR) spectroscopy is considered to be a rapid, non-destructive, reliable, sensitive, and a cost-effective technique, which could be used for characterizing the chemical composition (or identifying functional groups) of various microorganisms. FTIR technique has been successfully applied for identification of various spoilage and pathogenic bacteria as well as yeasts.[Citation4] Above all, for FTIR analysis only a small quantity of biomass is sufficient to obtain the spectra.[Citation4] This technique has the competence to detect even minute changes in ‘bond length and angles’ in a macromolecule, and can be very useful to determine the structural changes occurring.[Citation6] The FTIR spectrum obtained for any compound gives the information on the unique ‘fingerprint’.[Citation4,Citation7] This is because bio-molecules, such as lipids, carbohydrates, and nucleic acids, have their own unique ‘vibrational’ fingerprints and characteristic functional groups, which correspond to specific infrared light frequencies.[Citation8] With an ample amount of information available on the FTIR spectral peaks of living cells and microorganisms in particular,[Citation6,Citation9] it will be easy to distinguish among various pathogenic molds belonging to the same genera.
Based on these facts, the major objective to undertaking the present study was to identify the potentiality of employing FTIR for identifying and differentiating (based on functional groups) between different genera of fungi (mainly Aspergillus species) capable of producing mycotoxins. It is envisaged that the results obtained in this study might be useful to set up a future reference database to employ FTIR spectrum for rapid detection, and differentiating between various toxigenic molds present in a food commodity.
MATERIALS AND METHODS
In the present study, four potential mycotoxins producing fungal species were used, which included Aspergillus niger, A. flavus, A. parasiticus, and Mucor spp. Previously, these fungi were isolated from various food commodities and maintained in our culture collection (Food Microbiology Lab, School of Industrial Technology, Universiti Sains Malaysia). The fungi were grown in triplicates on potato dextrose agar (PDA; with 1% tartaric acid) at room temperature (27 ± 1°C) for 7–8 days. All the fungi were re-identified by using standard taxonomic references.[Citation10–13 Citation Citation Citation13
Sample Preparation for FTIR Spectroscopy Studies
The sample preparation was done based on the method described by earlier researchers,[Citation6,Citation14,Citation15] with slight modifications. In brief, individual fungal cells (colonies) grown on PDA were collected and suspended in distilled water followed by centrifugation (Kubota 4000, Kubota, Tokyo, Japan) at 3000 rpm (for 3 min). After discarding the supernatant, the pellet obtained was again rinsed twice with double distilled water followed by storing in a freeze dryer (−20°C) until lyophilization (24 h).
Further, for analysis, a known amount of the dried sample (∼1 mg) was mixed with 100 mg dry KBr (Fisher Chemical, Malaysia), and suitable KBr pellets were prepared by applying hydraulic pressure (1200 psi) (GRASEBY SPECAC, London, UK). In order to avoid any chances of variations in the thickness, pellets for each fungal species were prepared as three independent replicates and the infrared spectra obtained were compared for uniformity.
FTIR Spectroscopy and Data Analysis
Fourier transform infrared (FTIR) spectrometry (System 2000, Perkin Elmer, Wellesly, MD, USA) was used for spectral analysis. Uniform sized pellets prepared from the samples were used for recording the infrared spectra. Pellets were scanned at 4.0 cm−1 resolution in a spectral range of 3500–500 cm−1. Spectral data analysis baseline correction, normalization, and band area were performed by using Perkin Elmer Applications Spectrum software. A total of ten scans were performed for each pellet, which were signal-averaged to obtain a single spectrum.
Individual IR Spectra and Band Assignment
In the present study, individual FTIR spectral peaks were identified with the help of various reports and database available[Citation6,Citation16–23 Citation Citation Citation Citation Citation Citation Citation23 ().
Table 1 Band assignment of main FTIR peak of toxigenic fungi evaluated in this study.[Citation6,Citation15–23 Citation Citation Citation Citation Citation Citation Citation Citation23
RESULTS AND DISCUSSIONS
Fungal Species
In the current study, fungi belonging to Aspergillus species capable of producing mycotoxins were analyzed. Additionally, Mucor sp. was also considered and analyzed for comparison purposes. Isolates of A. niger are reported to be capable of producing nephrotoxic, immuno-suppressive, carcinogenic, and a teratogenic mycotoxin, namely, the ochratoxin A (OTA) in food commodities, such as cereals, coffee, cocoa, dried fruits, spices, grapes, peanuts, onions, mango, and apples.[Citation2,Citation24] Also, A. niger is reported to produce the carcinogenic mycotoxin fumonisin B2.[Citation1,Citation25] The fungi, A. flavus, is responsible for producing highly toxic, mutagenic, teratogenic, and carcinogenic aflatoxins (mainly AFB1 and AFB2) in some of the common food commodities, such as in cereals (maize, sorghum, pearl millet, rice), spices (chillies, black pepper, coriander), oilseeds (groundnut, soybean, sunflower), tree nuts (almond, pistachio, walnut), crude drugs, and milk (human and animal). Additionally, A. flavus is reported to be capable of producing Cyclopiazonic acid, which naturally occurs in peanuts, corn, cheese, and soybeans.[Citation1] The fungi, A. parasiticus, are also potential producers of aflatoxins. They are reported to produce AFG1 and AFG2 as well as AFB1 and AFB2.[Citation1] Mucor species is also one of the most common spoilage molds capable of producing aflatoxins.[Citation26] Moreover, fungal conidia can also contain a certain amount of mycotoxins too.[Citation27,Citation28]
To date, only a few reports are available on the use of FTIR for identifying fungi. Previously, Fischer et al.[Citation23] developed a simple method for preparation of samples and identification of airborne fungi by FTIR spectroscopy, while Naumann et al.[Citation29] had used FTIR for identifying fungi in wood. Identification of some yeast species has also been reported based on FTIR spectroscopy.[Citation30]
FTIR Results
In this study, FTIR spectroscopy was used to study and compare the fungal isolates capable of producing mycotoxins. The spectral differences, corresponding to the individual functional groups of the species were studied in the wavelength range of 3500–500 cm−1. The individual band assignment (range) of main peak detected in the toxigenic molds evaluated in this study is depicted . Overall, the spectral comparison showed the main functional group to belong to lipids, carbohydrates, nucleic acids, polysaccharides, proteins, Amide I and Amide II, sugars, phospholipids, and glycogen.
It should be noted that even a single and clearly distinguishable new peak assigned to a particular functional group can be sufficient to differentiate between different fungal species. For example, in A. niger, the only differentiating peak was that of dipiconilic acid, while isocyanides were not detected (absent). Whereas, in the case of A. flavus, CH2 wagging bands progression was found, which was absent in all the other molds under study.
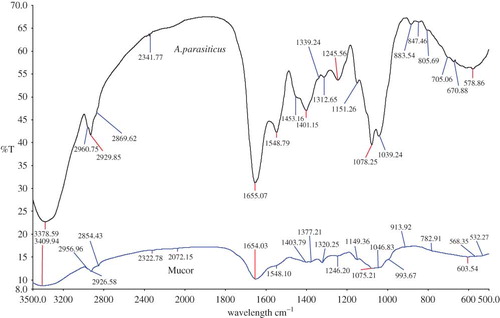
In this study, for a better understanding of the FTIR peaks (spectra), Mucor sp. has been used in all the instances to compare with the individual Aspergillus species. In , Mucor sp. has been compared with A. flavus. Between these two, in A. flavusa distinguishing band (peak/shoulder) at 851.26 and 885.44 cm−1 was observed, which is attributed to N-type sugar and coupled furonase-phosphodiester chains. Whereas, in Mucor sp., a prominent peak at a frequency of 2956.96 cm−1 was observed, which can be assigned to CH2 asymmetric stretch mainly composed of lipids, with a little contribution from proteins, carbohydrates, and nucleic acids. Similarly, as shown in , the FTIR spectra of Mucor sp. showed a distinguishable peak (band) at a frequency of 2072.15 cm−1 (isocyanides), which was not detectable in the spectra of A. parasiticus. The CH3 bending vibrations (lipids, proteins) at frequency 1377.21 cm−1 could differentiate Mucor sp. from A. parasiticus. Additionally, at frequency 993.67 cm−1, there were polysaccharides, glycosidic linkages, which were present only in Mucor sp. and not in A. parasiticus. Additionally, in A. parasiticus there was a clear and an unidentified peak detected at 670.88 cm−1. Further, clearly distinguishable peaks at 847.46 (may be N-type sugar or coupled furonase-phosphodiester chain), 883.54 (polysaccharides within the cell wall), and 1039.24 cm−1 (PO2- symmetric stretching: nucleic acids and phospholipids C–O stretch: glycogen) was observed only in A. parasiticus.
Figure 1 An overlay view of FTIR spectra of Aspergillus flavus compared with Mucor sp. (All spectra were baseline corrected, vector normalized, and offset corrected using Perkin Elmer Applications Spectrum software.) (Color figure available online.)
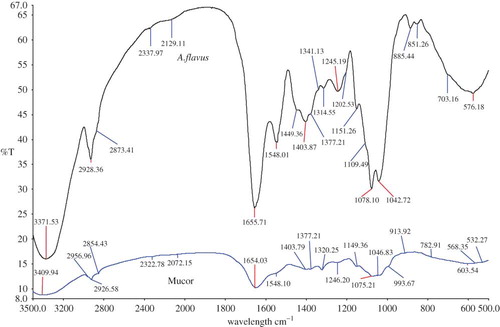
Figure 2 An overlay view of FTIR spectra of Aspergillus parasiticus and Mucor sp. (All spectra were baseline corrected, vector normalized, and offset corrected using Perkin Elmer Applications Spectrum software.) (Color figure available online.)
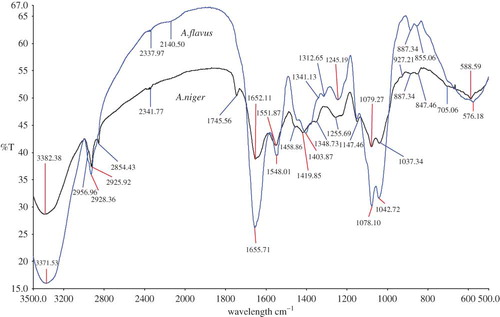
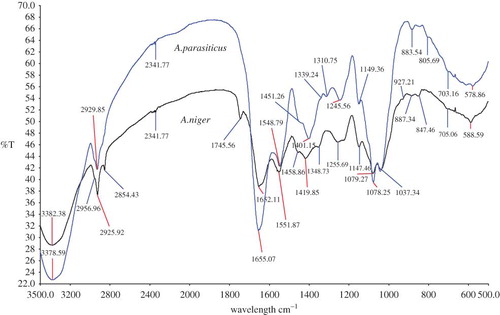
shows the overlay spectra of A. niger versus Mucor sp. Accordingly, the FTIR spectra were non-identical and could be easily distinguishable. Both the spectra had a different transmittance range. At frequency 1745.56, 1419.85, 853.16, and 670.88 cm−1, a clear spectral peak could be identified in A. niger compared to Mucor sp. This differentiation might be very useful, as morphologically both A. niger and Mucor sp. look identical. In , an overlay view spectra of A. flavus versus A. niger is shown. As shown, both the spectra are almost identical. However, a component of isocyanides at frequency 2140.50 cm−1 and CH2 wagging bands progression at 1312.65 cm−1 was found in A. flavus, which was absent in A. niger. Whereas, in A. niger, distinguishing peaks at a frequency of 1745.56 cm−1 (representing Ester C=O stretch: lipid, triglycerides, which is also present in A. parasiticus) and at 705.06 cm−1 (dipiconilic acid group) was present, which could differentiate from A. flavus. Also, in A. niger a distinguishable peak was present at a frequency of 927.21 cm−1 (assigned to polysaccharides or glycosidic linkages). However, all the other peaks were comparable and could be assigned to the same functional group (see ).
Figure 3 An overlay view of FTIR spectra of Aspergillus niger compared with Mucor sp. (All spectra were baseline corrected, vector normalized, and offset corrected using Perkin Elmer Applications Spectrum software.) (Color figure available online.)
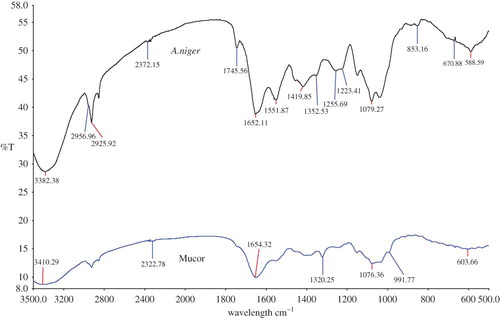
Figure 4 An overlay view of FTIR spectra of Aspergillus flavus compared with Aspergillus niger. (All spectra were baseline corrected, vector normalized, and offset corrected using Perkin Elmer Applications Spectrum software.) (Color figure available online.)
In , the FTIR spectra of A. parasiticus is compared with A. niger. According to the obtained spectra, in A. niger a distinguishable spectra was observed at a frequency of 1745.56 cm−1 (assigned to an ester C=O stretching or to a lipid- triglycerides), which was not present in A. parasiticus. Also, in A. niger, a clearly distinguishable spectra was present at a frequency of 2854.43 cm−1 (assigned to isocyanides), 1348.73 cm−1 (unknown), and 927.21 cm−1 (assigned to polysaccharides or the glycosidic linkages). Other peaks were almost the same and comparable and could be assigned to the same functional group.
Figure 5 An overlay view of FTIR spectra of Aspergillus parasiticus compared with Aspergillus niger. (All spectra were baseline corrected, vector normalized, and offset corrected using Perkin Elmer Applications Spectrum software.) (Color figure available online.)
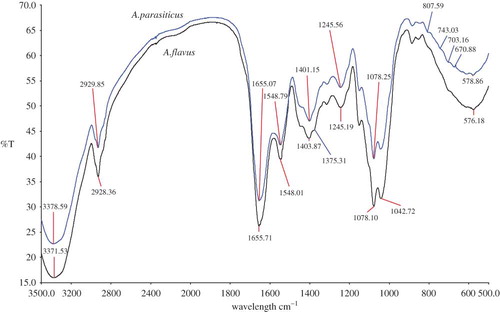
In , the spectra obtained for A. parasiticus and A. flavus has been compared. Even though these two fungi can be easily distinguishable based on the color or morphological characters, sometimes it will be difficult to separately identify when these are present together (fungal co-occurrence). Overall, a similar pattern of spectra (with slightly broadened peak) were observed for these two fungi. Aspergillus flavus showed an additional peak at a frequency of 1375.31 cm−1, which is a representative of CH3 bending vibrations: lipids, proteins. Also, there were several minor (smaller) peaks present at frequencies between 800 and 500 cm−1 in A. parasiticus spectra compared to A. flavus, which could clearly distinguish between the two (see for the assigned functional groups).
Figure 6 An overlay view of FTIR spectra of Aspergillus parasiticus compared with Aspergillus flavus. (All spectra were baseline corrected, vector normalized, and offset corrected using Perkin Elmer Applications Spectrum software.) (Color figure available online.)
In general, all these comparative FTIR spectra could be very useful when co-occurrence of various molds of Aspegillus species occur on a single substrate. Based on the above observations, it is clearly evident that irrespective of the overall similarities between the spectra of different genera of Aspergillus, a unique spectrum does exist for each of the fungi with a certain level of differences compared to the other genus. These results can provide a suitable ‘finger print’ for each of the fungal strains capable of producing mycotoxins. However, the most important criteria for analyzing the functional groups by FTIR will depend entirely on the growth conditions (temperature, time, plating methods employed) and on the methods adopted for drying the microbial suspension.[Citation19] Further studies are warranted to investigate the individual peaks or the functional groups that might be formed on production of mycotoxins by these fungi, which might give a better insight to use FTIR.
CONCLUSIONS
On the basis of the results obtained in this study, Fourier transform infrared spectroscopy can be successfully employed for developing a rapid method of detection for different fungal species, capable of producing mycotoxins. FTIR spectroscopy, being easy to handle, can serve as a valuable technique in identifying not only toxigenic molds belonging to Aspergillus species, but can also be applicable to other mycotoxin producing molds, such as Fusarium, Penicillium, and others, which warrants further investigations in the near future. This method can also be effectively used in assisting quarantine rules and can be useful along the food processing chain as an important tool of food safety.
REFERENCES
- Bhat , R. , Ravishankar Rai , V. and Karim , A.A. 2010 . Mycotoxins—Present status and future concerns . Comprehensive Reviews in Food Science and Safety , 9 : 57 – 81 .
- CAST (Council for Agricultural Science and Technology) . 1989 . Mycotoxins: Economic and health risks. Task force report 116 , Ames , , Iowa : Council for Agricultural Science and Technology .
- Gürses , M. 2006 . Mycoflora and aflatoxin content of hazelnuts, walnuts, peanuts, almonds and roasted chickpeas (LEBLEBI) sold in Turkey . International Journal of Food Properties , 9 : 395 – 399 .
- Santos , C. , Fraga , M.E. , Kozakiewicz , Z. and Lima , N. 2010 . Fourier transform infrared as a powerful technique for the identification and characterization of filamentous fungi and yeasts . Research in Microbiology , 161 : 168 – 175 .
- Essendoubi , M. , Toubas , D. , Bouzaggou , M. , Pinon , J.M. , Manfait , M. and Sockalingum , G.D. 2005 . Rapid identification of Candida species by FTIR microspectroscopy . Biochimica et Biophysica Acta , 1724 : 239 – 247 .
- Garip , S. , Gozen , A.C. and Severcan , F. 2009 . Use of Fourier transform infrared spectroscopy for rapid comparative analysis of Bacillus and Micrococcus isolates . Food Chemistry , 113 : 1301 – 1307 .
- Goodacre , R. , Timmins , E.M. , Rooney , P.J. , Rowland , J.J. and Kell , D.B. 1996 . Rapid identification of Streptococcus and Enterococcus species using diffuse reflectance-absorbance Fourier transform infrared spectroscopy and artificial neural networks . FEMS Microbiology Letters , 140 : 233 – 239 .
- Griffiths , P.R. and de Haseth , J.A. 1986 . Fourier Transform Infrared Spectrometry , 45 New York : John Wiley and Sons .
- Diem , M. , Boydstom-White , S. and Chiriboga , L. 1999 . Infrared spectroscopy of cells and tissues: Shining light onto a novel subject . Applied Spectroscopy , 53 : 148 – 161 .
- Raper , K.B. and Fennell , D.T. 1977 . The Genus Aspergillus , Baltimore , MD : Williams and Wilkins Company .
- Pitt , J.I. and Hocking , A.D. 1985 . Fungi and Food Spoilage , Sydney : Academic Press .
- Svendsen , A. and Frisvad , J.C. 1994 . A chemotaxonomic study of the terverticillate Penicillia based on high performance liquid chromatography of secondary metabolites . Mycology Research , 98 : 1317 – 1328 .
- Watanabe , T. 1994 . Pictorial Atlas of Soil and Seed Fungi, Morphologies of Cultured Fungi and Key to Species , Boca Baton, FL, USA : CRC Press, Lewis Publishers Inc .
- Erukhimovitch , V. , Tsror , L. , Hazanovsky , M. , Talyshinsky , M. , Mukmanov , I. , Souprun , Y. and Huleihel , M. 2005 . Identification of fungal phyto-pathogens by Fourier-transform infrared (FTIR) microscopy . Journal of Agricultural Technology , 1 : 145 – 152 .
- Erukhimovitch , V. , Pavlov , V. , Talyshinsky , M. , Souprun , Y. and Huleihel , M. 2005 . FTIR microscopy as a method for identification of bacterial and fungal infections . Journal of Pharmaceutical and Biomedical Analysis , 37 : 1105 – 1108 .
- Rigas , B. , Morgello , S. , Goldman , I.S. and Wong , P.T.T. 1990 . Human colorectal cancers display abnormal Fourier-transform infrared spectra . Proceedings of the National Academy of Sciences USA , 87 : 8140
- Helm , D. , Labischinski , H. and Naumann , D. 1991 . Elaboration of a procedure for identification of bacteria using Fourier-transform IR spectral libraries: A stepwise correlation approach . Journal of Microbiological Methods , 14 : 127 – 142 .
- Naumann , D. , Labischinski , H. and Giesbrecht , P. 1991 . The characterization of microorganisms by Fourier transform infrared spectroscopy (FTIR) . Modern Techniques for Rapid Microbiological Analysis; Nelson, W.H.; Ed.; VCH: New York , : 43 – 96 .
- Kümmerle , M. , Scherer , S. and Seiler , H. 1998 . Rapid and reliable identification of food-borne yeasts by Fourier-transform infrared spectroscopy . Applied and Environmental Microbiology , 64 : 2207 – 2214 .
- Kos , G. , Lohninger , H. and Krska , R. 2002 . Fourier transform mid-infrared spectroscopy with attenuated total reflection (FTIR/ATR) as a tool for the detection of Fusarium fungi on maize . Vibrational Spectroscopy , 29 : 115 – 119 .
- Wenning , M. , Seiler , H. and Scherer , S. 2002 . Fourier-transform infrared microspectroscopy: A novel and rapid tool for identification of yeasts . Applied and Environmental Microbiology , 68 : 4717 – 4721 .
- Banyay , M. , Sarkar , M. and Gräslund , A.A. 2003 . Library of IR bands of nucleic acids in solution . Biophysical Chemistry , 104 : 477 – 488 .
- Fischer , G. , Braun , S. , Thissen , R. and Dott , W. 2006 . FTIR spectroscopy as a tool for rapid identification and intra-species characterization of airborne filamentous fungi . Journal of Microbiological Methods , 64 : 63 – 77 .
- Nielsen , K.F. , Mogensen , J.M. , Johansen , M. , Larsen , T.O. and Frisvad , J.C. 2009 . Review of secondary metabolites and mycotoxins from the Aspergillus niger group . Analytical and Bioanalytical Chemistry , 395 : 1225 – 1242 .
- Frisvad , J.C. , Smedsgaard , J. , Samson , R.A. , Larsen , T.O. and Thrane , U. 2007 . Fumonisin B2 production by Aspergillus niger . Journal of Agricultural and Food Chemistry , 55 : 9727 – 9732 .
- Makun , H.A. , Anjorin , S.T. , Moronfoye , B. , Adejo , F.O. , Afolabi , O.A. , Fagbayibo , G. , Balogun , B.O. and Surajudeen , A.A. 2010 . Fungal and aflatoxin contamination of some human food commodities in Nigeria . African Journal of Food Science , 4 : 127 – 135 .
- Fischer , G. , Müller , T. , Ostrowski , R. and Dott , W. 1999 . Mycotoxins of Aspergillus fumigatus in pure culture and in native bioaerosols from compost facilities . Chemosphere , 38 : 1745 – 1755 .
- Fischer , G. , Müller , T. , Schwalbe , R. , Ostrowski , R. and Dott , W. 2000 . Species-specific profiles of mycotoxins produced in cultures and associated with conidia of airborne fungi derived from bio-waste . International Journal of Hygiene and Environmental Health , 203 : 105 – 116 .
- Naumann , A. , Navarro-González , M. , Peddireddi , S. , Kües , U. and Polle , A. 2005 . Fourier transform infrared microscopy and imaging: detection of fungi in wood . Fungal Genetics and Biology , 42 : 829 – 835 .
- Sandt , C. , Sockalingum , G.D. , Aubert , D. , Lepan , H. , Lepouse , C , Jaussaud , M. , Leon , A. , Pinon , J.M. , Manfait , M. and Toubas , D. 2003 . Use of Fourier-transform infrared spectroscopy for typing of Candida albicans strains isolated in intensive care units . Journal of Clinical Microbiology , 41 : 954 – 959 .