
Abstract
The increasing consumption worldwide of tortilla chips make it relevant to design and optimize their industrial quality analysis. Surface, structural, and total oil content during frying of tortilla chips fried at 160, 175, and 190°C for different times were analyzed. The aim was to obtain a relationship between oil content and features from their digital images. The results showed a high linear correlation (R > 0.90) between oil content with image features at each frying temperature, indicating that trustable models can be developed, allowing the prediction of oil content of tortilla chips by using selected features extracted from their digital images, without the necessity of measuring them. Cross-validation technique demonstrated the repeatability of each model and their good performance (>90%).
INTRODUCTION
A nixtamalized soft moist dough called ‘masa’ is the raw material used to make the most popular masa-based-snack products (corn and tortilla chips),Citation[1] which are highly consumed in several Latin-American countries. The increasing consumption worldwide of tortillas make relevant to design and optimize their industrial quality analysis. Tortilla chips are baked and then fried, making them absorb less oil, have a firmer texture, and a stronger alkaline flavor than corn chips (fried without pre-treatment of baking).Citation[2 − Citation4]
Deep-fat frying is one of the oldest processes of food preparation and consists basically in the immersion of food pieces in hot oil. The high oil temperature causes evaporation of the water while oil is absorbed by the food piece, replacing some of the lost water.Citation[5] Bouchon et al.Citation[6] defined three different oil fractions, which can be identified as a consequence of the different absorption mechanisms in fried potato microstructure, such as (i) structural oil (STO), which represents the oil absorbed during frying; (ii) penetrated surface oil (PSO), which represents the oil suctioned into the food during cooling after removal from the fryer; and (iii) surface oil (SUO), which is the oil that remains on the surface and does not penetrate into microstructure, remaining on the potato slice surface. On the other hand, Moreira et al.Citation[3] defined the core oil as the oil that penetrates the chip microstructure either during frying and cooling for tortilla chips. This oil fraction was called structural oil (SO) by Durán et al.Citation[7] for potato slices during frying experiments. A wide spectrum of factors has been reported to affect oil absorption in fried foods, such as oil quality and composition, temperature and time of frying, initial moisture content of sample, shape, and pre-frying treatment.Citation[3, Citation5, Citation7]
Computer vision system (CV) is a non-destructive technology for acquiring and analyzing an image to obtain information of the product, to control industrial processes, and to improve the automatic evaluation of food quality.Citation[8 − Citation10] A basic CV consists of a digital camera connected to a computer for image acquisition, a standard setting illuminant (usually a light box), and a computer software for image processing and analysis.Citation[8, Citation10] CV has been used in the food industry for quality and color evaluation; detection of defects; grading and sorting of fruits and vegetables, meat and fish, bakery products and potato chips; and to determine other physical features, such as textural and geometrical among others.Citation[10 − Citation15] However, the determination of oil content in food products using computer vision was previously described in few articles. For example, (i) optimal harvest time of olives was obtained based on quality features derived from known image processing algorithms,Citation[16] (ii) the inspection and quality grade of oil palm from fresh oil bunches was obtained using an automatic production system,Citation[17] (iii) to monitoring and quantifying of oil migration in cocoa butterCitation[18] and chocolate coated products.Citation[19] Also, free and bound non-polar lipids of six Polish winter wheat varieties were analyzed and correlated with kernels’ surface and cross-sections’ color measured by digital image analysis.Citation[20] However, it was not studied in fried products as in this study. Therefore, using CV capabilities, it is possible to extract and process a lot of image features with the goal of finding which of them are relevant for accomplishing the classification taskCitation[11, Citation21] or for predicting physical properties, such as texture parameters from foods.Citation[22] The texture of an image (IT) is characterized by the spatial distribution of gray levels in a neighborhood, that is, the local variation of brightness form 1 pixel to the next (or within a small region).Citation[11, Citation23] Other food visual properties can be obtained by extracting geometrical and intensity features from the digital color image.Citation[11, Citation21,Citation24]
The objective of this research was to characterize oil content fractions in tortilla chips during frying under different conditions (time and frying temperature) and obtain good correlations between the oil content in tortilla chips and digital features obtained from their corresponding digital images, in order to build trustable models that allow predicting oil content of the tortilla chips by using the image features extracted from their digital images (without the necessity of experimental measuring them in a Soxhlet analyzer).
MATERIALS AND METHODS
All experimental work was accomplished in the Laboratories of Physical Properties and Computer Vision located in Universidad de Santiago de Chile.
Tortilla Chip Preparation
Tortilla chips were self-made prepared from masa of maize (F.H.M. Alimentos Ltd., Santiago, Chile). The thickness of the chips was adjusted in 2.0 ± 0.2 mm using a Tortilla Machine (González, S.A., Guadalupe, México). A circular cutting mold was used to provide tortilla chips with a diameter of 3.7 ± 0.2 cm. The tortilla chips were cooked on an electric iron skillet (Black and Decker Inc., New Britain) heated at 215°C for 30 s, flipped, cooked for 30 s, flipped again, and cooked for 30 s. In preliminary frying experiments, the corresponding maxima frying times and the time intervals for each frying temperature were determined until a final moisture content of about 1.8% (dry basis) was reached in the tortillas. Ten (10) chips were fried at different time intervals at frying temperatures of 160°C (0, 36, 72, 108, 144, 180, and 220 s), 175°C (0, 10, 20, 50, 80, 110, and 140 s), and 190°C (0, 5, 15, 30, 45, 60, and 80 s). Frying temperature was kept constant (±1°C) by using a thermocouple (model GG-30-KK, Tersid, Milano, Italy) inserted in the oil bath, which was connected to a digital data logger (model 2700, Keithley, Cleveland, OH, USA). Oil was pre-heated for 1 h prior to frying, and discarded after 6 h of use.Citation[25] Finally, the fried chips were cooled down to room temperature in desiccators during 2 min and analyzed. A previous study done for batches of ten (10) chips, which were first characterized by digital imaging and then surface oil content was measured, showed that their oil content fractions did not differ significantly (data not shown). Experiments were run in triplicate (total n = 30). Moisture content (mc) of tortilla chips was determined by moisture analyzer oven drying (MS-70, A&D Company Ltd., Tokyo, Japan). Duplicates of weighed samples (about 5 g) were dried at 160°C until constant weight, and the average results were reported in % dry basis (%db). The initial moisture content was 54 ± 2%db.
Computer Vision System
Computer vision system (CV) consists of a black box with four natural daylight tubes of 18W (Phillips, Holland) and a Canon Powershot G3 camera (Canon USA, Inc., Melville, NY, USA) of 4 Megapixels placed in vertical position at 22.5 cm of samples; the angle of camera lens and light was 45°, according to Pedreschi et al.Citation[10] The white balance of the camera was set using a standardized gray color chart from Kodak (Boston, MA, USA). In order to calibrate the digital color system, the color values (L*a*b* scale) of 35 color charts were measured using a colorimeter and CV using Balu Toolbox, which was calibrated to obtain the same L*a*b* color values, according to León et al.Citation[26] and Mery et al.Citation[24] Color charts were photographed and analyzed periodically to ensure that the lighting system and the color digital camera were working properly.
Each sample at each frying time was placed in front of the camera and two images (front and back) from each sample were obtained (total n = 60). All images (maximum resolution, 2272 × 1704 pixels) were acquired at the same conditions using remote control of ZoomBrowser program v6.0 (Canon, Intel, Santa Clara, CA, USA). The acquired images were saved as TIFF-24 bit files and retrieved later for subsequent analysis. Analysis images were performed using software MATLAB, (MatWorks Inc., Natick, MA, USA) Balu ToolboxCitation1.Citation[11]
Feature Extraction Using Image Analysis
The Balu Toolbox[11] is a software into Matlab softwareCitation[27] for image analysis and pattern recognition, which extracts a very large number digital chromatic and geometric features from digital images (previously segmented to separate it from background), and then permit to correlate the best feature of the total features analyzed (672 features) with an oil content experimental parameter. (adapted from Mery et al.Citation[24]) shows the principal geometric features that provide information on the size and shape of a segmented region, following three groups of features (totally, 54 geometrical features) and the intensity features that provide information about the color intensity of a chip region extracted for each color channel, following four groups of features (618 intensity features in total).
Table 1 Extracted features by Balu Toolbox from MATLAB software (adapted by Mery et al.Citation[24]); coefficients without units
Oil Content Measurements
The surface oil content (SUOC) is defined as the oil fraction that does not penetrate the chip microstructure neither during frying nor during cooling, remaining in the slice surface. For each selected sample frying time, the fried chips were cooled down to room temperature in desiccators during 2 min and then SUOC was measured using petroleum ether extraction by dipping each ten chips for 10 s in a beaker according to Duran et al.,Citation[7] and the oil dropped in the beaker was collected by evaporating the petroleum ether. The structural oil content (SOC) is defined as the oil that penetrates the chip microstructure, either during frying (STO) or cooling (PSO), according to oil fractions definition by Duran et al.Citation[7] and it was quantified according to Soxhlet extraction with petroleum ether.Citation[28] Samples used for this analysis were previously surface oil removed. The total oil content (TOC) was calculated as the sum of SUOC plus SOC at any time either during the frying or during the cooling process. In order to verify the accuracy of the methodologies employed for the quantification of the different kinds of oils, TOC was determined experimentally as well according to the Soxhlet method. The total oil content and the different oil fractions were expressed as grams of oil per gram of dry solids (dry solids free of oil).
Kinetics of Oil Uptake
An empirical first-order model (EquationEq. 1) was used to describe oil uptake during frying:Citation[7]
Statistical Analysis
Differences between means of data of each treatment were compared by t-test using GraphPad Prism v.4.0 program (GraphPad Systems Inc., San Diego, CA, USA). Statistical significance was expressed at the p < 0.05 level. A statistical analysis was carried out to determine the confidence interval for the obtained performance. The cross-validation technique, widely used in machine learning problems,Citation[29] classification of potatoes chips using pattern recognition,Citation[10, Citation21] and quality classification of corn tortillasCitation[24] was used also in this work. This validation technique of k-partition = N/F permits the evaluation of prediction model in order to obtain a robust model and accurate error. In cross-validation, some of the collected samples are removed and become the training set. The data is divided into F folds randomly. Each group contains N/k samples, where N is the total number of data samples. Then, F - 1 folds are used as training data and the remaining fold is used as testing data to evaluate the performance of the estimation. When training is performed, the samples that were initially removed can be used to test the performance of the mathematical model on these testing data. Thus, one can evaluate how well the model works with samples that have not been already examined. This process is performed (F - 1) more times, rotating training and test data during each cycle. The F individual performances from the folds are averaged to estimate the final performance. In our case, the data consists of 3 temperatures and 30 samples (N) per temperature for each mechanical property studied during frying time and 60 digital images. For these experiments, we choose F = 10 folds and we removed the sample k (n = 6) and we trained the model using the remaining 54 (N - k) samples. In each test, the testing data corresponds to a different group, and the error obtained in each experiment is called ek , for k = 1, … , 10. The F individual performances from the folds were used to estimate the final performance of the model. The percent of success of the mathematical model obtained of each sample condition was determined comparing statistically instrumental and mathematical data obtained for test data, taken into not significant differences between data (p > 0.05) using Dunnett's test and t-test with 10 degrees of freedom and 95% of confidence.
RESULTS AND DISCUSSION
The methodology used in this research allowed determining of the structural (SOC) and surface (SUOC) oil content fractions, as well as the total (TOC) oil content in tortilla chips, as previously done for potato chips.Citation[7] This result was corroborated since a not significant difference (p > 0.05) was obtained between TOC values obtained both experimentally as by the sum of SOC plus SUOC at the three evaluated temperatures.Citation[7]
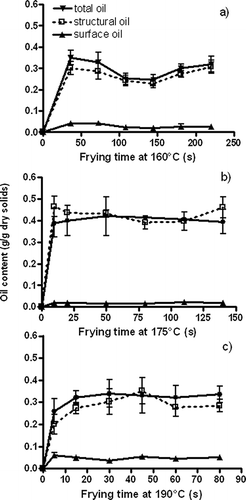
Total (TOC), structural (SOC), and surface (SUOC) oil content of tortilla chips at different frying temperatures are shown in Total oil content of the chips increased considerably during the initial period (∼10 s) of frying, and then it remained almost constant at the three frying temperatures ( and ). Similar behavior in the kinetics of oil absorption was found both in potato chipsCitation[7] as in tortilla chips fried at 190°C during the first 10–15 s.Citation[3] This result could be explained by the increasing product temperature with time accompanied by starch gelatinization, during which pores are created and water is expelled from the product, further creating capillary pores that are filled with oil.Citation[3] During this period, oil adheres to the chip surface and gets into the inner part of the product through its damaged zones. Once most of the water is evaporated, product temperature increases and the oil absorption rate diminishes.
Figure 2 Total oil uptake for tortilla chips during frying. Experimental data (mean) and their fitting by model EquationEq. (1). Error bars indicate standard deviation.
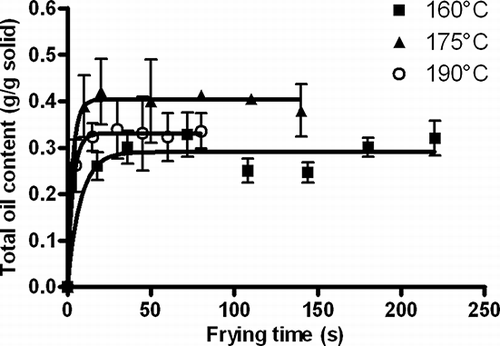
Figure 1 Oil content fractions (surface, structural, and total) of tortilla chips during frying at different temperatures: (a) 160°C, (b) 175°C, and (c) 190°C.
The final moisture content obtained after frying was ∼1.8%db in all cases; however, it was obtained at different frying times depending on the frying temperature ( and ). Therefore, at the same frying time, the final moisture content will vary resulting in a different interpretation of the results. Therefore, the final oil content (SOC) obtained at 1.8%db of moisture content was 32 ± 4 (g oil/100 g oil dry basis, %db) for structural oil content at frying temperatures of 160 and 190°C. However, for tortillas fried at 175°C, oil content was approximately higher (40 ± 4%db) than for other temperatures (32 ± 4%db). Nevertheless, the final oil content in tortilla chips, both SOC and TOC (), was not significantly different (p > 0.05) at different frying temperatures probably related to the remaining moisture content in the chips rather than to the oil temperature, as has been reported previously by Gamble et al.Citation[30] and Moreira et al.Citation[3]
On the other hand, while frying temperatures increased, the oil content that penetrates into their microstructure (structural oil) diminished from 96 to 85%, and the surface oil content increases from 4 to 15%, as shown in . Moreover, in order to eliminate the effect of the different final frying time, it is more reasonable to consider the water removed during frying to compare different frying temperatures.Citation[3, Citation31] shows the relationship between oil uptake ratios (oil uptake/water removed) at different frying temperatures. The oil uptake ratio was not significantly (p > 0.05) affected by frying temperature, confirming the results obtained above in using ANOVA.
Table 2 Kinetic parameters (Oe q , K) of total oil content (TOC) of tortilla chips at different frying temperatures were obtained by EquationEq. (1). Oil uptake ratio was obtained using EquationEq. (2). The R 2 coefficient indicates a good fit of data to model
Experimental data corresponding to total oil absorption (TOC) as a function of frying time and the corresponding curves fitted using EquationEq. (1) are shown in High correlation coefficients (R 2 ≥ 0.95) were obtained between experimental data and the model of oil uptake by EquationEq. (1). shows that not significant differences (p > 0.05) in total oil content by frying temperatures were obtained. Parameters of this model (EquationEq. 1) calculated for each experimental condition are shown in , showing that the specific rate (K) increased with frying temperature, as it was observed before in potato chips.[7,32] However, the equilibrium oil content (Oeq ), which is the final TOC, was independent of frying temperatures, according to oil uptake ratio results observed in and Despite that, several authors have reported that higher frying temperatures lead to lower absorbed oil of food products.Citation[6, Citation31] Moreira et al.,Citation[3] however, found that there were not significant differences (p > 0.05) in tortilla chips fried at 160 and 190°C, in agreement with the results obtained in this study. As observed in TOC data at the three evaluated temperatures, this Oeq in tortilla chips could be better related to the remaining moisture content in the chips (1.8%db, independently of frying temperature) than to the oil frying temperature, as previously reported in potato and tortilla chips.Citation[3, Citation30]
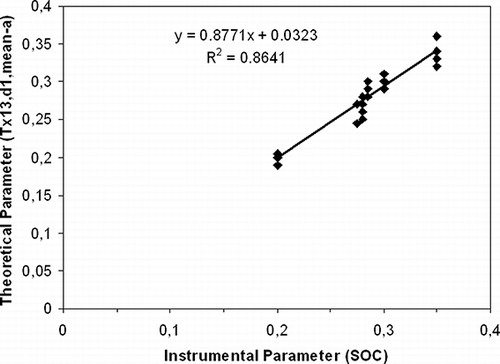
The aim of this study was to obtain digital features from images of tortilla chips in order to obtain a linear correlation with oil content fractions. Therefore, the mean (n = 60) of each digital feature obtained (672) at each frying time and each frying temperature was correlated with the mean of data (n = 30) of each oil content fraction measured using Soxhlet method. Thus, the software searched the best digital feature obtained by CV that lineally correlates (R 2 > 0.95), with each oil content studied at each temperature, as observed in . This best digital feature was different depending on the frying temperature and the oil fraction studied, indicating that differences in tortilla chips can be observed through image analysis. The image analysis was nevertheless performed on the surface of each tortilla, where it could have been expected to obtain only digital features that correlated with surface oil content. The different digital features obtained for total, surface, and structural oil content was mainly attributed to differences in the oil fraction during time. Using the obtained linear equations from the best digital features in each case (), the predictions of oil contents (SUOC, SOC, and TOC) were obtained to each replicate (n = 4). shows an example of oil content (SOC) prediction at 190°C using their corresponding obtained digital feature. In general, when experimental data is fitted using a mathematical model, the correlation coefficient (r-square) must be greater than 0.9; however, for data prediction, r-squares greater than 0.8 are expected for a model to be validated.[11,22,24] According to this, a high variation coefficient (R 2 ≥ 0.86) was obtained between instrumental data obtained experimentally by Soxhlet method and by using the mathematical linear model obtained from the extracted feature () through their image analysis (n = 60) (theoretical feature), indicating low variability between both parameters due replicates (n = 20). This high coefficient correlation (R 2 ≥ 0.86) was obtained for all oil fractions studied in each of the tested conditions.
Table 3 Digital features (y) obtained by computer vision that best correlated with oil content and their respective linear equation. R 2: correlation coefficient indicating a good fit to experimental data for linear regression. Cross validation: percent of success
Figure 3 Prediction of structural oil content (SOC) of tortilla chips fried at 190°C using the digital or theorical feature obtained by computer vision that best correlated with experimental data. Linear equation and correlation coefficient (R 2) was inserted.
A cross-validation technique was used in order to validate each mathematical model obtained for predicting each oil content fraction at each frying condition. The percent of success of the linear model to predict oil content using a corresponding digital feature was higher than 90% (), being mostly 100%. Besides, Bartlett's test for equal variances showed no significant differences (p < 0.05) between variances of prediction model and experimental data of each studied conditions and between the test classification performance. This result demonstrates the repeatability of the classification and the effectiveness of each linear model to predict oil content from tortilla chips during frying using digital features. According to the t-student test with 10 degrees of freedom and 95% of confidence, we obtained that the performance of the prediction models was 97 ± 4%, whereas the confidence interval was between 93 and 100%, with 95% of probability. The coefficient of variation (defined as 100 × standard deviation/mean value) was lower than 5%, showing the repeatability and effectiveness of the linear model to predict mechanical properties using digital features, as well as the good fitting of the prediction. Therefore, the results obtained by image analysis for the total oil content (TOC) and the other oil content fractions (SUOC and SOC) compared favorably to those obtained through experimental classical methods.
It is important to remark that frying temperature was not found to have any significant effect on total oil content. Therefore, a combination of total oil content data for all temperatures was performed to obtain a linear model independently of frying temperature in the range from 160 to 190°C, in order to obtain more representative results. The mathematical linear model, the digital feature selected (Mean Laplacian-Blue) and cross-validation data are shown in , obtaining a lower (moderately) variation coefficient (R 2 = 0.843) and lower % of success of the prediction (70%) of total oil content in comparison to the models obtained to each condition process. However, this linear model would be a much better outcome and more practicable for the snack industry.
CONCLUSIONS
In conclusion, the total oil content of tortilla chips was absorbed principally during the first 10 s of frying, and total oil uptake ratio was independent of the oil frying temperature. Intensity and geometric digital features (a total of 672 features) were extracted from their digital images by using a computer vision technique and only 9 of them are selected, which depends mainly on oil frying temperature and the oil content fraction. Surface, structural, and total oil content experimentally measured showed a linear correlation (R 2 > 0.95) with textural digital features obtained by CV, such as Fourier Haralick and Hu moments, which permits the prediction of these chemical parameters through image analysis. According to the cross validation technique, the performance in the prediction was ∼97% and the coefficient of variation was lower than 5% showing the repeatability and effectiveness of each linear model to predict oil content using digital features and the good fitting of the prediction. Therefore, trustable models, which allow predicting properties of the tortilla chips, can be developed by using selected features extracted from their digital images, without the necessity of measuring them. However, the result of the correlation analysis showed that different combinations of features are needed for each frying temperature, and that it is necessary to choose individual combinations for each frying temperature and oil content fraction. These results indicated that it is not easily transferable to other cases. Despite this, a combination of image features for all temperatures was performed to predict the total oil content of tortilla chips, which would be a better and more practical outcome. This emergent procedure could be implemented to improve and control the frying process of tortilla chips.
ACKNOWLEDGMENTS
The authors would like to acknowledge Sr. Jon May from FHM Alimentos Ltd., for providing the masa to chips elaboration. This work was financially supported by Vicerrectoría de Investigación y Desarrollo of Universidad de Santiago de Chile (USACH), FONDECYT Project 1070031, LACCIR Virtual Institute (Project R0308LAC003), Consejo Nacional de Investigaciones Científicas y Técnicas (CONICET) from Argentina, and PBCT-PSD-62 Project from CONICYT-Chile.
Notes
1Balu Toolbox can be downloaded from http://dmery.ing.puc.cl.
REFERENCES
- Sefa-Dedeh , S. , Cornelius , B. , Sakyi-Dawson , E. and Afoakwa , E.O. 2004 . Effect of nixtamalization on the chemical and functional properties of maize . Food Chemistry , 86 : 317 – 324 .
- Serna-Saldivar , S.O. , Gomez , M.H. and Rooney , L.W. 1990 . “ Technology, chemistry, and nutritional value of alkaline-cooked corn products ” . In Advances in Cereal Science and Technology; Pomeranz, Y , 243 St. Paul , MN : American Assoc. Cereal Chemists .
- Moreira , R.G. , Sun , X. and Chen , Y. 1997 . Factors affecting oil uptake in tortilla chips in deep-fat frying . Journal of Food Engineering , 31 : 485 – 498 .
- Kawas , M.L. and Moreira , R.G. 2001 . Characterization of product quality attributes of tortilla chips during the frying process . Journal of Food Engineering , 47 : 97 – 107 .
- Mellema , M. 2003 . Mechanism and reduction of fat uptake in deep-fat fried foods . Trends in Food Science and Technology , 14 : 364 – 373 .
- Bouchon , P. , Aguilera , J.M. and Pyle , D.L. 2003 . Structure oil-absorption relationships during deep-fat frying . Journal of Food Science , 68 : 2711 – 2716 .
- Duran , M. , Pedreschi , F. , Moyano , P. and Troncoso , E. 2007 . Oil partition in pre-treated potato slices during frying and cooling . Journal of Food Engineering , 81 : 257 – 265 .
- Brosnan , T. and Sun , D.W. 2004 . Improving quality inspection of food products by computer vision—A review . Journal of Food Engineering , 61 : 161 – 166 .
- Mery , D. and Pedreschi , F. 2005 . Segmentation of colour food images using a robust algorithm . Journal of Food Engineering , 66 : 353 – 360 .
- Pedreschi , F. , León , J. , Mery , D. and Moyano , P. 2006 . Development of a computer vision system to measure the color of potato chips . Food Research International , 39 : 1092 – 1098 .
- Mery , D. and Soto , A. 2008 . Features: The more the better. In: New Aspects of Signal Processing, Computational, Geometry and Artificial Vision . Proceedings of the 7th WSEAS International Conference on Signal Processing, Computational Geometry and Artificial Vision , : 46 – 50 . Rodos Island, Greece, August 20–22
- Gunasekaram , S. and Ding , K. 1994 . Using computer vision for food quality evaluation . Food Technology , 48 : 151 – 154 .
- Gerrard , D.E. , Gao , X. and Tan , J. 1996 . Beef marbling and color store determination by image processing . Journal of Food Science , 61 : 145 – 148 .
- Luzuriaga , D. , Balaban , M.O. and Yeralan , S. 1997 . Analysis of visual quality attributes of white shrimp by machine vision . Journal of Food Science , 61 : 113 – 118 .
- Leemans , V. , Magein , H. and Destain , M.F. 1998 . Defects segmentation on ‘Golden Delicious’ apples by using color machine vision . Computers and Electronics in Agriculture , 20 : 117 – 130 .
- Ram , T. , Wiesman , Z. , Parmet , I. and Edan , Y. 2010 . Olive oil content prediction models based on image processing . Biosystem Engineering , 10 : 221 – 232 .
- Abdullah , M.Z. , Guan , L.C. and Mohd Azemi , B.M.N. 2001 . Stepwise discriminant analysis for colour grading of oil palm using machine vision system . Food and Bioproducts Processing , 79 : 223 – 231 .
- Marty , S. , Baker , K.W. and Marangoni , A.G. 2009 . Optimization of a scanner imaging technique to accurately study oil migration kinetics . Food Research International , 42 : 368 – 373 .
- Nopens , I. , Foubert , I. , De Graef , V. , Van Laere , D. , Dewettinck , K. and Vanrolleghem , P. 2008 . Automated image analysis tool for migration fat bloom evaluation of chocolate coated food products . LWT–Food Science and Technology , 41 : 1884 – 1891 .
- Konopka , I. , Kozirok , W. and Rotkiewicz , D. 2004 . Lipids and carotenoids of wheat grain and flour and attempt of correlating them with digital image analysis of kernel surface and cross-sections . Food Research International , 37 : 429 – 438 .
- Pedreschi , P. , Mery , D. , Mendoza , F. and Aguilera , J.M. 2004 . Classification of potato chips using pattern recognition . Journal of Food Science , 69 : 264 – 270 .
- Matiacevich , S. , Mery , D. and Pedreschi , F. 2012 . Prediction of mechanical properties of corn and tortilla chips using computer vision . Food Processing Technology , 5, 2025–2030
- Haralick , R. 1979 . Statistical and structural approaches to texture . Proceedings of the IEEE , 67 : 786 – 804 .
- Mery , D. , Chanona-Perez , J.J. , Soto , A. , Aguilera , J.M. , Cipriano , A. , Veléz-Rivera , N. , Arzate-Vázquez , I. and Gutiérrez-López , G.F. 2010 . Quality classification of corn tortillas using computer vision . Journal of Food Engineering , 101 : 357 – 364 .
- Blumenthal , M. 1991 . A new look at the chemistry and physics of deep fat frying . Food Technology , 45 : 68 – 71 .
- León , K. , Mery , D. , Pedreschi , F. and León , J. 2006 . Color measurement in L*a*b* units from RGB digital images . Food Research International , 39 : 1084 – 1091 .
- MathWorks . Image Processing Toolbox for Use with MATLAB: User's Guide , The MathWorks Inc.: Natick, MA, USA, 2008 .
- AACC . 1986 . Oil content. In: Approved Methods of the American Association of Cereal Chemists , AACC , MN : St Paul .
- Mitchell , T.M. 1997 . Machine Learning , 414 McGraw-Hill , MA : Boston .
- Gamble , M.H. , Rice , P. and Selman , J.D. 1987 . Relationships between oil uptake and moisture loss during frying of potato slices from cv. Record U.K. tubers . International Journal of Food Science and Technology , 22 : 233 – 241 .
- Pinthus , E.J. , Weinberg , P. and Saguy , I.S. 1993 . Criterion for oil uptake during deep-fat frying . Journal of Food Science , 58 : 204 – 205 .
- Moyano , P.E. and Pedreschi , F. 2006 . Kinetics of oil uptake during frying of potato slices: Effect of pre-treatments . LWT–Food Science and Technology , 39 : 285 – 291 .