
Abstract
Fourier transform infrared spectroscopy with attenuated total reflectance accessory was used to detect the presence of lard in French fries pre-fried in palm oil adulterated with lard. A Fourier transform infrared calibration model was obtained using partial least squares for prediction of lard in a blend mixture of lard and palm oil. The coefficient of determination (R2) of 0.9791 was obtained with 0.5% of detection limit. The error in calibration expressed with root mean square error of calibration was 0.979%. In addition, the error obtained during cross validation was 2.45%. A discriminant analysis test was able to distinguish between fries samples adulterated with lard and samples, which were pre-fried with palm oils. Fourier transform infrared spectroscopy is a fast and powerful technique for quantification of lard present in French fries.
INTRODUCTION
It was estimated that the majority of 30 million MT processed raw potatoes is used for French fries and other pre-fried potato products.[Citation1] In 2005–2006, French fry exports of world leaders, such as the Netherlands, Canada, and the USA, were 2.67 million MT or 30% of the global volume.[Citation2] The increase in French fries consumption is associated with urbanization, rising incomes, changing lifestyles, and expanding tourism.[Citation3] Despite being well received, French fries are associated with unhealthy eating due to its high fat, energy, and salt contents.
Nowadays, due to its capability to provide a fingerprint technique, Fourier transform infrared (FTIR) spectroscopy has become a preferred method for the determination of food constituents, including in the field of edible fats and oils. Different materials possess different combinations of atoms, and thus fingerprint of a sample can be identified in a form of infrared spectrum. The most prominent advantages with the use of FTIR are its ease of use and rapidity. With respect to oil, especially with the development of attenuated total reflectance (ATR) as a sampling technique, FTIR has been successfully applied in various analyses including authentication studies in virgin olive oil,[Citation4 − Citation7] hazelnut,[Citation8] and virgin coconut oil.[Citation9]
Combined with certain powerful chemometrics techniques, FTIR spectroscopy has been proven to be potentially applied in detection of lard in chocolate,[Citation10] cake,[Citation11] mixture of animal fats,[Citation12,Citation13] and in the mixture of some vegetable oils.[Citation14] Various methods have been developed to detect adulteration of lard in vegetable oils, such as identification of lard contamination in admixture of vegetable oils using gas liquid chromatography,[Citation15] detection of adulteration of lard in canola oil using differential scanning calorimetry,[Citation16] and detection of lard adulteration in refined bleached deoderized (RBD) palm kernel olein using an electronic nose.[Citation17] The present study was conducted to extend the study for possibility of detection of lard in pre-fried French fries using FTIR spectroscopy in combination with chemometrics of partial least squares and discriminant analysis.
MATERIALS AND METHODS
Samples
Palm oil and potatoes were purchased from a local grocery store in Seri Kembangan, Selangor, Malaysia. The adipose tissue of pig was obtained from several slaughterhouses of pig around Serdang, Selangor, Malaysia.
Sample Preparation
A lard sample was extracted by rendering adipose tissue of a slaughtered pig in a conventional oven (Pensonic AE-11N, Penang, Malaysia) at 130°C for 2 h according to Rohman and Che Man.[Citation18] The melted fat was filtered through Whatman filter paper and dried by the addition of anhydrous Na2SO4. The filtered samples were stored in a tightly closed container in a refrigerator until further analysis. Lard either alone or in the mixture with palm oil was used for frying French fries prepared as below.
The potatoes were washed, hand peeled, and cut into slices of 6 mm × 6 mm × 60 mm. They were soaked in distilled water at room temperature (25°C) to wash off any dirt and prevent Maillard reaction, which causes browning of the surface of the potatoes, and then slightly blotted dry with tissue paper. A batch of 100 g of slices potatoes were fried in a batch fryer (Type T4, Valentine Equipment Ltd., Reading, UK) at 180°C for 2 min using the blend mixture of palm and lard as indicated in the calibration standard. The French fries were allowed to drain for 10 min and then lightly blotted with tissue paper to remove excess oil. The French fries obtained were stored in a tightly closed bottle before extracting the fat the next day.
Extraction of Fat from French Fries
The fat of the commercial and the prepared French fries were extracted according to Soxhlet method using the Soxtex 2050 auto extraction unit (Foss Tecator AB, Hoganas, Sweden), as described in Syahariza et al.[Citation11] Petroleum ether was used as the solvent. The following operating conditions were used: temperature at 135°C; boiling time for 25 min, rinsing time for 45 min, and recovery time for 15 min. Solvent from the extracted fat was evaporated using a vacuum rotary evaporator. Fat samples collected were stored in a 10-ml vial and stored at −20°C for further analysis.
Preparation of Calibration and Validation Data Sets
Before being used for preparing a calibration standard, lard was thawed in a water bath at 60°C. The calibration set was prepared by spiking lard into palm oil in a ratio of lard to palm oil of 0.5:99.5, 1:99, 2:98, 3:97, 4:96, 5:95, 10:90, 15:85, and 0:100 (v/v). The oil blend was used for frying the potatoes. The extracted fat and oil (lard and palm oil) from the French fries was analyzed using FTIR spectrophotometer for developing PLS calibration model. For prediction or validation data, a set of eight French fries was prepared. The FTIR spectral regions, where the variations were observed between pure lard and palm oil, were chosen for developing partial least squares (PLS) in order to quantify lard extracted from French fries samples.
FTIR Analysis
A Thermo Nicolet Nexus 370 instrument (Madison, WI, USA) equipped with a deuterated triglycine sulphate (DTGS) detector and KBr beam splitter was used to measure the FTIR spectra of oil samples. Drops of oil samples were placed on a multi bounce plate ZnSe of horizontal attenuated total reflectance (HATR) crystal. Measurements were taken at 64 scans and at a resolution of 4 cm−1 with strong apodization. The background of air was collected before every sample was measured. After each measurement, the plate was carefully cleaned from any previous residues by wiping using acetone and hexane and dried with a soft tissue before filling in with the next sample. The software used for FTIR data collection was Nicolet Omnic (version 7.0, Madison, WI, USA). All spectra were recorded from 4000 to 650 cm−1 and read as absorbance in triplicate.
Fatty Acid Analysis by Gas Chromatography
Fatty acid compositions of palm oil and lard samples were analyzed by gas chromatography. Fatty acid methyl esters (FAME) were prepared according to Cocks and Van Rede.[Citation19] An oil sample (50 mg) was dissolved in hexane (0.8 ml) and sodium methoxide (1M, 0.2 ml). The oil mixture was vortexed and the upper layer containing FAME was transferred to a 2-ml vial for a subsequent analysis using gas chromatography (Agilent Technologies 6890N, Santa Clara, CA, USA) fitted with a flame ionization detector (FID). A polar capillary column RESTEX 2330 (0.25 mm internal diameter, 30 m length, and 0.2 μm film thickness; Restek Corp., Bellefonte, PA, USA) was used at a column pressure of 1.03 × 10⁵ Pa. The initial column temperature was 50°C (held for 2 min), then increased to 180° at a rate of 5°C/min, held for 2 min at 180°C, then increased at a rate of 8°C/min to 200°C and held for 5 min at 200°C. Standard FAME (Sigma Chemicals, St. Louis, MO, USA) were used as authentic samples and a tentative peak identification was done by comparing relative retention times. Quantification of FAME was carried out based on an internal normalization technique.
Statistical Analysis
The program TQ Analyst version 6.0 (Thermo Nicolet, Madison WI, USA) software package was used to do the chemometric analysis, including partial least squares (PLS) and discriminant analysis. The PLS model was used for developing calibration and validation models. The leave-one-out cross validation procedure was used to verify the calibration model. The root mean square error of cross validation (RMSECV) and the coefficient of determination (R 2) were used as the validity criteria for PLS calibration.
RESULTS AND DISCUSSION
Spectra
Due to its ability as a fingerprint analytical technique, FTIR spectrometry can be exploited as a powerful tool to distinguish among edible fats and oils. Spectra of pure palm oil and lard are shown in . Both oils show the typical spectra of fats and oils. Some of the main absorption bands of the oil spectra are due to the CH stretching at 3050–2800 cm−1, carbonyl stretching of the triacylglycerol ester linkage at 1746–1744 cm−1, and the fingerprint region at 1500–1000 cm−1, which is slightly complex due to the presence of more than one functional group. The details of the bands in the fingerprint region have been explained by Guillen and Cabo.[Citation20]
Figure 1 FTIR spectra of pure palm oil and lard. Peaks ‘a’ and ‘b’ indicate the absorption bands that are significant for differentiation between both spectra. (Color figure available online.)
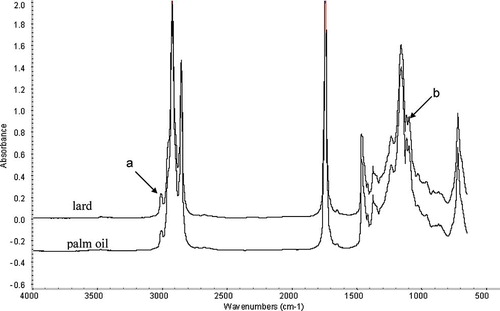
Upon close observation, the spectra for palm oil and lard exhibited differences at frequency 3006 cm−1, indicated as ‘a’, and also in the frequency region of 1120–1095 cm−1, indicated as ‘b’ in . Both spectra of palm oil and lard exhibited a shoulder band at 3006 cm−1. This band is associated with the stretching vibration of cis olefinic double bonds.[Citation20] Fatty acid composition of palm oil and lard shows that both oils have quite a high amount of oleic acid (). However, compared to palm oil, lard contained linolenic acyl groups twice as much as palm oil. This was reflected in the lard spectrum, in which a sharper band was observed at frequency 3006 cm−1 compared to palm oil spectrum. Fats with a high proportion of linolenic and linoleic acyl groups show higher frequency for this band compared to the high proportion of oleic acyl groups.[Citation15] Measurements on the peak height and peak area of the bands at 3006 cm−1 were taken and it was found that there was a gradual increase in the peak area and peak height as the ratio of lard in palm oil was increased (data not shown) and this can be observed qualitatively as shown in Fig. 2.
Table 1 Fatty acid composition of palm oil and lard
Figure 2 FTIR spectra of mixture of palm oil and lard in the decreasing order of lard concentration: (a) 100%, (b) 15%, (c) 10%, (d) 2%, and (e) 0.5%.
Lard and palm oil spectra show an overlap of two peaks having maximum absorption at 1119 and 1100 cm−1. These peak heights were shown to be inversely related with a proportion of saturated acyl groups and oleic acyl groups, respectively.[Citation13] Lard had approximately equal proportions of saturated acyl groups and oleic acyl group, which was reflected in the lard spectra, in which peaks of 1119 and 1100 cm−1 appeared as having the same height. Palm oil, on the contrary, having more concentration of saturated acyl groups than oleic acyl group, demonstrated unequal height of peak 1119 and 1100 cm−1 in the palm oil spectrum.
Partial Least Squares (PLS) Calibration and Cross Validation
To quantify the concentration of lard in the palm oil mixture, the PLS approach was used. shows the calibration plot of actual data against the PLS predicted data for the mixture of palm oil and lard. The region of 3100–1050 cm−1, which covers the features of interest, was selected for developing a calibration model. A linear regression was obtained with coefficient of determination (R 2) of 0.9791, indicating that the difference between the actual concentration and the calculated concentration generated from the model was very small. The root mean square error of calibration (RMSEC) of 0.9791% (v/v) was obtained.
Figure 3 FTIR predicted values versus the actual concentration of lard in palm oil from the extracted fat of French fries. (Color figure available online.)
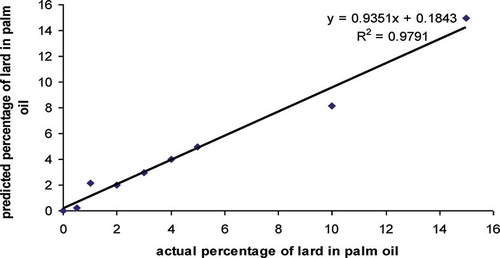
In order to validate the PLS model, the cross validation was carried out using “leave-one-out” technique by removing one standard at a time. The accuracy of the model was assessed according to R 2 and the residual mean square error of cross validation (RMSECV). The low RMSECV value indicated that cross validation error is low. The final R 2 of 0.9506 and RMSECV of 2.45% (v/v) were obtained during cross validation. The mean difference (MD) and standard deviation of difference (SDD) for overall accuracy obtained was 0.3567 and 0.2522%, respectively. The low values obtained indicate very close agreement between the actual data and predicted FTIR result. Based on this result, it can be deduced that FTIR spectroscopy combined with PLS offers the fast and reliable technique for quantification of lard in palm oil extracted from French fries as the sample matrix. Besides using ATR, the use of reagents and solvents are minimalized; therefore ATR-FTIR spectroscopy can support the green chemistry program.
Discriminant Analysis
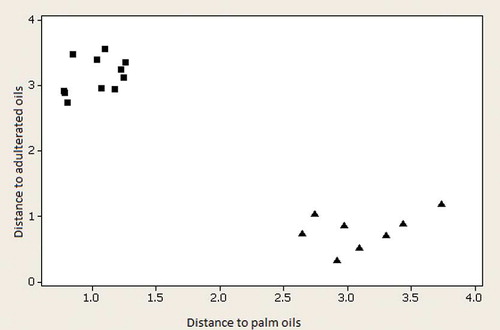
Discriminant analysis (DA) is one of the chemometrics techniques based on supervised pattern recognition techniques. DA can be exploited to determine the class of palm oil with palm oil adulterated with lard by calculating the distance from each class center in Mahalanobis distance units.[Citation21] The samples were assigned into two separated classes, which were pure oils and adulterated oils. The software calculated the distance of samples to those classes and created new classes, which were the calculated class of pure and adulterated oil. illustrated the differentiation plot between palm oils used for frying French fries and palm oil mixed with lard for such frying. Samples of vegetable oils formed a separate cluster, away from the adulterated samples. No samples were mistakenly identified. This indicates that FTIR is highly efficient in distinguishing between palm oil and lard adulterated samples.
Figure 4 Classification between fat extracted from French fries pre-fried with pure palm oils (▪) and lard adulterated French fries (▲). (Color figure available online.)
CONCLUSION
FTIR spectroscopy in combination with multivariate calibration of PLS can be successfully used for quantification of lard in French fries. The result indicated that lard in a mixture of palm oil, can be detected down to 0.5%. In addition, discriminant analysis can make a classification between palm oil and palm oil adulterated with lard extracted from French fries samples. The method is simple, fast, and accurate, which can be incorporated to be used for quality control routine analysis.
REFERENCES
- Keijbets , M.J.H. 2008 . Potato processing for the consumer: Developments and future challenges . Potato Research , 51 : 271 – 281 .
- Agriculture and Agri-Food Canada. Canadian potato situation and trends 2006–2007. 2007(accessed 30 March 2011) www.agr.gc.ca (http://www.agr.gc.ca)
- Morrow , L. and Jecha-Beard , L. 2003 . Developments in the international potato processing industry . Acta Horticulturae , 619 : 459 – 462 .
- Rohman , A. and Che Man , Y.B. 2010 . Fourier transform infrared (FTIR) spectroscopy for analysis of extra virgin olive oil adulterated with palm oil . Food Research International , 43 : 886 – 892 .
- Lai , Y.W. , Kemsley , E.K. and Wilson , R.H. 1995 . Quantitative analysis of potential adulterants of extra virgin olive oil using infrared spectroscopy . Food Chemistry , 53 : 95 – 98 .
- Tay , A. , Singh , R.K. , Krishnan , S.S. and Gore , J.P. 2002 . Authentication of olive oil adulterated with vegetable oils using Fourier transform infrared spectroscopy . LWT–Food Science and Technology , 35 : 99 – 103 .
- Rohman , A. and Che Man , Y.B. “ Authentication of extra virgin olive oil from sesame oil using FTIR spectroscopy and gas chromatography ” . In International Journal of Food Properties 2012, 15, 1309–1318.
- Ozen , B.F. and Mauer , L.J. 2002 . Detection of hazelnut oil adulteration using FTIR spectroscopy . Journal of Agricultural and Food Chemistry , 50 : 3898 – 3901 .
- Manaf , M.A. , Che Man , Y.B. , Abdul Hamid , N.S. , Ismail , A. and Zainul Abidin , S. 2007 . Analysis of adulteration of virgin coconut oil by palm kernel olein using Fourier transform infrared spectroscopy . Journal of Food Lipids , 14 : 111 – 121 .
- Che Man , Y.B. , Syahariza , Z.A. , Mirghani , M.E.S. , Jinap , S. and Bakar , J. 2005 . Analysis of potential lard adulteration in chocolate and chocolate products using Fourier transform infrared spectroscopy . Food Chemistry , 90 : 815 – 819 .
- Syahariza , Z.A. , Che Man , Y.B. , Selamat , J. and Bakar , J. 2005 . Detection of lard adulteration in cake formulation by Fourier transform infrared (FTIR) spectroscopy . Food Chemistry , 92 : 365 – 371 .
- Che Man , Y.B. and Mirghani , M.E.S. 2001 . Detection of lard mixed with body fats of chicken, lamb and cow by Fourier transform infrared spectroscopy . Journal of the American Oil Chemists’ Society , 78 : 753 – 761 .
- Jaswir , I. , Mirghani , M.E.S. , Hassan , T.H. and Said , M.Z. 2003 . Determination of lard in mixture of body fats of mutton and cow by Fourier transform infrared spectroscopy . Journal of Oleo Science , 52 : 633 – 638 .
- Rohman , A. , Che Man , Y.B. , Ismail , A. and Hashim , P. 2011 . FTIR spectroscopy combined with chemometrics for analysis of lard adulteration in some vegetable oils . CYTA–Journal of Food , 9 ( 2 ) : 96 – 101 .
- Marikkar , J.M.N. , Ghazali , H.M. , Che Man , Y.B. , Peiris , T.S.G. and Lai , O.M. 2005 . Distinguishing lard from other animal fats in admixture of vegetable oils using liquid chromatographic data coupled with multivariate data analysis . Food Chemistry , 91 : 5 – 14 .
- Marikkar , J.M.N. , Ghazali , H.M. , Che Man , Y.B. and Lai , O.M. 2002 . The use of cooling and heating thermograms for monitoring of tallow, lard and chicken fat adulterations in canola oil . Food Research International , 35 : 1007 – 1014 .
- Che Man , Y.B. , Gan , H.L. , NorAini , I. , Nazimah , S.A.H. and Tan , C.P. 2005 . Detection of lard adulteration in RBD palm olein using an electronic nose . Food Chemistry , 90 : 829 – 835 .
- Rohman , A. and Che Man , Y.B. 2009 . Analysis of cod-liver oil adulteration using Fourier transform infrared (FTIR) spectroscopy . Journal of the American Oil Chemists’ Society , 86 : 1149 – 1153 .
- Cocks , L.V. and Van Rede , C. 1966 . Laboratory Handbook for Oil and Fats Analysts , London : Academic Press .
- Guillen , M.D. and Cabo , N. 1997 . Characterization of edible oils and lard by Fourier transform infrared spectroscopy, relationships between composition and frequency of concrete bands in the fingerprint region . Journal of the American Oil Chemists’ Society , 74 : 1281 – 1286 .
- Miller , J.N. and Miller , J.C. 2005 . Statistics and Chemometrics for Analytical Chemistry , 5th , 213 – 239 . England : Pearson Education Limited, Edinburgh Gate Harlow .