
Abstract
Fourier-transform infrared spectra in combination with chemometrics and fatty acid composition were used to analyze pumpkin seed oil blended into extra virgin olive oil. Two multivariate calibrations, namely, partial least square and principle component regression were evaluated for quantification of pumpkin seed oil in extra virgin olive oil. The combined frequency regions of 3020–2995 and 1070–900 cm−1 were preferred for such quantification using partial least square model with coefficient of determination (R2) obtained of >0.99. The errors in partial least square calibration and validation models were of 0.166 and 1.32% (vol/vol), respectively. Discriminant analysis can successfully classify extra virgin olive oil and extra virgin olive oil blended with pumpkin seed oil. The change of oleic and linoleic acids due to the addition of pumpkin seed oil into extra virgin olive oil can be used for the identification of blending practice of pumpkin seed oil into extra virgin olive oil. The level of oleic acid was decreased with the increasing concentration of pumpkin seed oil with R2 of 0.946. In addition, the level of linoleic acid was increased with the increasing level of pumpkin seed oil addition with R2 of 0.978.
INTRODUCTION
Some high-priced oils like olive oil (OO) can be the target of adulteration practice. The adulteration usually involves the blending or dilution of OO with lower-priced plant oils, such as corn, soybean, palm, and pumpkin oils.[Citation1] For this reason, accurate and reliable analytical techniques are continuously proposed and developed by researchers to detect the adulteration practice of OO in order to protect the consumer rights from economic loss and incorrectly labeled oils.[Citation2]
OO is oil extracted from the fruit of Olea europea L. It is known as a valuable product from the Mediterranean countries and is consumed worldwide.[Citation3] Among OO classes, extra virgin olive oil (EVOO) is the highest quality of OO types and has commanded high price value in the fats and oils market. EVOO is considered as functional food oils due to its beneficial effects to human health. EVOO contains a relatively high amount of oleic acid (C18:1) and natural phenolic antioxidants.[Citation4,Citation5]
Several analytical methods have been used for authentication analysis of EVOO from blending practices with other plant oils. Such methods are gas-liquid chromatography for determination of fatty acid and sterol composition,[Citation6] high performance liquid chromatography—especially hyphenated with mass spectrometry for triacylglycerol analysis,[Citation7] differential scanning calorimetry for investigation the thermal properties of studied oils,[Citation8] nuclear magnetic resonance (NMR) spectroscopy,[Citation9,Citation10] synchronous fluorescence,[Citation11] electronic nose for analysis of volatile compounds,[Citation12] and Fourier-transform infrared (FTIR) spectroscopy, especially in combination with certain chemometrics techniques.[Citation13] However, most of the methods are a laborious and time consuming necessity of multistep sample preparation, involving hazardous chemicals and solvents, and requiring experienced operators.
Currently, FTIR spectroscopy coupled with multivariate analysis has emerged as an attractive technique for fast, simple, sensitive, and high-throughput analysis of food components.[Citation14,Citation15] The advance in infrared instrumentation development, sampling handling presentation, and chemometrics techniques (multivariate calibration and pattern recognition technique) have made it possible to analyze EVOO blended with other oils.[Citation16] The authors’ group has developed FTIR spectroscopy combined with chemometrics techniques for analysis of EVOO blended with palm oil[Citation17] and lard,[Citation18] determination of some vegetables oils in cod liver oil,[Citation19] and for quantitative analysis of sesame oil in olive oil.[Citation20] FTIR spectroscopy was also used for analysis of fat and moisture in mayonnaise.[Citation21] In addition, some authors still use the validated gas chromatography with flame ionization detector for fatty acid analysis in order to differentiate EVOO and that blended with other oils.[Citation22]
The objective of the present study was to analyze pumpkin seed oil (PSO) in EVOO using FTIR spectroscopy in combination with multivariate calibrations of partial least square regression (PLSR) and principle component regression (PCR). Discriminant analysis is used to differentiate EVOO and EVOO blended with PSO. The change of fatty acid contents due to the addition of PSO into EVOO is also presented.
MATERIALS AND METHODS
Materials
Extra virgin olive oil (EVOO) from different branded-names, having similar fatty acid composition and in the range level as specified in Codex Allimentarius,[Citation23] pumpkin seed oils (PSO), grape seed, corn, sesame, rice bran, sunflower, palm, soybean, canola, and walnut oils were purchased from a retail market in Serdang, Selangor, Malaysia. The standard of 37 fatty acids was bought from Sigma (USA). The solvents and reagents (sodium hydroxide, methanol, hexane, sodium chloride, and acetone) used are obtained from E. Merck (Darmstadt, Germany).
Fatty Acid (FA) Analysis
The contents of FA in the studied samples were determined using gas chromatography with flame ionization detection (GC-FID). The samples were prepared by mixing EVOO with PSO at the concentration ratio of 0:100, 5:95, 10:90, 15:85, 20:80, 25:75, 30:70, 35:65, 40:60, and 100:0 (vol/vol). The preparation of fatty acid methyl ester (FAME) was performed using NaOCH3 in MeOH according to Rohman and Che Man.[Citation24] The separation of FAMEs was carried using a capillary column of DB-5 (0.25 mm internal diameter, 30 m length, and 0.2 μm film thickness) from Restex Corp. (Bellefonte, PA, USA). The initial temperature for the column oven was 120°C (hold for 1 min), then increased into 180°C (8°C/min), ramped to 240°C (10°C/min), and held at 240°C for 5 min. The temperatures of the detector and injector were set at 240°C. The flow rate of helium as the carrier gas was set at 6.8 mL/min. The peak integration was performed using a built-in data-handling program provided by GC manufacturer (Shimadzu GC-2010).
Fatty acids were reported as relative percentage of the total peak area. Standard FAMEs and treated samples were run on GC under the same conditions. The relative peak area of FAMEs was used for quantification of FA.[Citation25] The FA contents were analyzed using one-way analysis of variance (ANOVA) using SPSS software (version 17.0; SPSS Inc., Chicago, IL, USA). Principal component analysis including the score plot and loading plot was performed with the Unscrambler software from Camo (USA) using fatty acid compositions of studied plant oils as matrix variables.
Quantification and Discrimination of PSO Blended into EVOO Using FTIR Spectroscopy
Calibration and prediction samples
For quantitative analysis, a set of 20 calibration samples spanning 0.0–50.0% (vol/vol) PSO blended into EVOO was prepared. Furthermore, in order to test a multivariate calibration model developed from the calibration samples, another 20 samples were made as prediction/validation samples. All samples are subjected to FTIR spectra acquisition.
Discrimination analysis
Discrimination between PSO and PSO blended with EVOO was performed using discriminant analysis (DA). DA is one of the supervised pattern recognition techniques aiming to use the known group of samples (called a learning or training set) to find a rule for allocating a new sample of unknown group to the correct group of samples.[Citation26] The learning or training set of pure EVOO and EVOO mixed with PSO at a certain concentration (1.0–50.0% vol/vol) was prepared. The pure EVOO was marked with “unblended EVOO”; meanwhile, EVOO mixed with PSO was assigned with “blended EVOO.”
FTIR spectra acquisition
Approximately 1.0 ml of oil samples was placed on good direct contact with an attenuated total reflectance (ATR) crystal composed of ZnSe with single bounce-attenuated total reflectance (SB-ATR) using a Smart ARK accessory. The instrument was equipped with a deuterated triglycine sulfate (DTGS) detector and KBR beam splitter. FTIR spectra was scanned at mid infrared region (4000–650 cm−1) and co-added at 32 scanning with 4 cm−1 resolution. Each FTIR spectrum absorbance was subsequently subtracted with fresh background obtained with dry and empty ATR cell (air). Before acquiring each FTIR spectrum, the ATR crystal was carefully cleaned with a soft tissue soaked in hexane and then rinsed with acetone to remove any residues from the previous samples. All measurements were done in three replicates for each sample. The software OMNIC (Version 7.0) from Thermo Nicolet was used for FTIR spectra acquisition and instrument control.
Statistical Analysis
Chemometrics analysis of multivariate calibrations (PLSR and PCR) and DA were carried out using the program of TQ AnalystTM version 6 (Thermo Electron Corporation, Madison, WI, USA). To evaluate the multivariate calibrations, the coefficient of determination (R2), root mean square error of calibration (RMSEC), and root mean square error of prediction (RMSEP) were calculated.
RESULTS AND DISCUSSION
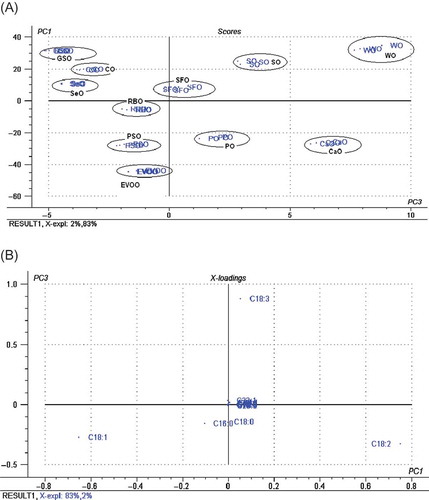
In this study, PSO was used as oil mixed into EVOO. The selection of PSO as the oil mixture for EVOO was based on the closest distance of PSO to EVOO in principal component analysis (PCA) score plot (). PCA was projected by its principal components (PCs) using FA compositions from C10 to C22 of EVOO and others as matrix variables. The FA contents of PSO, EVOO, and other plant oils have been reported previously.[Citation27] In PCA, the first principle components (PC1) account for the most variation; meanwhile, the second principle components (PC2) account for the next largest variation, and so on. PC1, PC2, and PC3 described 83, 14, and 2% variances, respectively; therefore, an eigenvalue of 99% can be achieved using the first three PCs. Using the projections of PC1 and PC2, EVOO was not well separated from PSO (figure not shown). Alternatively, the score plot projected by PC1 and PC3 with less variance (about 85%) was used. Using the projections of PC1 and PC3, it is clear that EVOO was well separated from others, especially with PSO. Based on the score plot as shown in , it can be seen that PSO has similar FA profiles to EVOO, compared with other studied plant oils. showed the loading plot describing the projection of variables in the equal plane to the score plot. The absolute value of loading plot explains the importance of FA compositions to the PCA model. The farther FA composition is away from the origin variable point, the larger the contribution of that FA to the PCA model. Therefore, the most FA types contributing to PCA score plot are oleic acid (C18:1) and palmitic acid (C16:0).
FIGURE 1 PCA of EVOO, PSO, and other vegetable oils: (a) score plot and (b) loading plot. GSO: grape seed; CO: corn; SeO: Sesame; SFO: Sunflower; SO: soybean; WO: walnut; RBO: Rice bran; PSO: Pumpkin seed; PO: palm; CaO: canola oil.
Quantification and Classification Using FTIR Spectroscopy
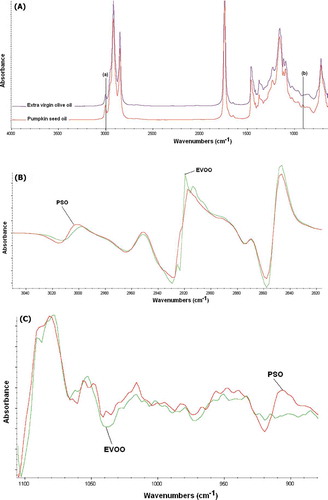
exhibited FTIR normal spectra of PSO and EVOO, arising from the absorption of functional groups present in both oils. The assignment of each peak and shoulder can be found in the literature.[Citation13,Citation15,Citation28] As can be seen, both spectra are very similar and the spectral features can be correlated with triacylglycerol, the main components present in edible oils; however, there is a slight difference between both spectra in terms of peak/band intensities, especially at frequencies of 3007 and 912 cm−1. Peak at 3007 cm−1 (a) is due to the stretching vibration of cis CH=CH, whereas the band at 912 cm−1 (b) is attributed from bending vibration of –HC=CH-(cis) out of plane with very weak intensity.[Citation13] These differences were more evident when the first derivative was used, especially at frequency regions of 3050–2800 and 1100–900 cm−1, as shown in and , respectively.
FIGURE 2 (a) FTIR normal spectra of extra virgin olive oil and pumpkin seed oil, scanned at mid infrared region (4000–650 cm−1). The first derivative FTIR spectra at frequency region of 3050–2800 (b), and at 1100–900 cm−1 (c).
The selection of frequency regions for quantification of PSO in EVOO was automatically performed by TQ Analyst software, and confirmed by observing the variation rise between EVOO and PSO spectra. This can ensure the acquisition of an important frequency region and remove the redundant and noisy spectra. The spectra between 4000–3050 cm−1 was removed because it does not give useful chemical information; inversely, it contributes to instrumental noise.[Citation29] Using the optimization of frequency regions, the combined frequency ranges of 3020–2995 and 1070–900 cm−1 were selected for analysis of PSO in EVOO. These frequencies offer the higher coefficient of determination (R2) and the lower error in the calibration model, compared with other frequency regions or its combination.
The further optimization procedure was carried out by making the comparison of multivariate calibrations (PLSR and PCR) as well as the spectral treatment (normal and Savitsky-Golay derivatization). The values of R2 and errors in calibration (RMSEC) and in prediction (RMSEP) were used as the criteria parameters to be taken into account. showed the analytical figure of merits for quantification of PSO in blended EVOO. From , it is known that the PLSR model using normal spectra offer the realistic model, meaning that errors in calibration and validation data are reasonable. In addition, first derivative spectra offer a very optimistic model, especially in validation data set. This indicates that over-fitting occurs. Over-fitting the regression model is one of the potential disadvantages when using PLS regression. It means that the model generates an optimistic model on the set of data used for calibration/validation, but the model would not perform well on other data sets with similar sample materials.[Citation26] For this reason, FTIR with normal spectra was preferable for quantification of PSO in EVOO.
TABLE 1 The performance of multivariate calibrations for analysis of PSO blended into EVOO
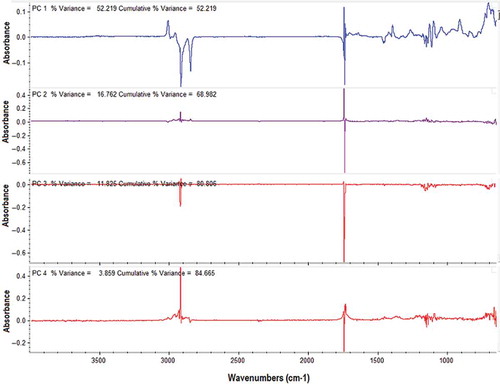
The relationship between actual (x-axis) and FTIR-predicted values (y-axis) of PSO blended into EVOO using FTIR normal spectra reveals the close relationship with R2 value of 0.999 and root mean square error of calibration (RMSEC) of 0.166%. The equation describing such relationship is y = 0.999x + 0.001. The root mean square error of prediction (RMSEP) obtained was 1.32%. From this result, it can be deduced that FTIR normal spectra combined with the PLS model offers the reliable and accurate technique for analysis of PSO mixed with EVOO. The factor or latent variable used during PLSR was 4 as shown in . This factor can describe 84.66% of FTIR spectral variance for modeling PLS model.
TABLE 2 The contents of major fatty acids in PSO blended into EVOO, as determined using GC–FID
FIGURE 3 The number of factor or latent variables used for modeling PLS calibration.
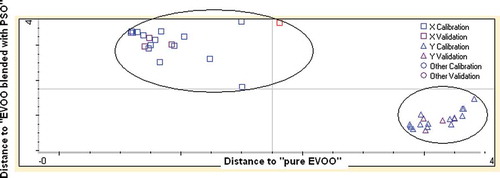
The classification of PSO blended with EVOO and pure EVOO was carried out using discriminant analysis (DA). DA is one of the supervised pattern recognition techniques widely used for grouping among samples. The frequency regions used for quantification was selected for DA. The samples were classified into two distinct groups, namely “pure EVOO” and “EVOO blended with PSO.” The Coomans plot describing such a grouping was created. Some samples of both groups were used as validation/prediction sets in order to evaluate the capability of chosen FTIR spectra regions to classify both classes. Based on the Coomans plot, DA can correctly make the classification between pure EVOO and that blended with PSO by an accuracy level of 100% (). This can mean that there is no mis-grouping encountered during DA. Sometimes, misclassification could take place because of the close similarity between two mixed oil samples.[Citation30]
FIGURE 4 The Coomans plot for the classification of EVOO and that mixed with pumpkin seed oil (PSO). (□) Pure EVOO; (Δ) EVOO blended with PSO.
Fatty Acid (FA) Analysis of PSO Blended into EVOO
Analysis of FA compositions seems to be a very useful technique for detection of EVOO blended with other vegetable oils like PSO.[Citation31] compiled the compositional percentages of selected major FAs in EVOO blended with PSO. Palmitic (C16:0), oleic (C18: 1), and linoleic (C18:2) acids were the main FAs in both EVOO and PSO. The percentages of palmitic acid in EVOO and PSO are 10.48 ± 0.12 and 11.58 ± 0.00%, respectively. Meanwhile, the FA contents of oleic acid in EVOO and PSO are 71.50 ± 1.15 and 32.51 ± 0.31%. This difference can be used to analyze EVOO blended with PSO.
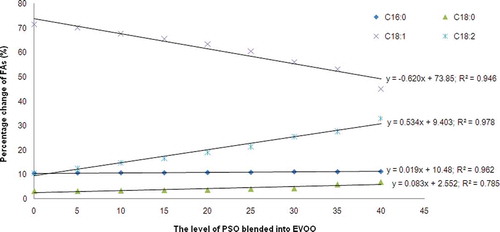
The linear regression for the relationship between the levels of PSO blended into EVOO (x-axis) and the percentage changes (y-axis) of palmitic, stearic (C18:0), oleic, and linoleic acids was shown in . The regression slopes for oleic and linoleic acids were higher than those of stearic and palmitic acids. Therefore, these two FAs can be useful markers for the identification of PSO blended into EVOO. The negative sign of slope in oleic acid can be understood that the level of this FA was decreased with the increasing level of PSO; in addition, the positive sign of slope for linoleic acid means that increasing level of PSO in EVOO will increase the concentration of linoleic acid. Using one-way analysis of variance (ANOVA), it is known that there was no significant difference observed between the blending of 0 and 5% PSO for oleic acid. Meanwhile, linoleic acid concentrations in all levels of PSO were significantly different (p < 0.05).
FIGURE 5 The percentage changes of main FAs during the blending of PSO with certain levels (0, 5, 10, 15, 20, 25, 30, 35, and 40% vol/vol) into EVOO.
CONCLUSION
The blending practice of PSO into EVOO could be detected using two combination techniques, namely, using FTIR spectral data and fatty acid composition. FTIR normal spectra at the combined frequency regions of 3020–2995 and 1070–900 cm−1 coupled with PLSR could be effective tools for the detection and quantification of PSO in EVOO. Furthermore, PSO blended into EVOO forms one distinct group with pure EVOO, as analyzed with discriminant analysis. The changes of FA composition during the blending of PSO can complement FTIR spectra data for such detection.
REFERENCES
- Maggio, R.M.; Cerretani, L.; Chiavaro, E.; Kaufman, T.S.; Bendini, A. A novel chemometric strategy for the estimation of extra virgin olive oil adulteration with edible oils. Food Control 2010, 21, 890–895.
- Park, Y.W.; Chang, P.-S.; Lee, J.H. Application of triacylglycerol and fatty acid analyses to discriminate blended sesame oil with soybean oil. Food Chemistry 2010, 123, 377–383.
- Lopez-Feria, S.; Cardenas, S.; Garcıa-Mesa, J.A.; Valcarcel, M. Classification of extra virgin olive oils according to the protected designation of origin, olive variety and geographical origin. Talanta 2008, 75, 937–943.
- Bendini, A.; Cerretani, L.; Carrasco-Pancorbo, A.; Gómez-Caravaca, A.M.; Segura-Carretero, A.; Fernández-Gutiérrez, A.; Lercker, G. Phenolic molecules in virgin olive oils: A survey of their sensory properties, health effects, antioxidant activity and analytical methods. An overview of the last decade Alessandra. Molecules 2007, 12, 1679–1719.
- Frankel, E.N. Nutritional and biological properties of extra virgin olive oil. Journal of Agricultural and Food Chemistry 2010, 58, 5991–6006.
- Al-Ismail, K.M.; Alsaed, A.K.; Ahmad, R.; Al-Dabbas, M. Detection of olive oil adulteration with some plant oils by GLC analysis of sterols using polar column. Food Chemistry 2010, 121, 1255–1259.
- Gómez-Ariza, J.L.; Arias-Borrego, A.; García-Barrera, T.; Beltran, R.; Comparative study of electrospray and photospray ionization sources coupled to quadrupole time-of-flight mass spectrometer for olive oil authentication. Talanta 2006, 70, 859–869.
- Chiavaro, E.; Vittadini, E.; Rodriguez-Estrada, M.T.; Cerretani, L.; Bendini, A. Diffrential scanning calorimeter application to the detection of refined hazelnut oil in extra virgin olive oil. Food Chemistry 2008, 110, 248–256.
- Fragaki, G.; Spyros, A.; Siragakis, G.; Salivaras, E.; Dais, P. Detection of extra virgin olive oil adulteration with lampante olive oil and refined olive oil using nuclear magnetic resonance spectroscopy and multivariate statistical analysis. Journal of Agricultural and Food Chemistry 2005, 53, 2810–2816.
- Mannina, L.; Marini, F.; Gobbino, M.; Sobolev, A.P.; Capitani, D. NMR and chemometrics in tracing European olive oils: The case study of Ligurian samples. Talanta 2010, 80, 2141–2148.
- Poulli, K.I.; Mousdis, G.A.; Georgiou, C.A. Synchronous fluorescence spectroscopy for quantitative determination of virgin olive oil adulteration with sunflower oil. Analytical and Bioanalytical Chemistry 2006, 386, 1571–1575.
- Mildner-Szkudlarz, S.; Jelen, H.H. Detection of olive oil adulteration with rapeseed and sunflower oils using MOS electronic nose and SMPE-MS. Journal of Food Quality 2010, 33, 21–41.
- Lerma-Garcia, M.J.; Ramis-Ramos, G.; Herrero-Martinez, J.M.; Simo-Alfonso, E.F. Authentication of extra virgin olive oils by Fourier-transform infrared spectroscopy. Food Chemistry 2010, 118, 78–83.
- De Luca, M.; Terouzi, W.; Ioele, G.; Kzaiber, F.; Oussama, A.; Oliverio, F.; Tauler, R.; Ragno, G. Derivative FTIR spectroscopy for cluster analysis and classification of morocco olive oils. Food Chemistry 2011, 124, 1113–1118.
- Ritz, M. Identification of origin of coal from the Ostrava-Karvina Mining District by infrared spectroscopy and discriminant analysis. Vibrational Spectroscopy 2007, 43, 319–323.
- Christy, A.A.; Egeberg, P.K.; Østensen, E.T. Simultaneous quantitative determination of isolated trans fatty acids and conjugated linoleic acids in oils and fats by chemometric analysis of the infrared profiles. Vibrational Spectroscopy 2003, 33, 37–48.
- Rohman, A.; Che Man, Y.B. Fourier transform infrared (FTIR) spectroscopy for analysis of extra virgin olive oil adulterated with palm oil. Food Research International 2010, 43, 886–892.
- Rohman, A.; Che Man, Y.B.; Ismail, A.; Puziah, H. FTIR spectroscopy combined with chemometrics for analysis of lard adulteration in some vegetable oils. Cyta–Journal of Food 2011, 9, 96–101.
- Rohman, A.; Che Man, Y.B. FTIR spectroscopy combined with chemometrics for authentication of cod liver oil. Vibrational Spectroscopy 2011, 55, 141–145.
- Rohman, A.; Che Man, Y.B. Authentication of extra virgin olive oil from sesame oil using FTIR spectroscopy and gas chromatography. International Journal of Food Properties 2012, 15, 1309–1318.
- Chippie, A.L.; Jamieson, P.R.; Golt, C.M.; Hsu, C.H.; Martin Lo, Y. Quantitative analysis of fat and moisture in mayonnaise using Fourier transform infrared spectrometer. International Journal of Food Properties 2002, 5, 655–665.
- Petrovic, M.; Kezic, N.; Bolanca, V. Optimization of the GC method for routine analysis of the fatty acid profile in several food samples. Food Chemistry 2010, 122, 285–291.
- Codex Alimentarius Commision. Amended. Codex standard for named vegetable oils. Codex Standard 210. Food and Agriculture Organization, WHO: Rome, Italy, 2003.
- Rohman, A.; Che Man, Y.B. Monitoring of virgin coconut oil (VCO) adulteration with palm oil using Fourier transform infrared spectroscopy. Journal of Food Lipids 2009, 16, 618–628.
- Sherazi, S.T.H.; Talpur, M.Y.; Mahesar, S.A.; Kandhro, A.A.; Arain, S. Main fatty acid classes in vegetable oils by SB-ATR-Fourier transform infrared (FTIR) spectroscopy. Talanta 2009, 80, 600–606.
- J.N. Miller; J.C. Miller. Statistics and Chemometrics for Analytical Chemistry, 5th Ed.; Pearson Education Limited: Edinburgh Gate Harlow, England, 2005; 213–239.
- Che Man, Y.B.; Rohman, A.; Mansor, T.S.T. Differentiation of lard from other edible fats and oils by means of Fourier transform infrared spectroscopy and chemometrics. Journal of the American Oil Chemists’ Society 2011, 88, 187–192.
- Vlachos, N.; Skopelitis, Y.; Psaroudaki, M.; Konstantinidou, V.; Chatzilazarou, A.; Tegou, E. Applications of Fourier transform-infrared spectroscopy to edible oils. Analytica Chimica Acta 2006, 573–574, 459–465.
- Koca, N.; Kocaoglu-Vurma, N.A.; Harper, W.J.; Rodriguez-Saona, L.E. Application of temperature-controlled attenuated total reflectance-mid-infrared (ATR-MIR) spectroscopy for rapid estimation of butter adulteration. Food Chemistry 2010, 121, 778–782.
- M.A. Manaf; Che Man, Y.B.; Hamid, N.S.A.; Ismail, A.; Syahariza, Z.A. Analysis of adulteration of virgin coconut oil by palm kernel olein using Fourier transform infrared spectroscopy. Journal of Food Lipids 2007, 14, 111–121.
- Christopoulou, E.; Lazaraki, M.; Komaitis, M.; Kaselimis, K. Effectiveness of determinations of fatty acids and triglycerides for the detection of adulteration of olive oils with vegetable oils. Food Chemistry 2004, 84, 463–474.