
Abstract
The aim of this work was to develop an aromatic lexicon for evaluating different soymilks with two descriptive methods and an instrumental assistance. A list of 20 terms was generated by eight trained panelists through gas chromatography olfactometry and mass spectrum with free choice profiling for three different soymilk samples. During this phase, panelists randomly used words they were familiar with to evaluate the aroma they experienced and then make an agreement on these terms. Data were analyzed via generalized procrustes analysis, two-way ANOVA, and high-frequency analysis to select the most suitable terms. Based on the above list, 14 panelists evaluated the three soymilk samples with citation frequency profiling. The panelists chose the terms from the list that they considered as the most appropriate way to describe the samples. The data were analyzed by corresponding analysis to verify the performance of the panel and chi-square (χ2) analysis to determine the discriminate descriptors, including mushroom, cardboard, beany, porridge, and bean fragrance. Accordingly, the five terms consisted of the aromatic lexicons in soymilks in the present work, which were different from previous studies.
INTRODUCTION
Worldwide soy food consumption has been increasing rapidly in recent years with the proliferation of knowledge on the health benefits of traditional soy foods in preventing such diseases as cardiac problems, menopausal syndromes,[Citation1,Citation2] certain cancers, etc. Different kinds of food commodities can be rapidly developed from soybean, and soymilk is one of the most popular products. However, in comparison with milk samples, soymilk is less acceptable by consumers.[Citation3] Therefore, in order to absorb more consumers, it is essential to investigate its specific aroma,[Citation4] which is the main factor for limited consumption and which is one of the important food properties proposed by Rahman and McCarthy.[Citation5] So far, there have been numerous investigations reporting the generation mechanism, the identification with gas chromatography-mass spectrometry (GC-MS), the technique of odor removal for the aromatic components in soymilk.[Citation4,Citation6,Citation7] Besides, many researchers in the past were dedicated to developing descriptive lexicons for a multitude of soymilk samples with their trained panelists’ evaluations. Torres-Penaranda and Reitmeier[Citation8] created a list of the specific ‘beany’ flavors, including raw, starch, and sweet. N’Kouka et al.[Citation9] listed seven aroma attributes for their laboratory-prepared soymilk (roasted soy, starchy, cooked milk, bran, caramel, malty, and vanilla). More recently, Chambers et al.[Citation10] investigated a wide range of ‘fresh’ and ‘ready to drink’ samples to develop many descriptors, which were similar to most of the previous two lexicons. However, the panelists in these studies developed a set of descriptors to characterize the soymilks, but did not concentrate on the aroma of soymilks. When it comes to human sensitivity to identify these aromas or flavors, humans have great difficulty on discriminating so many aromas for a mixture.[Citation11,Citation12] Some researchers reported that odor interaction in a complex mixture is to some degree dependent upon the odorants contained, as these individual odorants contribute to the overall aroma of the mixture.[Citation12]
Gas chromatography olfactometry (GC-O) has been extensively used in aroma research. GC-O permits the determination of the individual contribution of volatile compounds present in samples.[Citation13] Boatright and Lei[Citation14] used GC-O to evaluate major aroma from the headspace of aqueous solutions for soy protein isolates. However, the individual component in the mixture did not contribute equally to the overall perceived quality of complex mixtures and small changes in the interactions among components creating different odors, implying that reevaluation was essential.[Citation12]
Descriptive analysis is a primary tool involving both qualitative and quantitative evaluation on sensory characteristics of products by a trained panel. Sensory scientists have developed several descriptive methods. In this work, free-choice profiling (FCP) and citation frequency-based profiling (CFP) were employed to evaluate the sensory characteristics of soy products. FCP is a specific methodology in which each panelist produces their own descriptive profiles for the products to help yield many important descriptors. In order to apply these terms for the mixture in the product and considering the difficulty of assessing the aromatic intensities, CFP technique, another descriptive method, could be utilized to describe the product with the most pertinent descriptors from the terms. Campo et al.[Citation15] used this approach to describe the aromatic characteristics of a complex product (Burgundy pinot noir wine). They suggested that CFP might be a convenient alternative to conventional descriptive analysis to define the aroma in a complicated aromatic product. Accordingly, in light of these methods, it was reasonable to use the result of CFP to differentiate soymilk samples and determine a list of aromatic descriptors for them.
MATERIALS AND METHODS
Sample Preparation
Three types of soymilk with different processes, namely, raw soymilk, cooked soymilk, and soymilk with cooked bean (samples A, B, C, respectively) were assigned and prepared to provide a wide range of sensory variability in order to stimulate the generation of terms by panelists and to be determined as references for evaluating soymilk and soy products, such as dried beancurd.[Citation16] All soybeans were soaked in water at 25°C for 8 h. For sample A, soaked bean was milled directly. In the case of sample B, the soaked matter was first milled to soymilk and then cooked. Sample C was prepared by cooking the soaked beans and subsequently milling. All samples were assigned three-digital codes during examination by any panelist.
SPME (Solid-Phase Micro-Extraction) and GC-MS-O Analysis
SPME analysis
Eighty-five micrometers of carboxen-polydimethylsiloxane (CAR-PDMS)[Citation17] was purchased from Supelco Company (Bellefonte, PA, USA). The fiber was preconditioned in the injection port of a gas chromatograph according to the instructions provided by the supplier, prior to analysis. During extraction of flavor components, the needle was pierced through the septum of the sample container and pressed down to expose the headspace of fiber for analyte adsorption. The fiber was then retracted into the needle and ejected to the sample vial prior to being inserted into the GC injector port for analytes desorption onto the column.[Citation18]
GC-MS-O analysis
GC-MS protocol was from Finnign equipped with an electronic impact ionic source (EI, 70 eV) and DB-WAX column (30 m × 0.25 mm with a 0.25-μm film thickness). The injector port was operated in a splitless mode at 250°C. The initial air flow rate was set at 0.8 mL/min using ultrahigh-purity helium. For each run, the sample from the SPME fiber was desorbed in a GC instrument, which was operated at 45°C thermally for 3 min with an increase at 5°C/min to 70°C, followed by 10°C/min to 230°C for 7 min. Data for the standard set was collected on a MicrosoftTM computer running XcaliburTM software (Version1.1, Finnigan Corp.) with Wiley libraries (Palisade Corp., Newfield, NY, USA) and NIST libraries to identify the compounds. Levels of flavor components were determined from an average of three replicate chromatograms, calculated and expressed as area units of their abundance (total area counts, TAC). GC effluent was combined with a stream of humidified olfactometer air (7 l/min, 1 cm in diameter) and presented to the panelists.
GC-O and Free-Choice Profiling
Panelists
Eight students were recruited, including six females and two males. They all took a course in sensory evaluation for a semester and participated in our training and selection in accordance to the standards ISO 8586-2,[Citation19] ISO 5496,[Citation20] and ISO 4121.[Citation21] These previous experiences could make them more discriminative.[Citation22]
Methodology
There were two sessions for FCP profiling for each sample. In the first session, eight panelists evaluated samples with positioning in front of a sniffing port during the analysis (30 min) and sniffing the effluent from the column. The descriptors that panelists developed and the intensity of each descriptor on a nine-point scale was recorded by the panel leader on paper ballots for each panelist. The scale was anchored with the terms ‘weak’ on the left and ‘strong’ on the right. In the second session, eight panelists were asked to check their own list and discussed to refine, add, and/ or remove descriptors in order to establish a more appropriate representation of their olfactory experiences.[Citation18]
Data analysis
Generalized Procrustes Analysis (GPA) running on PanelCheck V1.3.20[Citation23] was applied to check the similarities of different samples and their most relative characteristics.[Citation24] Then, ANOVA was used to investigate the significant differences of each descriptor among the three samples. Moreover, descriptors with high frequencies could be picked out and the selected standard is that the descriptor was used to evaluate at least two of the three samples more or equal to a medium level (4 times). Consequently, a list of 20 terms would be produced.
Citation Frequency Profiling
Panelists
A total of 14 students were recruited on the basis of their interests and their availability including the above 8 panelists in the FCP experiment. They all attended the 12 training sessions. Training improved agreement among panel members on the attribute ratings.[Citation25]
Panel training
There were two phases to accomplish the training:[Citation15] aromatic standards and product specific training. The first phase consisted of eight sessions, and each session lasted approximately 20 min. In order to strengthen panelists’ familiarization with the list of 20 terms obtained through the analysis of the above experimental data, during the first phase panelists received some aromatic standards for terms on the list and familiarized them again and again. Meanwhile, they discussed the suitability between these standards and the list of 20 terms and then made some necessary modifications for the standards. For the second phase of four sessions, we prepared three commercial samples of soymilks for the panel with 3-digit codes. Panelists evaluated the samples with the terms they had familiarized, and also they could add some new terms they considered appropriate and pertinent.
Methodology for evaluating the three samples of soymilks
The trained panel with 14 panelists was provided with the list of 20 terms and the three different samples (A, B, and C) with 3-digit random codes, and they were told to choose a maximum of four terms that they considered were the most appropriate and relevant to describe the three kinds of soymilk processed. The maximum number was determined according to a previous investigation that only three or four components of a complex mixture could be discriminated and identified and that affluent training and professional experience could not increase this capacity.[Citation11,Citation26] Each panelist had to evaluate the three samples in duplicate. After finishing the sessions, all data were collected and all 20 terms were ranked according to their citation frequency (CF) percentage to identify the most relevant terms of each soymilk. Only available terms cited by a minimum of two judges (15% of the panel) in at least one sample/repetition were considered for subsequent statistical analyses.[Citation27]
Data Analysis
Analysis of panel performance
To illustrate overall reproducibility of the panel, the projection of soymilk replicates on the two-dimensional correspondence analysis (CA) map was used. For CA, a contingency table (soymilks in rows and descriptors in columns) should be constructed containing the average citation frequency (2 repetitions and 14 judges) of the available terms. Then, to assess the individual performance, an average reproducibility index (Ri) was calculated for each of the panelists in Eq. (1):
Analysis of discriminant terms
To look for discriminant terms, CF of each term will be analyzed by univariate analysis. A chi-square (χ2) analysis performed on the average CF (two repetitions) of each term in the three soymilks was carried out. Both CA and chi-square (χ2) analysis were performed with SPSS software (version 16.0).
RESULTS AND DISCUSSION
In this work, there were three types of soymilk characteristics of different aromas. Different processing methods bring about different aromas for soymilks.[Citation28] Flavor compounds in soymilk generated from traditional technologies, i.e., hot water grinding and roast processing, were analyzed and results showed that the flavor characteristics by sensory description were different.[Citation25] Comparing with other studies, the three samples are more representative through three different processing techniques covering from raw soymilk to processed soymilk, which made the samples typical of soy products and suitable for evaluating a multitude of soy-containing products.
TABLE 1 Compounds for three kinds of soymilk and relevant aroma descriptors.a
Analysis of GC-MS-O with Free-Choice Profiling
A total of 50 flavor-active compounds were identified for all of the three soymilk samples by GC-MS. lists the main volatile compounds and corresponding aromatic descriptors provided by eight panelists. It suggested the major constituents—the dominant contributions to the overall aroma in the three samples were similar. Additionally, the flavor compounds of this study are in good agreement with previous investigations,[Citation17,Citation29] where it was reported that the main components, such as hexanal, heptanal, 1-heptanol, 1-octen-3-ol, decanol, and some others with fewer contents, were flavor-active compounds of the soymilk. Relatively speaking, among these flavor compounds, n-hexanal, 1-hexanol, and 1-penten-3-ol etc., are unacceptable to consumers because they impart some raw aroma, like herbal, wheat, earth, grassy; 1-octen-3-ol, 1-pentanol, 2-pentenal, etc. contribute to fruity or bean fragrance. However, in view of variable heat treatments given to soymilk, no thermal processing, after extraction and subsequent cooking, some components are different; for instance, the aldehydes in raw soymilk is more than the other two and some special chemicals, such as 3-octanone and 2, 3-pentanaedione, occur in cooked soymilk. In addition, as to the major constituents, the concentrations in the three samples are different, and as a result, the aroma provided by the panelists are reasonably different, which has been reported by Le Berre et al.[Citation30] Compound concentration has a great influence on odorant threshold and chemical compounds on different levels result in different aromas; besides that, different terms are used by different people to characterize the same flavor and aroma, which leads to the wide diversity of flavor descriptor.[Citation31] Thus, it could affirm that the list of descriptors developed by the panel is effective.
Analysis of Free-Choice Profiling
GPA analysis for free-choice profiling
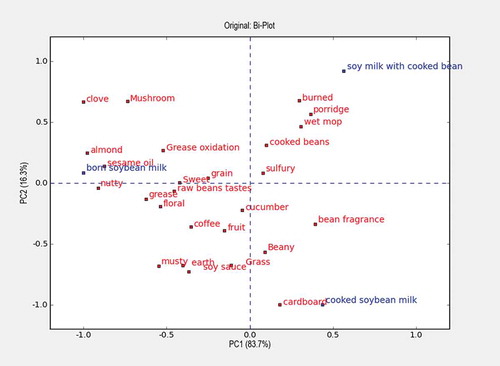
Through GPA analysis over the sensory profiles, the variance accounting for the first two components was 100%. However, in view of the low coefficients between some descriptors and the two principal components, these descriptors were deleted and showed the relationship between the three samples and the important descriptors, which were provided by more than two assessors. The results obtained revealed cooked soymilk and soymilk with cooked bean locating in the positive area of the first dimension and, conversely, raw soymilk in the negative area of the first dimension. Besides, also confirmed this point, which indicated the correlation coefficients between the three samples and the first two components. For further analysis, raw soymilk was mainly defined by sesame oil, nutty, which were more like raw material; in contrast, soymilk with cooked bean was mainly defined by porridge, cooked bean. This result was almost in accordance with a previous research, which reported that different methods to process soymilk would lead to significant differences in the composition, physicochemical, and sensory characteristics.[Citation28] Reasonably, it could be demonstrated that the panelists could detect the differences among the three samples, implying that their evaluation was effective.
TABLE 2 Correlation coefficient over the three samples with the first two components
FIGURE 1 Consensus space obtained using generalized procrustes analysis (GPA) over the selected sensory profile of GC effluents.
Mixed model (two-way) ANOVA
Mixed model (two-way) ANOVA can be used for assessing the importance of the used sensory attributes by detecting significant differences between the samples.[Citation23] Through two-way ANOVA measure, differences on mushroom, sesame oil, clove, nutty, porridge, and almond among the three samples were statistically significant (P < 0.05). In a further experiment, these descriptors would be considered as a part of the original resources for the list of terms provided to panelists.
Frequencies of different descriptors for each sample in free-choice profiling
Descriptors with high frequencies could be picked out according to the selected standard, where the descriptor was used to evaluate at least one of the three samples for more or equal to four times. showed that there were 18 descriptors fitting the standard. They were grain, sweet, grassy, mushroom, beany, cooked beans, sesame oil, earth, yeasty, bean fragrance, grease, musty, almond, raw beans, cardboard, sulfury, clove, and fruit. Consequently, these descriptors possibly worked when describing the overall aroma of soymilks as the mixture of these components was similar to the original product.[Citation32] Thus, they could be considered as a reliable resource for the list of terms for evaluating the contact soymilk samples in the next experiment. Following the results of the above analysis from 2.1 to 2.3, the list of terms for the next experiment, including mushroom, sweet, sesame oil, clove, nutty, porridge, almond, grain, grassy, beany, cooked beans, earth, bean fragrance, grease, musty, raw beans taste, sulfury, cardboard, and fruit, would be considered.
TABLE 3 Frequencies of descriptors used during free-choice profiling of the three samples*
Analysis of citation frequency profiling (CFP)
The GC-MS-O detection with free-choice profiling had shown almost all of the potentially most important odorants.[Citation33] However, they were only successful with careful and rigorous identification of odorant molecules;[Citation34] thus, further work should be performed to identify the complexity of aromatic compound interactions, which were the overall aroma in the three kinds of soymilks. In order to acquire the effective data, the first step should focus on the analysis of panel performance. Then, based on the data from CFP, it is available to further illustrate the discriminate descriptors for the three soymilk samples.
Panel Performance
Correspondence analysis (CA) to assess the panel performance
The overall panel reproducibility was explored using the projection of soymilk replicates on the two-dimensional CA map. As shown in , two repetitions for each sample were close to each other on the map. Taking into account that the two repetitions were operated in the afternoon and at night, respectively, it was acceptable that there was a slight difference between two repetitions. Thus, the panel could be assured of being reproducible. In addition, the good discriminant abilities for the whole panel could be seen according to , which presented that the three samples were clearly separated by the first two dimensions.
FIGURE 2 Projection of soymilk replicates on the two-dimensional correspondence analysis map. The two-digit number with the same first digit signified represented the same sample with two repetitions.
Reproducibility index (Ri) to assess individual performance
Concerning individual reproducibility, the reproducibility index (Ri) associated with a panelist allows for detection of how this panelist is performing, and the minimum Ri value for a qualified panelist was set at 0.5 in the present work. In a previous work, 0.2 was the critical value with which six odors from the list of 73 terms was selected for 46 samples (23 wines × 2 repetitions).[Citation27] Obviously, the evaluation was more challenging than the one in this work, so the critical value should be reasonably set higher than 0.2. The result suggested that maximum Ri was 0.92, which meant that for the panelist there were 92% of common terms between the two replicates. The minimum value was 0.5 and, consequently, the data of all the panelists could be available for the chi-square (χ2) analysis to determine discriminant terms.
Discriminant terms analyzed by chi-square (χ2) analysis
The most discriminant terms that resulted from chi-square (χ2) analysis according to the χ2 criterion are listed in . Data in the table illustrated five discriminant terms, including mushroom, cardboard, beany, porridge, and bean fragrance. These terms varied significantly among the three samples. It meant that for different soymilks the five aromatic descriptors could be experienced by14 panelists thoroughly and, thus, these five aromatic descriptors would be determined to form the sensory aromatic lexicon to enable differentiation among soymilks or other soy-containing products as shown in .
TABLE 4 Chi-square (χ2) analysis for discriminant terms on different confidence level
TABLE 5 Definitions and references with the maximum intensity (15 cm on scorecard) for each discriminant term
In this study, mushroom, cardboard, beany, porridge, and bean fragrance were finally employed to construct the aromatic lexicon, which was different from other soy lexicons. Terms common to both this research and others included cardboard and beany, however, mushroom, porridge, and bean fragrance did not show up in other studies,[Citation6,Citation10] such as cooked soy, cooked grain, raw soy, starchy, etc. employed by N’Kouka et al.,[Citation6] cardboard, butter rum, oats, wheat, rancid, and raw reported by Chambers et al.,[Citation10] and so forth.
The reason causing the differences possibly lies in the final lexicon originating from the step of GC-MS-O analysis with free-choice profiling by trained descriptive panelists, which could explore all potential aromas in soymilks, while the other studies just chose terms according to some previous researches or directly evaluated soymilks. Moreover, the samples of soymilk were different from the other studies, which did not cover from raw soy produts to cooked ones. Accordingly, the discriminant aromatic terms in this work would be more representative and widely useful for soybean products.
CONCLUSION
Soy products dictate more attention from the public, and the assessment of their odorants with common language is necessary to develop more satisfactory products. With the sophisticated GC-MS-O, the main components could be detected and the potential odor descriptors could be investigated. Moreover, the two no-intensity scale descriptive analysis helped to achieve a fine lexicon to define and characterize a wide range of soymilks. The list of the five aroma descriptors would be supposed to be beneficial and available for evaluating other soymilks or some other soy-containing products in the future. However, considering this project there were only three different kinds of soymilk with different processing methods; thus, it is not supposed to be exhaustive but is suggested to represent most of the terms found in soymilk products. It might be a little limited when it came to some other processing methods, which would produce some new components to spread more fresh aromas. Further work will focus on validating these terms on evaluating other soymilks or soy products by consumers.
REFERENCES
- Kurzer, M. Soy consumption for reduction of menopausal symptoms. Inflammopharmacology 2008, 16, 227–229.
- Tunde-Akintunde, T.Y.; Olajide, J.O.; Akintunde, B.O. Mass-volume-area related and mechanical properties of soybean as a function of moisture and variety. International Journal of Food Properties 2005, 8, 449–456.
- Beatriz, V.; Inmaculada, C.; Elvira, C. Effects of product information and consumer attitudes on responses to milk and soybean vanilla beverages. Journal of the Science of Food and Agriculture 2008, 88, 2426–2434.
- Kaneko, S.; Kumazawa, K.; Nishimura, O. Studies on the key aroma compounds in soy milk made from three different soybean cultivars. Journal of Agricultural and Food Chemistry 2011, 59, 12204–12209.
- Rahman, M.S.; McCarthy, O.J. A classification of food properties. International Journal of Food Properties 1999, 2, 93–99.
- N’Kouka, K.D.; Klein, B.; Lee, S.Y. Developing a lexicon for descriptive analysis of soymilks. Journal of Food Science 2004, 69, 259–263.
- Yuan, S.; Chang, S.K.C. Selected aromatic compounds in soymilk as affected by chemical composition and lipoxygenases in five soybean materials. Journal of Agricultural and Food Chemistry 2007, 55, 426–431.
- Torres-Penaranda, A.; Reitmeier, C. Sensory descriptive analysis of soymilk. Journal of Food Science 2001, 66, 352–356.
- N’Kouka, K.D.; Klein, B.; Lee, S.Y. Developing a lexicon for descriptive analysis of soymilks. Journal of Food Science 2004, 69, 259–263.
- Chambers, IV, E.; Jenkins, A.; McGuire, B.H. Flavor properties of plain soymilk. Journal of Sensory Studies 2006, 21, 165–179.
- Lawless, H.T. Descriptive analysis of complex odors: reality, model or illusion? Food Quality and Preference 1999, 10, 325–332.
- Livermore, A.; Laing, D.G. The influence of odor type on the discrimination and identification of odorants in multicomponent odor mixture. Physiology and Behavior 1998, 65, 311–320.
- Venkateshwarlu, G.; Mette, B.; Meyer, A.S.; Jacobsen, C. Chemical and olfactometric characterization of volatile flavor compounds in a fish oil enriched milk emulsion. Journal of Agricultural and Food Chemistry 2004, 52, 311–317.
- Boatright, W.; Lei, Q. Compounds contributing to the “beany” aromatic of aqueous solutions of soy protein isolates. Journal of Food Science 1999, 64, 667–670.
- Campo, E.; Ballester, J.; Langlois, J.; Dacremont, C.; Valentin, D. Comparison of conventional descriptive analysis and a citation frequency-based descriptive method for aromatic profiling: An application to Burgundy Pinot noir wines. Food Quality and Preference 2010, 21, 44–55.
- Kithel, M.K.; Anne, J.K.; John, B. Free-choice profiling of OR-17 agonists and homologues using GCO. Chemosens Percept 2008, 1, 235–241.
- Achouri, A.; Boye, J.I.; Zamani, Y. Identification of volatile compounds in soymilk using solid-phase microextraction-gas chromatography. Food Chemistry 2006, 99, 759–766.
- Allaoua, A.; Joyce, I.B.; Youness, Z. Identification of volatile compounds in soymilk using solid-phase microextraction-gas chromatography. Food Chemistry 2006, 99, 759–766.
- International Organization for Standardization (ISO). Sensory analysis—General guidance for the selection, training and monitoring of assessors—Part 2: Expert sensory assessors; BS ISO 8586-2; ISO: Geneva, Switzerland, 2008.
- International Organization for Standardization (ISO). Sensory analysis—Methodology—Initiation and training of assessors in the detection and recognition of aromatics; BS ISO 5496; ISO: Geneva, Switzerland, 2006.
- International Organization for Standardization (ISO). Sensory analysis—Guidelines for the use of quantitative response scales; BS ISO 4121; ISO: Geneva, Switzerland, 2003.
- Heymann, H. A comparison of free choice profiling and multidimensional scaling of vanilla samples. Journal of Sensory Studies 1994, 9, 445–453.
- Tomic, O.; Luciano, G.; Nilsen, A.; Hyldig, G.; Lorensen, K.; Naes, T. Analysing sensory panel performance in a proficiency test using the PanelCheck software. European Food Research and Technology 2010, 230, 497–511.
- Guàrdia, M.D.; Aguiar, A.P.S.; Claret, A.; Arnau, J.; Guerrero, L. Sensory characterization of dry-cured ham using free-choice profiling. Food Quality and Preference 2010, 21, 148–155.
- Roberts, A.K.; Vickers, Z.M. A comparison of trained and untrained judges’ evaluation of sensory attribute intensities and liking of cheddar cheese. Journal of Sensory Studies 1994, 9, 1–20.
- Livermore, A.; Laing, D.G. Influence of training and experience on the perception of multicomponent aromatic mixtures. Journal of Experimental Psychology: Human Perception and Performance 1996, 22, 267–277.
- Campo, E.; Do, B.; Ferreira, V.; Valentin, D. Aroma properties of young Spanish monovarietal white wines: A study using sorting task, list of terms and frequency of citation. Australian Journal of Grape and Wine Research 2008, 14, 104–115.
- Chinyere, I.I.; Kenneth, E.U. Chemical, physical and sensory characteristics of soymilk as affected by processing method, temperature and duration of storage. Food Chemistry 1997, 59, 373–379.
- Lv, Y.C.; Guo, S.T. Flavor characteristic of soymilk made by three different processing methods. Soybean Science 2010, 29, 494–497.
- Le Berre, E.; Beno, N.; Ishii, A.; Chabanet, C.; Etievant, P.; Thomas-Danguin, T. Just noticeable differences incomponent concentrations modify the odor quality of a blending mixture. Chemical Senses 2008, 33, 389–395.
- Flores, M.; Grimm, C.C.; Toldra, F.; Spanier, A.M. Correlations of sensory and volatile compounds of Spanish “Serrano” dry-cured ham as a function of two processing times. Journal of Agricultural and Food Chemistry 1997, 45, 2178–2186.
- Escudero, A.; Gogorza, B.; Melus, M.; Ortin, N.; Cacho, J.; Ferreira, V. Characterization of the aroma of a wine from Maccabeo. Key role played by compounds with low aromatic activity values Journal of Agricultural and Food Chemistry 2004, 52, 3516–3524.
- Ferreira, V.; Ortín, N.; Escudero, A.; López, R.; Cacho, J. Chemical characterization of the aroma of Grenache rose wines: Aroma extract dilution analysis, quantitative determination, and sensory reconstitution studies. Journal of Agricultural and Food Chemistry 2002, 50, 4048–4054.
- Francis, I.; Newton, J. Determining wine aroma from compositional data. Australian Journal of Grape and Wine Research 2005, 11, 114–126.