
Abstract
The impact of ionic strength on surface hydrophobicity, solubility, and spatial structure of soy protein isolate were investigated in this article. Surface hydrophobicity was found to be negatively correlated with its solubility as ionic strength increased. The changes in spatial structure of soy protein isolate accounted for the increased surface hydrophobicity caused by ionic strength. Specifically, changes in secondary structures by increased ionic strength were mainly reflected in the increased random coil and decreased α-helices content, which suggested that ionic effects may loosen the protein structures and result in the modification of surface amino acid distribution. This is further verified by the shifted λmax in fluorescence spectra of tryptophan and relative high I850/I830 value in Raman spectra, which was an indicator of the exposure degree of tyrosine residues on the surface of the protein. In addition, the changes in vibration modes of disulfide bonds reflected by Raman spectra also support the impact of saline on the surface hydrophobicity and structure of soy protein isolate. It is believed that these findings could be helpful to understand the impact of salinity on the surface hydrophobicity of soy protein isolate as well as to predict the other functional characteristics of soy protein isolate in system.
INTRODUCTION
Proteins are biological macromolecules composed of polypeptide chains folded into spatial conformations. These spatial conformations, or structures, are commonly divided into four types: primary, or the amino acid sequence; secondary, the specific local amino acid arrangement within the chain; tertiary, the longer range organization of a polypeptide; and quaternary, which relates to domain organization of more than one polypeptide. One of the most important forces that sustain the tertiary structure of proteins is the interaction between hydrophobic groups, particularly within the molecules ‘core’ or hydrophobic region. Hydrophobic interaction is a type of non-covalent bond between ligands, and its exact chemical and physical properties and reactivity in vivo are still far from fully understood. Generally speaking, most nonpolar amino acid side chains are buried inside a protein molecule in water forming hydrophobic core(s), and polar amino acids are distributed in hydrophilic environments on the protein surface.[Citation1,] Analyses of the surface properties of proteins with known structures have shown that some hydrophobic groups may also be located on the protein surface and affect the protein’s surface hydrophobicity. Hydrophobic interactions are essential to the stability, conformation, and function of proteins, and surface hydrophobicity affects the interactions between different protein molecules. Therefore, this specific characteristic may be even more important to the protein function than overall hydrophobicity.[Citation2] The surface hydrophobicity of a protein can be used as an indicator of the ability of molecules to interact with each other.
Elucidation of the parameters of soybean protein isolate (SPI) functionality at a molecular level has been explored by several researchers.[Citation3−Citation7] Meanwhile, surface hydrophobicity of SPI has always been used to predict functional properties, such as emulsification, solubility, foaming capability, and adhesion, for it has a strong relationship with these functionalities. Kato and Nakai[Citation8] reported that better correlations with protein functionality were obtained when hydrophobic parameters were used than when using solubility alone. Surface hydrophobicity exhibited by proteins is a physicochemical property that determines, to a great extent, the tendency of protein molecules to aggregate and lose solubility.[Citation9] Boatright and Heltlarachchy[Citation10] reported increased protein solubilities due to the addition of antioxidants, which were accompanied by higher total protein surface hydrophobicity and soluble protein hydrophobicity. Significant correlations were also found for emulsifying capacity, emulsion stability, and fat binding capacity of heat-denatured proteins with surface hydrophobicity and solubility. For the foaming capacity of protein, its exposed hydrophobicity and viscosity played important roles.[Citation11] In different protein samples, a positive relationship between the flocculation-creaming rate constant and equilibrium oil volume fraction of emulsions with surface hydrophobicity was detected.[Citation12] Hettiarachchy et al.[Citation13] reported alkali-modified soy protein adhesives with high hydrophobicities enhanced water-resistance properties. Water-resistance properties of SPI films presented a close relationship with surface hydrophobicity.[Citation14] Wang et al.[Citation15] pointed out that increasing surface hydrophobicity, due to the unfolding of a heated protein accompanied by the formation of aggregates linked by disulfide bonds, may lead to a lower surface pressure at long-term adsorption and similar dynamic interfacial rheology. Exploring the surface hydrophobicity may be an important step in adjusting the functions and properties of a protein at the molecular level.[Citation16]
Surface hydrophobicity is a structure-related function, dependent on the size and shape of protein molecule, amino acid composition, and sequence, as well as any intramolecular or intermolecular cross-links.[Citation17−Citation19] Though previous research on interfacial properties and function, such as foaming and emulsification, have given some information on surface hydrophobicity from a structural prospective, the relationship between spatial conformations and surface hydrophobicity remains to be clearly defined.
NaCl and CaCl2 salts are extensively used as additives along with soy protein to enhance emulsification, gelation, and water and lipid retention in meat products, allowing the desired texture to be achieved.[Citation20] In a single-protein system, an increase in the salinity of the system can decrease the electrostatic repulsion between protein molecules and, thus, increase the final gel strength.[Citation21] Protein-protein interactions usually increase as the electrostatic charges on the molecules decrease. For example, adjusting the pH value of a protein solution to the isoelectric point can lead to zero electrostatic charge on protein molecules and, thus, cause precipitation.[Citation22] The electric shield generated by monovalent or bivalent ions among charged protein molecules can also promote interaction between the proteins.[Citation23] However, how the surface hydrophobicity of SPI responds to increased salinity is still not clear. To give a deeper understanding on the relationship between surface hydrophobicity and spatial conformation subjected to ionic strength, circular dichroism (CD), fluorescence, and Raman spectrometry were used to measure the changes in secondary and tertiary structure of SPI. The relationship between surface hydrophobicity and solubility in saline was also discussed in this study to give a new perspective to the elucidation of soybean protein functionality.
MATERIALS AND METHODS
Preparation of SPI
Defatted soy flour, Dongnong-46, was provided by the Soybean Research Center of Northeast Agricultural University (Harbin, Heilongjiang, China). Proteins were extracted from defatted soybean meal by making a slurry with 10-fold volumes of water adjusted to pH 8.0 with 2 mol/L NaOH. The solution was then centrifuged at 10000× g for 30 min after the alkaline extraction performed under magnetic stirring for 3 h. The pH value of the supernatant was adjusted to 4.5 using 2 mol/L HCl, and then centrifuged at 10000× g for 30 min. The precipitate obtained was dialyzed against deionized water for 48 h at 4°C. The protein precipitate was neutralized to pH 7.0 with 2 mol/L NaOH, frozen with liquid nitrogen, and freeze-dried. The final SPI product had a protein content of 86.31 ± 1.24% as determined by the Kjeldahl method (N × 5.8).[Citation24]
Preparation of Buffers of Different Ionic Strengths
The desired ionic strengths (I = 0, 0.1, 0.2, 0.3, 0.4, 0.5, or 0.9) were achieved by addition of NaCl to pH 7.6 sodium phosphate buffer solution at 20°C according to the following equation:
Solubility Measurement
One hundred milligrams of protein samples were mixed with 10 mL of sodium phosphate buffer solution with different ionic strengths, adjusting the pH value with 1 mol/L NaOH or HCl if necessary. After 30 min of stirring, the solution was centrifuged at 12000× g for 20 min at 20°C. Crude protein content in the supernatant was determined by using the Lowery method[Citation25] with bovine serum albumin as standard. Solubility was expressed as the percentage of original protein present in the supernatant.
Measurement of Surface Hydrophobicity
1-Anilinonaphthalene-8-sulfonic acid (ANS) fluorescence was used to measure the surface hydrophobicity.[Citation8] The samples were prepared in 0.01 mol/L sodium phosphate buffers with different ionic strengths at a protein concentration of 10 mg/mL. The solutions were homogenized for 1 min and then centrifuged at 8000× g for 20 min. The supernatant was collected and the Lowry method was used to measure the soy protein concentration. Next, the supernatant was subjected to a serial dilution in 0.01 mol/L phosphate buffer (pH 7.6) to make sample solutions of different concentrations. In 10 mL of each sample solution, 50 μL 8 mmol/L ANS solution was added and mixed well by oscillation. Each solution was then allowed to settle for 10 min. The fluorescence intensity (FI) of the sample solution was measured at 330 nm (excitation) and 490 nm (emission) using a F4500 fluorescence-spectrophotometer (Hitachi Co., Japan). FI versus protein concentration was plotted, and the slope of the initial segment served as the surface hydrophobicity index.
CD Spectroscopy
CD spectroscopy in the far ultraviolet region was used to study the influence of ionic strength on the secondary structure of the protein. Protein samples were weighed and dissolved in buffers with different ionic strengths to a concentration of 0.4 mg protein/mL. Each sample was placed at room temperature for 4 h and its pH was monitored. A Jasco-815 CD spectrometer (Jasco Co., Japan) was used to scan between 200 and 250 nm, and the experimental temperature was 20°C. The optical length of the sample cell was 1 mm, sensitivity 100 mdeg/cm, scan speed 100 nm/min, and resolution 0.1 nm. Each scan was performed five times and the mean was calculated from the experimental data. The software package ‘CDPro’ (Jasco Co., Japan) was used to model the secondary structure of the protein and ‘CONTIN/LL’ was adopted as the algorithm.[Citation26] The mean residue weight (MRW) of the protein was 115 g·mol−1. The range of wavelength calculation was 200–240 nm. Each sample was measured three times.
Fluorescence Spectroscopy
An F-4500 fluorescence spectrophotometer (Hitachi Co., Japan) was used to measure the fluorescence spectrum of SPI. Protein dispersions (0.2 mg/mL) were prepared in 0.01 mol/L phosphate buffer (pH 7.6). The excitation wavelength was 295 nm, and the emission spectra were recorded from 300 to 400 nm at a constant slit of 5 nm for both the excitation and emission slits. Each scan was performed five times.
Raman Spectroscopy
The SPI was dispersed in corresponding ionic strength buffers to make 100 mg/mL solutions for Raman experimentation. The excitation wavelength was 785 nm, the emission power was 300 mW, and the range of Raman spectra measured was 400–2000 cm−1. Each sample was scanned at least three times, and the Raman spectra of each sample was plotted after calculating the mean. Errors in peak position were less than ±3 cm−1. The calibration and allocation of Raman spectra baseline was performed using OMINIC software (Nicolet Co., USA). The internal standard for normalization was the 1004 cm−1 of phenylalanine, which was used as a basis for measuring the intensity change of different Raman peaks. The quantitative calculation of the secondary structures of the SPI Raman spectra was performed using the Grams/AI (Thermo Electron Co., USA) software, based on the second derivative Raman spectra. Origin 8.0 software (OriginLab Co., USA) was used to fit the spectra in studying vibration modes of disulfide bonds.
Statistical Analysis
Each treatment was performed in at least triplicate. Statistical analysis was carried out using SAS 8.12 software. Results were subjected to a one-way analysis of variance according to the general linear model procedure with least squares means effects, and a Duncan multiple range test with a confidence interval of 95% was applied, if necessary.
RESULTS AND DISCUSSION
Solubility and Surface Hydrophobicity Profile of SPI at Different Ionic Strengths
shows the ionic strength effects on solubility and surface hydrophobicity of SPI. The solubility profiles exhibited the salting-out phenomena starting at low salt concentrations (I = 0.1), and leveled off at 0.3–0.5. At ionic strengths over 0.5, a steep salting-out effect was observed. Meanwhile, the surface hydrophobicity of SPI tended to generally increase with the ionic strength. NaCl affected the surface hydrophobicity and solubility mainly by two mechanisms: (1) salts reduce the electrostatic repulsion between droplets through electrostatic screening, and (2) high concentrations of electrolytes alter the structural organization of water molecules, which alters the strength of the hydrophobic interactions between nonpolar groups.[Citation27]
FIGURE 1 Solubility and surface hydrophobicity profile of SPI at different ionic strengths.
By comparison with the solubility profile, the surface hydrophobicity was negatively correlated with solubility at different ionic strengths. It has been shown that there are relatively few hydrophobic residues on the surfaces of highly soluble proteins.[Citation26] Shigeru and Shuryo[Citation28] showed that surface hydrophobicity correlated well to the protein insolubility determined at zero zeta potential. The solubility of the protein depends on the hydrophilicity/hydrophobicity balance of protein molecules and the amino acids composition exposed to the surface of the protein.[Citation29] More hydrophobic residues, such as those of leucine and isoleucine, which transfer from the hydrophobic region to the surface of the molecule, may alter the amino acids’ composition and weaken the interaction with water molecules; then the surface hydrophobicity of the protein increases while its solubility decreases.
Effects of Ionic Strength on the Tertiary Structure of SPI
Fluorescence spectroscopy is a well-established technique to observe protein conformational changes under different micro-environmental conditions. In soy protein, two aromatic amino acid residues, tryptophan (Trp) and tyrosine (Tyr), make the major contribution to the ultraviolet fluorescence of protein. As the energy transfer from tyrosine residues to tryptophan residues leads to quenching of the fluorescence of tyrosine residues and enhancement of the fluorescence of tryptophan residues, it is generally accepted that protein fluorescence results mainly from the fluorescence of Trp residues. The peak position is between 325–350 nm.[Citation30]
shows the fluorescence spectra of SPI when present in the various ionic strength solutions. Compared to the control sample, the saline solution generally decreased the fluorescence intensity (FI) regardless of ionic strength. In view of sensitivity of the indole group of tryptophan to solvent polarity, the fluorescence spectrum of a protein is not only determined by the chemical environment around it, but also by the degree of exposure of hydrophobic tryptophan residue subjected to various ionic strengths. The change in relative abundance of Trp residues indicated the modification of spatial structure by the saline solution. The decreased FI should be ascribing to fluorescence quenching by interaction of strongly hydrated cations with the polar protein surface. In addition, increased intermolecular hydrophobic interactions and interchain aggregation linked by disulfide bridges, could appear under high ionic strength conditions (evidenced by the latter Raman spectroscopy) and may be responsible for the quenched tryptophan fluorescence. High ionic strength was proven to facilitate the formation of a disulfide bond and modify its conformation,[Citation31−Citation33] which is known as an efficient quencher of tryptophan fluorescence.[Citation34]
TABLE 1 Fluorescence intensity and λmax of SPI at different ionic strengths
In addition, apart from FI, the tertiary structure change of protein also could be evaluated by an analysis of the position of the fluorescence emission maximum (λmax). The conformational change of soy protein indicated by λmax and FI are listed in . Results show that the λmax for natural SPI (I = 0) is 337 nm, which is characteristic of the fluorescence profile of tryptophan residues in a relatively hydrophobic environment,[Citation35] while most λmax for test groups fluctuated with values ranging from 335–338 nm. In this study, λmax generally shifted to longer wavelengths as ionic strength increased from 0.4 to 0.9, suggesting that progressive salt addition resulted in the shift of the Trp microenvironment towards the hydrophilic.[Citation35] The redshift of λmax can be understood as follows: high concentrations of strongly hydrated cations induced a transformation from free water to hydration water, which influenced the arrangement of a hydration layer of protein and more hydrophobic groups exposed with the rearrangement of the hydration layer, leading to increases in surface hydrophobicity.[Citation27] The sharp increase in λmax at 0.2 ionic strength seems special, because an increased solubility and a low surface hydrophobicity were observed, which was inconsistent with a previous study.[Citation35] Here, absorbed hydration on the protein enhanced electrostatic repulsive force, so that solubility of the protein increased, but the electrostatic interaction may also weaken ionic bonds, one of the important forces needed to sustain the tertiary structure of the protein; that may be one possible reason for the low surface hydrophobicity.
Effects of Ionic Strength on the Secondary Structure of SPI
The far-ultraviolet CD spectra of SPI at different ionic strengths are shown in and . SPI showed a negative shoulder peak at 218 nm and two negative grooves at 207 and 222 nm. In addition, there was a very weak positive peak between 220 and 230 nm. The negative shoulder peak at 218 nm shows the existence of the β-sheet structure in SPI, whereas the two negative grooves at 207 and 222 nm may arise from the negative Cotton effect caused by α-helix structure. The weak positive peak between 220 and 230 nm indicates that there is unordered structure in the protein. Therefore, it can be concluded that four types of secondary structures exist in SPI: α-helices, β-sheets, ‘unordered structures’,[Citation26] and connecting turn structures (such as β-turns). The secondary structure was estimated using the CONTIN/LL algorithm, which was provided by Jasco Corp. and originated from the method described by Sreerama et al.[Citation26] The estimated secondary structure content is shown in .
TABLE 2 Quantitative estimation of the secondary structure of SPI by CD spectra analysis
FIGURE 2 Effect of ionic strength on the CD spectra of SPI: (a) present a low point of Savitzky-Golay smooth of SPI at 0 ionic strength; (b) show a high point of smooth SPI sample at different strengths.
In comparison with the control group (I = 0), secondary structure composition in tested groups showed a significant decrease in α-helix content, while it increased in content of β-sheets and random coils. It has been suggested that the effects of salts on electrostatic interactions largely affect α-helices, whereas salt effects on hydrophobic interactions mostly affect β-sheets,[Citation36] which have the tendency of being deeply buried within the polypeptide chain.[Citation37]
It also could be found that as ionic strength further increased from 0.1 to 0.9, α-helix content gradually increased from 9.32 to 12.05%; meanwhile, β-sheet content shows a negative decrease with values from 37.84 to 35.19%. The β-turn showed relative minor effects by ionic strength. The content of α-helix structure decreased with the increase in ionic strength from 0 to 0.1, meanwhile the exposure of hydrophobic sites buried inside the molecule increased, causing the protein molecule to display stronger surface hydrophobicity. Kato and Nakai[Citation8] determined surface hydrophobicity of native proteins, denatured proteins, and surfactant-bound proteins by a hydrophobic partition method and found that the surface hydrophobicity of the protein was negatively correlated with the α-helical content. This finding was in accordance with our conclusion. As the ionic intensity was further increased from 0.2 to 0.9, α-helical content only increased from 11.34 to 12.05; however, the surface hydrophobicity of SPI gained a relatively large increase. The α-helix structures are mainly stabilized by hydrogen bonds between the carbonyl groups (–CO) and the amino groups (–NH).[Citation38] Hydrogen bonds have been reported to be maintained, or slightly affected, by the electrostatic screening effects at high ionic strength.[Citation39] Hofmeister effects, which are dominant at higher salt concentrations, strengthen the hydrophobic effect by increasing the surface tension of the solvent, or by stabilizing peptide dipoles through specific ionic interaction. Salt can increase the surface tension of an aqueous solution, thereby increasing the hydrophobic force and stabilizing the protein core. Thus, the increase in solvent surface tension at higher salt concentrations stabilizes the folded or collapsed protein conformation, whereas the increasing hydrophobic force and surface tension could lead to an increasing surface hydrophobicity.[Citation40]
The changes in the secondary structure of soy proteins () caused by salt addition were accompanied by changes in surface hydrophobicity. There was a significant positive correlation between unordered structure (p < 0.05, r = 0.806) content and surface hydrophobicity. These results suggest that the randomness of the SPI structure could be decisive for the surface hydrophobicity properties of the soy protein.
Raman Analysis
The Raman spectra of proteins were sufficiently different from each other in detail to permit unambiguous identification by spectral database search algorithms.[Citation41] The Raman spectra of SPI in various ionic strengths are shown in . The phenylalanine band at 1003 cm−1 was used as the internal standard due to its insensitivity to conformation or micro-environment.[Citation41] The assignments of the characteristic bands and quantitative estimation of the secondary structure composition of SPI using the RSAP program are summarized in and , respectively.
TABLE 3 Characteristic Raman frequencies and tentative assignments of structures in SPI at different ionic strengths
FIGURE 3 Raman spectra of SPI at different ionic strengths.
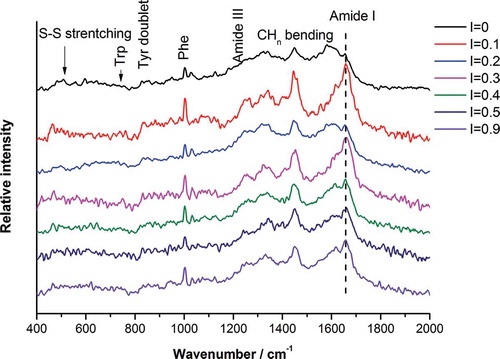
TABLE 4 Quantitative estimation of the secondary structure of the amide I and III bands in SPI by Raman spectra analysis
Effects of Ionic Strength on the Conformation of Main Chain
The Raman spectra of the SPI main chain conformation were complex and diverse. Among several distinct vibration modes of the –CO–NH– amide, the amide I and III bands were found to be the most useful in determining the secondary structure of the proteins.[Citation42] As shown in , the main Raman characteristic peaks of the amide I band of SPI at different ionic strengths were located between 1654 and 1662 cm−1, suggesting the dominance of α-helices and unordered structures. This was verified by subsequent identification of peaks 1246 cm−1 (random coil) and 1275 cm−1 (α-helix) by amide III band analysis. The absorption at 1305 cm−1 in the amide III region can be due to β-turn.
Quantitative estimation of the secondary structure composition of SPI by the RSAP program is summarized in . For natural SPI, unordered structure and α-helix structure are the most abundant components regardless of whether from amide I band or amide III band analysis, consisting of 36–44% and 27–29% of the total secondary structure, respectively. Raman analysis showed differences in the content of each secondary structure component in comparison with CD analysis. Particularly, the difference is embodied as higher content in α-helix and lower content in β-sheet for Raman spectra. This difference in content could be due to methodological reasons. Nevertheless, in term of the changing tendency of each component in secondary structure under various ionic strengths, Raman data traced the CD results well, which confirmed the important impact of increased ionic strength on the secondary structure of SPI. In addition, the analysis of amide III band is complicated by overlapping bands from side-chain vibrations, while few distinct Raman peaks assigned to β-sheet were observed in the amide III region, which also brought difficulty in interpreting.[Citation43]
Effect of Ionic Strength on the Conformation of the Side Chain
The Fermi resonances between the breathing vibration and the frequency doubling of out-of-plane bending vibration of the benzene ring in the tyrosine residue were found to be at 850 and 830 cm−1, respectively. The corresponding Raman intensity indicates the exposure/burial status of the tyrosine residues in the protein molecules, the I850/830 intensity ratio had been widely applied to describe the average hydrogen bonding state of the phenoxyl groups for tyrosine in globular proteins.[Citation42] The moles of tyrosine residues exposed to the molecule surface (Nexposed) and buried inside the molecules (Nburied) were calculated according to Eqs. (1) and (2):[Citation41]
Lord et al.[45] examined the Raman spectroscopy of lysozyme and constituent amine acids and found that when I850/I830 is between 1.25 and 1.40, the tyrosine residues are all exposed on the surface of the molecule; the phenolic OH acted as both a donor and an acceptor of moderate hydrogen bonds, while the ratio ranging from 0.3 to 0.5 indicates that the tyrosine residues are all buried inside the molecule, and the phenolic OH group acted as a strong hydrogen bond donor to an electronegative acceptor, such as carboxyl oxygen. When this ratio is 0.7, the tyrosine residues are in the ionized state. The dependence of I850/I830 and Nexposed/Nburied on ionic strength is depicted in . Results showed that I850/I830 value fluctuated around 1.0. There is no significant difference for I850/I830 values among different test groups. This indicted that most of the tyrosine residues were exposed on the surface of the protein, and tended to act as hydrogen donors.
TABLE 5 Fermi resonance ratio I850/I830 and the number of tyrosine residues that are exposed/buried in SPI
The Raman spectral band near 756 cm−1 was attributed to the tryptophan side chains, which are useful to monitor the polarity of the micro-environment, or involvement in hydrogen bonding. As shown in and , the Raman data on tryptophan side chain showed a large decrease in intensity at I = 0.1 and a slight decrease at most high ionic strengths in comparison with I = 0. Li-Chan[Citation42] reported that tryptophan residues from a buried, hydrophobic micro-environment become exposed to the polar aqueous solvent, and there may be a decrease in the intensity of a band near 760 cm−1 region. The decreasing band intensity suggested that tryptophan residues become exposed to the polar aqueous solvent from a buried, hydrophobic micro-environment due to salt addition.
FIGURE 4 Effect of ionic strength on normalized intensity of tryptophan residue in Raman spectra.
Disulfide Bond Analysis
Disulfide bonds play an important role in maintaining the tertiary structure of protein. The exact position of the S–S band was clearly indicated to some extent by the conformation of the residues contributing the disulphide bridge and, hence, the three-dimensional structure of proteins. The observed variations of vs-s among alkyl disulfides have been explained as a consequence of vibrational coupling between S–S stretching and S–C–C bending modes.[Citation42] Thus, vs-s is sensitive to the conformation about the C–S bond. These conformations, which may be denoted as g-g-g (gauche-gauche-gauche), g-g-t (gauche-gauche-trans), and t-g-t (trans-gauche-trans), are associated with vs-s of 510, 525, and 540 cm−1, respectively. The disulfide bond absorption and corresponding fitted spectrum are depicted in . shows the relative composition of S–S mode in SPI as a function of ionic strengths.
FIGURE 5 Multi-peak Gaussian fitting of disulfide bonds in SPI in 490–550 cm−1: (a) I = 0; (b) I = 0.1; (c) I = 0.2; (d) I = 0.3; (e) I = 0.4; (f) I = 0.5; (g) I = 0.9. The bold lines with squares denote experimental data, and the fine lines denote the fitted spectral peaks. The dashed lines with squares denote the spectral line obtained from combining the fitted spectral peak lines.
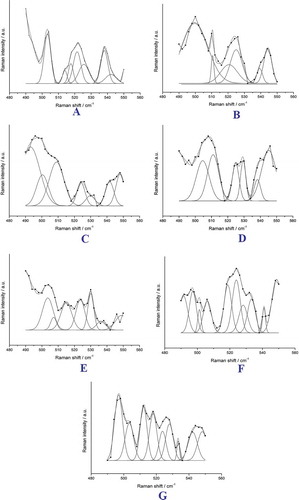
FIGURE 6 Effect of ionic strength on relative contents of different vibration modes of disulfide bonds in SPI.
Apparently, the percentages of the three modes of disulfide bond vary according to ionic strength. Generally, t-g-t contents show an increasing tendency as ionic strength increase regardless of a minor drop at I = 0.9. While for g-g-g content, it first decreased slightly at 0.1, then abruptly increased to more than 45% at 0.2 and steadily decreased to 33%. The curve of S–S vibration mode showed a great variation at I = 0.2 with a decrease to a value of 20% in g-g-t content, and then gradually recovered to 40% at I = 0.9.
Additionally, by correlating the disulfide conformation content with the surface hydrophobicity as ionic strength increased, it can be seen that the percentage of g-g-g mode was opposite to the observed surface hydrophobicity for SPIs, while the percentage of g-g-t and SPI’s surface hydrophobicity showed similar variation trends, but no significant linear correlations were found. These findings indicate that the g-g-g conformation of disulfides may inhibit the increase in surface hydrophobicity of the protein, whereas the g-g-t mode promotes the surface hydrophobicity. Thus, decreased surface hydrophobicity at 0.2 ionic strength may be related with the highest contents of both t-g-t and g-g-g vibration modes and lowest content of g-g-t vibration mode. In addition, the conformational S–S changes were reported to be well correlated with the secondary conformational modifications and the aggregate formation since the disulfide pairings are located between the helical segments.[Citation44] But no significant correlation was found between secondary conformation and vibration modes of disulfide bond in this research.
CONCLUSIONS
From the results presented in this work, it can be concluded that significant variance exists in spatial structure and surface hydrophobicity of SPI as ionic strength was varied. By examining spatial structure characterized by fluorescence, circular dichroism, and Raman spectroscopy, the impact of ionic effects on surface hydrophobicity could be clarified in more detail. It can be derived from the results that variance in surface hydrophobicity is linked to the changes in spatial structure caused by ionic strength. It is believed that these findings could be helpful to understand the impact of salinity on the surface hydrophobicity of SPI as well as to predict the other functional characteristics of SPI in a system with various ionic strengths.
FUNDING
The authors would like to thank the Natural Science Foundation of China (Project No. 31071493), the Postdoctoral Science Foundation of China (Project No. 2012M511433), the Heilongjiang Science and Technology Agency (research grant number: GA09B401-6), the Ministry of Agriculture of Modern Technology System Projects the Soybean Industry (research grant number: nycytx-004), the National Research Center of Soybean Engineering and Technology, and the Northeast Agricultural University for funding this work.
Additional information
Funding
REFERENCES
- Vakhtang, V.L.; Dmitri, N.E.; George, I.M. Thermodynamic consequences of rurial of polar and non-polar amino acid residues in the protein interior. Journal of Molecular Biology 2002, 320, 343–357.
- Shuryo, N. Structure-function relationships of food proteins with an emphasis on the importance of protein hydrophobicity. Journal of Agricultural and Food Chemistry 1983, 31, 676–683.
- Jiang, J.; Xiong, Y.L.; Chen, J. Roll of β-conglycinin and glycinin sunbunits in the pH-shifting-induced structural and physicochemical changes of soy protein isolate. Journal of Food Science 2011, 76, 293–302.
- Herreroa, A.M.; Carmonab, P.; Pintadoa, T.; Jimenz-Comlmeneroa, F.; Ruiz-Capillasa, C. Infrared spectroscopic analysis of structural features and interactions in olive oil-in-water emulsions stabilized with soy protein. Food Research International 2011, 44, 360–366.
- Zhang, Y.N.; Zhao, X.H. Study on the functional properties of soybean protein isolate cross-linked with gelatin by microbial transglutaminase. International Journal of Food Properties 2013, 6 (16), 1257–1270.
- Romero, A.; Cordobés, F.; Guerrero, A.; Puppo, M.C. Influence of protein concentration on the properties of crayfish protein isolated gels. International Journal of Food Properties 2014, 2 (17), 249–260.
- Benoit, S. M.; Nor Afizah, M.; Ruttarattanamongkol, K.; Rizvi, S.S.H. Effect of pH and temperature on the viscosity of texturized and commercial whey protein dispersions. International Journal of Food Properties 2013, 2 (16), 322–330.
- Kato, A.; Nakai, S. Hydrophobicity determined by a fluorescence probe method and its correlation with surface properties of proteins. Biochimica et Biophysica Acta (BBA)—Protein Structure 1980, 624, 13–20.
- Wagner, J.R.; Sorgentini, D.A.; Anon, M.C. Relation between solubility and surface hydrophobicity as an indicator of modifications during preparation processes of commercial and laboratory-prepared soy protein isolates. Journal of Agricultural and Food Chemistry 2000, 48, 3159–3165.
- Boatright, W.L.; Heltlarachchy, N.S. Soy protein isolate solubility and surface hydrophobicity as affected by antioxidants. Journal of Food Science 1995, 60, 798–801.
- Townsend, A.A.; Nakai, S. Relationships between hydrophobicity and foaming characteristics of food proteins. Journal of Food Science 1983, 48, 588–594.
- Wagner, J.R.; Gueguen, J. Surface functional properties of native, acid-treated, and reduced soy glycinin. 2. Emulsifying properties. Journal of Agricultural and Food Chemistry 1999, 47, 2181–2187.
- Hettiarachchy, N.S.; Kalapathy, U.; Myers, D.J. Alkali-modified soy protein with improved adhesive and hydrophobic properties. Journal of the American Oil Chemists’ Society 1995, 72, 1461–1464.
- Jiang, Y.; Tang, C.H.; Wen, Q.B.; Li, L.; Yang, X.Q. Effect of processing parameters on the properties of transglutaminase-treated soy protein isolate films. Innovative Food Science and Emerging Technologies 2007, 8, 218–225.
- Wang, J.B.; Xia, N.; Yang, X.Q.; Yin, S.W.; Qi, J.R.; He, X.T.; Yuan, D.B.; Wang, L.J. Adsorption and dilatational rheology of heat-treated soy protein at the oil-water interface: relationship to structural properties. Journal of Agricultural and Food Chemistry 2012, 60, 3302–3310.
- Parris, N.; Bardord, R. Interactions of Food Proteins; ACS Symposium Series 454. American Chemical Society: New York, 1991; 42–58.
- Aider, M.; Djename, D.; Ounis, W.B. Amino acid composition, foaming, emulsifying properties and surface hydrophobicity of mustard protein isolate as affected by pH and NaCl. International Journal of Food Science and Technology 2012, 47, 1028–1036.
- Hu, H.; Wu, J.H.; Li-Chan, C.Y.E.; Zhu, L.; Zhang, F.; Xu, X.Y.; Fan, G.; Wang, L.F.; Huang, X.J.; Pan, S.Y. Effects of ultrasound on structural and physical properties of soy protein isolate (SPI) dispersions. Food Hydrocolloids 2012, 30, 647–655.
- Shen, L.; Tang, C.H. Microfluidization as a potential technique to modify surface properties of soyprotein isolate. Food Research International 2012, 48, 108–118.
- McMindes, M.K. Applications of isolated soy protein in low-fat meat products. Food Technology 1991, 45, 61–64.
- Kimberly, L.J.; Charles, R.M. Protein and humic acid adsorption onto hydrophilic membrane surfaces: Effects of pH and ionic strength. Journal of Membrane Science 2000, 165, 31–46.
- Boye, J.I.; Alli, I.; Ismail, A.A.; Gibbs, B.F.; Konishi, Y. Factors affecting molecular characteristics of whey protein gelation. International Dairy Journal 1995, 5, 337–353.
- Bryant, C.M.; McClements, D.J. Influence of NaCl and CaCl2 on cold-set gelation of heat-denatured whey protein. Journal of Food Science 2000, 65, 801–804.
- Speroni, F.; Anon, M.C.; Lamballerie, M. Effects of calcium and high pressure on soybean proteins: A calorimetric study. Food Research International 2010, 43, 1347–1355.
- Lowry, O.H.; Rosembroug, H.J., Lewis, A.; Randall, R.J. Protein measurement with the folin phenol reagent. Journal of Biological Chemistry 1951, 193, 265–275.
- Sreerama, N.; Venyaminov, S.Y.U.; Woody, R.W. Estimation of the number of α-helical and β-strand segments in proteins using circular dichroism spectroscopy. Protein Science 1999, 8, 370–380.
- McClements, D.J. Food Emulsions: Principles, Practice, and Techniques; CRC Press: Boca Raton, FL, 1999.
- Shigeru, H.; Shuryo, N. Relationships of hydrophobicity and net charge to the solubility of milk and soy proteins. Journal of Food Science 1985, 50, 486.
- Moure, A.; Sineiro, J.; Dominguez, H.; Parajo, J.C. Functionality of oilseed protein products: A review. Food Research International 2006, 39, 945–963.
- Kalapathy, U.; Hettiarachchy, N.S.; Rhee, K.C. Effect of drying methods on molecular properties and functionalities of disulfide bond-cleaved soy proteins. Journal of the American Oil Chemists’ Society 1997, 74, 195–199.
- Renkema, J.M.S., Gruppen, H.; Vliet, T. Influence of pH and ionic strength on heat-induced formation and rheological properties of soy protein gels in relation to denaturation and their protein compositions. Journal of Agricultural and Food Chemistry 2002, 50, 6064–6071.
- Kalapathy, U.; Hettiarachchy, N.S.; Myers, D.; Rhee, K.C. Alkali-modified soy proteins: Effect of salts and disulfide bond cleavage on adhesion and viscosity. Journal of the American Oil Chemists’ Society 1996, 73, 1063–1066.
- Hogg, P.J. Disulfide bonds as switches for protein function. Trends in Biochemical Sciences 2003, 28, 210–214.
- Chen, Y.; Barkley, M.D. Toward understanding tryptophan fluorescence in proteins. Biochemistry 1998, 37, 9976–9982.
- Vivian, J.T.; Callis, P.R. Mechanisms of tryptophan fluorescence shifts in proteins. Biophysical Journal 2001, 80, 2093–2109.
- Przybycien, T.M.; Bailey, J.E. Secondary structure perturbations in salt-induced protein precipitates. Biochimica et Biophysica Acta (BBA)—Protein Structure 1991, 1076, 103–111.
- Hopp, T.P. Protein surface analysis: methods for identifying antigenic determinants and other interaction sites. Journal of Immunological Methods 1986, 88, 1–18.
- Fennema, O.R. Food Chemistry; Marcel Dekker Inc.: New York, 1996; 321–429.
- Smith, J.S.; Scholtz, J.M. Energetics of polar side-chain interactions in helical peptides: Salt effects on ion pairs and hydrogen bonds. Biochemistry 1998, 37, 33–40.
- Baldwin, R.L. How Hofmeister ion interactions affect protein stability. Biophysical Journal 1996, 71, 2056–2063.
- Tu, A.T. Spectroscopy of biological systems. In: Advances in Spectroscopy; Clark, R.J.H.; Hester, R.E.; Eds.; Wiley: New York, 1986; 65–116.
- Li-Chan, E.C.Y. The applications of Raman spectroscopy in food science. Trends in Food Science & Technology 1996, 7, 361–370.
- Maiti, N.C.; Apetri, M.M.; Zagorski, M.G.; Carey, P.R.; Anderson, V.E. Raman spectroscopic characterization of secondary structure in natively unfolded proteins: α-Synuclein. Journal of the American Oil Chemists’ Society 2004, 126, 2399–2408.
- Militello, V.; Vetri, V.; Leone, M. Conformational changes involved in thermal aggregation processes of bovine serum albumin. Biophysical Chemistry 2003, 105, 133–141.
- Lord, R. C. Strategy and tactics in the Raman spectroscopy of biomolecules. Applied Spectroscopy 1977, 31, 187–194.