
Abstract
This research aimed to develop both visible and shortwave near-infrared spectroscopy to evaluate the sensory qualities of cooked rice. In this study, four different types of milled rice were used: parboiled, white, new Jasmine, and aged Jasmine. The sensory qualities of cooked rice (adhesiveness, hardness, stickiness, dryness, whiteness, and aroma) were evaluated by a trained sensory panel. The results demonstrated that these sensory attributes correlated with visible and shortwave near-infrared spectral data. Both visible and shortwave near-infrared spectroscopy models used for predicting the sensory qualities of cooked rice were established using partial least squares regression. All prediction results for sensory qualities showed a range of R2val between 0.837 and 0.918, with the highest found for aroma (0.918). The proposed models can be utilized in quality control by the rice industry.
INTRODUCTION
The improvement process for milled rice raw materials processed in quality improvement plants includes cleaning, destoning and polishing, grading by size, sorting by color, winnowing, silo storage, and packaging. Quality-improved rice products are developed according to formulas that are a combination of different categories of raw materials designed by the plant’s research and development section. The various quality attributes of raw materials, such as moisture, instrument texture parameters, color, and tested sensory quality, were previously measured by traditional methods before the rice formulas were developed.
This article focuses on those sensory quality attributes required for quality assurance and control in the plant that affect consumer acceptance. During the improvement processes, rice is sampled for sensory quality attributes that are evaluated by trained panelists using sensory methods. Sensory qualities evaluated include adhesiveness, hardness, dryness, stickiness, aroma, and whiteness. In addition, sensory testing is carried out by panelists for sensory qualities on behalf of other product industries, such as those producing rice-shaped extruded kernels,[Citation1] Japonica rice,[Citation2] parboiled rice,[Citation3] whole meal bread,[Citation4] mashed potato,[Citation5] and cheese.[Citation6] Because this system using trained specialists is complicated and requires destruction of the test objects, an alternative method of efficiently and conveniently evaluating the sensory qualities of rice is needed.
The use of near-infrared spectroscopy (NIRS) has now become widespread in industry because of its non-destructive nature, rapidity, low cost, and environmental friendliness. The NIRS method has been applied in the assessment of the sensory attributes of various agricultural products and foods. Several researchers have evaluated its use in regard to foodstuff parameters, such as the acidity, bitterness, flavor, cleanliness, body, and overall quality of coffee;[Citation7] the taste, texture, and visual and olfactory attributes of and consumer preferences in regard to grapes;[Citation8,Citation9] the presence of holes, saltiness, buttery flavor, hardness, chewiness, creaminess, rancid flavor, pungency, and retronasal sensation in cheese;[Citation10] the classification of extra virgin olive oil;[Citation11] and the tenderness, juiciness, flavor intensity, abnormal flavor intensity, and overall acceptance of beef.[Citation12] In 1998, shortwave near-infrared spectroscopy (SW-NIRS) was applied to evaluate the physical and chemical properties (i.e., head rice ratio, apparent density, whiteness, moisture, protein, and amylose contents) of Japonica rice.[Citation13] A whole range of visible (VIS) and NIR (400–2500 nm) and long-wave (LW)-NIRS (1100–2500 nm) was applied to predict the texture of cooked rice varieties: 14 long-grain Thai;[Citation14] 76 short-grain, Bengal, Cypress, Keybonnet, and Drew;[Citation15] medium- and long-grain US;[Citation16] and M401, Koshihikari, and Calrose[Citation17]). The sensory qualities of Chinese indica rice in different areas (Hubei Province [mid-China], Zhejiang Province [East China], Sichuan Province [Southwest China], and Guangdong Province [South China]) were predicted using VIS and SW-NIRS,[Citation18] but the wavelengths used were limited to 540, 640, and 970 nm. However, to date there has been no report published on the use of VIS and SW-NIRS in evaluating the sensory quality of cooked rice for quality assurance and control in a rice quality improvement plant where a wide range of varieties, and processed rice, are used. The raw material in such plants is milled rice, with various varieties including Jasmine, other white rice, and parboiled rice, which is derived from white rice.
The purpose of this research was to develop VIS and SW-NIRS models to determine the sensory qualities of cooked rice in regard to quality assurance. In addition, it was aimed at exploring the possibility of NIRS application to a wide range of rice varieties and processed milled rice. The hypothesis of the research was that the sensory qualities of cooked rice would correlate with the near-infrared spectral properties of milled rice.
MATERIALS AND METHODS
Determination of Criteria of Sensory Quality Indices
Methodology for determination of criteria of sensory quality indices followed Lapcharoensuk and Sirisomboon.[Citation19] Samples of five types of milled rice were delivered to the Near Infrared Spectroscopy Research Center for Agricultural Product and Food at King Mongkut’s Institute of Technology Ladkrabang, Bangkok, Thailand. These five varieties are the most representative of the range of sensory qualities as recommended by the quality control section of the plant, because they cover the range routinely processed by the plant. In this research, the sensory quality indices of rice encompassed adhesiveness, hardness, stickiness, dryness, whiteness, and aroma, all of which are used by the rice quality improvement plant for quality evaluation.
The rice samples were cooked according to the water:rice ratios suggested by the plant. A team of 10 panelists (5 males and 5 females) were each served with the five types of cooked rice. The panelists conferred among each other before collectively deciding on the score allocated to each of the sensory quality indices. Scoring was on a scale of 1–5 (whole integers only), where 1 denoted maximum level and 5 minimum, except in the case of whiteness and aroma where 1 denoted minimum and 5 maximum.
Training of Panelists
All panelists were given multiple training sessions to acquaint them with the scoring criteria. Each panelist was served with one scoop each of all five cooked rice types, with aromatic assessment performed first. They were trained to assess adhesiveness by shaking small, covered plastic containers containing cooked rice and/or gently scraping the surface of the cooked samples with a small plastic spoon. In regard to the assessment of hardness and stickiness, the panelists were asked to chew the samples and then to explain their perceptions in simple words (e.g., for hardness, extremely hard, hard; for stickiness, extremely sticky, sticky). The panelists were trained to determine dryness and whiteness by visual observation. The overall sensory quality criteria were then used in the subsequent scoring at the experimental stage.
Two replicates of each type of cooked rice were used in each sensory evaluation training session, and these sessions continued until all participating panelists had become skilled at quality assessment. It should be noted that before each subsequent assessment, the panelists were served with drinking water to eliminate the aftertaste and rice residues from the previous assessment; moreover, the 5 cooked rice samples in the training sessions were of different types to those (i.e., 250 samples) used in the experimental stage. A flow diagram illustrating the sensory method used for evaluation of cooked rice is shown in .
FIGURE 1 Flow diagram of sensory method for cooked rice.
NIR Spectroscopy Experiment
Rice samples
All samples (n = 250) of milled rice were received from the rice quality improvement plant (C.P. Rice Co., Ltd., Thailand). The rice samples were randomly garnered from three locations within the plant premises (the raw material receiving station, behind the color sorter machine, and under the storage bin). These three locations were selected for sample collection because they are the sites at which rice samples are typically collected for internal quality inspection. The samples of milled rice tested were parboiled (processed from white rice; n = 51), white rice (from varieties other than Jasmine; n = 23), new Jasmine (Khao Dawk Mali 105 variety; n = 12; harvested in 2012 and sold to the plant where it was evaluated that year), and aged Jasmine (n = 164; harvested either in 2006 or 2007–2011; “aged” means the rice was kept for at least 1 year postharvest before processing and evaluation). The weight of each milled rice sample was approximately 200 g, and the samples were retained in a plastic zipper bag until experimentation.
Sample scanning
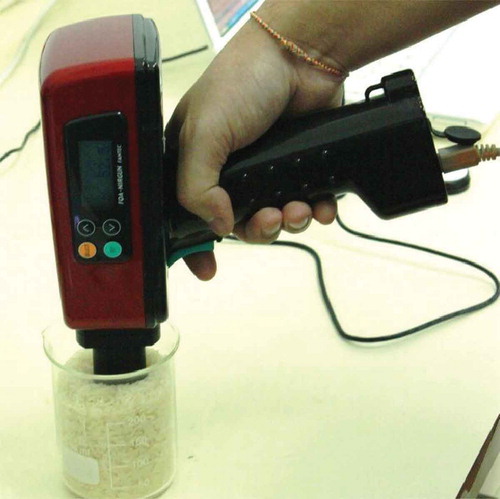
Milled rice samples was transferred from zipper bags to glass beakers (250 ml). The NIR spectrum was measured with a portable FQA-NIR GUN unit (FANTEC, Japan; reflection mode, 600–1100 nm; ). Scan results were recorded in absorption mode (log 1/R) for all samples. For every scan, the NIR GUN and sample were covered with black cloth to minimize interference by light.
FIGURE 2 VIS-NIR spectral measurement by portable FQA-NIR GUN (FANTEC, Japan).
Cooked Rice Preparation
Home electronic rice cookers (RC-10 MM; Toshiba, Thailand) were used to cook the 250 rice samples, and cooking was performed according to the water:rice ratios recommended by the plant (i.e., 2.5:1 for parboiled rice, 1.6:1 for white rice, 1:1 for new Jasmine rice harvested in 2012, and 1.2:1 and 1.4:1, respectively, for aged Jasmine rice harvested in 2007–2011 and in 2006. After the rice was fully cooked and the rice cooker automatically switched to warm mode, the cooked rice was gently and thoroughly mixed using a plastic ladle before transfer to small, covered plastic containers for sensory evaluation. The cooked rice samples were then presented to the sensory panelists for evaluation.
Sensory Evaluation
Sensory evaluation followed Lapcharoensuk and Sirisomboon.[Citation19] Scoring by panelists was as described above. The scores of the sensory quality indices allocated by the panelists contained only one decimal point. Evaluation of the 250 cooked rice samples followed the same procedures as those at the training stage, with 8–10 samples being served to each panelist simultaneously. Prior to tasting by the panelists, each sample was assigned a random 3-digit number. Prior to the commencement of sensory evaluation each day, the panelists received retraining on the sensory evaluation criteria.
Spectrum Pre-Treatment and NIR Spectroscopy Model Establishment
The NIR spectroscopy models for prediction of the sensory qualities of cooked rice were established using partial least squares regression (PLS). The software for multivariate analysis (Unscrambler, v. 9.8; CAMO, Norway) was used in both spectrum preprocessing and model creation. The NIR spectra were preprocessed by mean normalization, maximum normalization, range normalization, multiplicative scatter correction (MSC), first and second derivatives each with two smoothing points on both left and right sides and five smoothing points on both sides, baseline offset, de-trending (D), and standard normal variate (SNV) and de-trending (SNV+D). Further, 80% of the experimental samples (201 samples) were used in the calibration group and the remainder (49) in the validation group. The calibration group was used for model creation and the model error was calculated by the full cross-validation method. The same model was then used to predict the sensory qualities of rice in the validation group. The optimum model was selected by coefficients of determination of the calibration and validation groups (R2cal and R2val), standard error of calibration (SEC), standard error of prediction (SEP), bias, and ratio of standard deviation of validation data to SEP (RPD). The flow diagram of NIR spectroscopy methodology is shown in .
FIGURE 3 Flow diagram of NIR spectroscopy methodology.
Overall Precision Test
The overall precision test is important for the precision of reference test—in this case, sensory evaluation by the panelists. The NIR model cannot evaluate properties more accurate than the reference test. The overall accuracy or reproducibility of reference tests was determined by conducting tests on nine pairs of blind duplicates alongside the regular experiment. The duplicates were selected from 18 out of the 250 rice samples, and reproducibility is the standard deviation (SD) of the differences between the values of the blind duplicates. In addition, another 18 rice samples were selected as a new set of duplicates (9 pairs) to determine the repeatability of the reference tests, which is the SD of the differences between the values of these duplicates. The ratio of SEP to the SD of the reproducibility test (SEP/SD) was computed to determine the evaluation capability of all the calibration models, where SEP/SD < 1.0 represents an excellent NIR model, 1.0–2.0 a good model, 2.1–2.4 a fair model, 2.5–3.0 a poor model, and >3.0 an unreliable model (Tony Pietroutonio, Caltest, USA, personal communication).
RESULTS AND DISCUSSION
NIR Spectra of Milled Rice
The spectra of milled rice determined are shown in . In , all five types of milled rice showed a high absorbance peak (log 1/R) of 950–1000 nm. However, spectral data may have baseline shift and/or baseline offset that led to dislocation of absorbances. These problems can be resolved by use of the second derivative method (). The spectral plot shows obvious peaks at 744, 900, and 970 nm. Different types of milled rice affected the spectral level of the absorbance peak, especially at 970 nm, which is the absorbance band of water. The intensity of the peak was lowest for aged Jasmine rice (harvested in 2006) while those of other types tested were similar to each other, indicating the dryness of milled rice after long-term storage. The raw and second derivative spectra of milled rice at the three different stations are shown in and for aged Jasmine rice (harvested 2006–2011) and and for parboiled rice. By the second derivation, there was no difference in intensity level of the peaks illustrated, indicating that rice spectra were not affected by the different processing stations in the plant.
FIGURE 4 VIS-NIR spectra of milled rice. (a) Absorbance spectra (log 1/R) of different types of milled rice; (b) second derivative spectra of different types of milled rice; (c) absorbance spectra (log 1/R) of aged Jasmine rice (harvested 2007–2010) from different stations; (d) second derivative spectra of aged Jasmine rice (harvested 2007–2010) from different stations; (e) absorbance spectra (log 1/R) of parboiled rice from different stations; and (f) second derivative spectra of parboiled rice from different stations.
NIR Spectroscopy Model
Mean, SD, maximum (Max), and minimum (Min) values of the sensory qualities of cooked rice for calibration and validation groups are shown in . The range of stickiness was widest (1.0–5.0), that of hardness was narrowest (1.3–4.7), that of adhesiveness, aroma, and whiteness was 1.0–4.8, and that of dryness was 1.2–4.7. The statistics regarding prediction of the sensory qualities of cooked rice by the PLS model are shown in . The general optimum models (i.e., adhesiveness, stickiness, aroma, and whiteness) were derived from spectra preprocessed by the range normalization method. The de-trending method was found to be the spectral preprocessed method that gave the optimum model for prediction of hardness. The models for prediction of dryness were created by the spectra that were preprocessed by the baseline offset method.
The prediction results of all sensory quality indices showed a range of R2val between 0.842 and 0.918. The results for aroma indicated the highest prediction ability (R2val = 0.918; SEP = 0.284; bias = –0.043; RPD = 3.535), while R2val for adhesiveness, hardness, and stickiness—parameters indicating the textural properties of cooked rice—ranged from 0.842 to 0.904. Dryness and whiteness, which were evaluated visually, yielded R2val of 0.895 and 0.866, respectively. The scatter plots (reference data (X) with prediction data (Y)) of sensory qualities are shown in .
FIGURE 5 Scatter plots of reference data (X) with prediction data (Y) of sensory quality of cooked rice. (a) Adhesiveness; (b) hardness; (c) dryness; (d) stickiness; (e) aroma; and (f) whiteness.
This is the first time that VIS and SW-NIR in the range of 600–1100 nm have been applied to evaluate the sensory qualities of rice where a wide variation matrix was applied to different varieties and processed rice. Our overall sensory quality prediction (R2val = 0.842–0.918) was better than that reported by Qingyun et al.[Citation18] who recorded 0.31–0.77, likely because their prediction model was developed by multiple linear regression using wavelengths of 540, 640, and 970 nm only. In addition, our prediction of certain texture parameters was better than that obtained by Meullenet et al., where wavelengths of 400–2500 nm were used (R2val for hardness was 0.67);[Citation15] and that reported by Champagne et al. (R2val for hardness and stickiness was 0.67 and 0.58, respectively).[Citation16] The better prediction found in our work may have been due to the wider range of VIS and SW-NIR (600–1100 nm), the higher number of samples and the effectiveness, reduced complexity, and enhanced VIS and SW-NIR spectral correlation of our sensory method. Compared with the research findings of Srisawas et al. where longwave NIR (1100–2500 nm) was used[Citation14] and those of Meullenet et al.,[Citation15] we found a higher RPD (>2.5) for all prediction models. The SD in this study ranges from 1.00 to 1.15, which is nearly twice that reported in the literature cited above, thus yielding a higher RPD. Our higher SD value was obtained because of the wider variation matrix of different varieties and processed rice, whereas other studies included no processed products, such as parboiled rice, in their modeling.
The regression coefficient plots of optimum models for evaluation of the sensory qualities of cooked rice are shown in . The peak regression coefficient appeared at around 746–750 nm for all sensory quality indices. The peaks at 746 and 747 nm show the frequency characteristic of the C–H stretch fourth overtone of CH2 and O–H stretch third overtone of ArOH.[Citation20] ArOH is the chemical structure of phenolic compounds in rice.[Citation21] Adhesiveness, hardness, and stickiness, which mirror the textural qualities of cooked rice, showed the same peak of regression coefficient (935–990 nm). The prominent features at 938 nm are the absorption peaks associated with the C–H stretch third overtone of CH2.[Citation20] In addition, the peak at 990 nm is the vibration band of the O–H stretch second overtone of starch.[Citation20] The absorption peak of water (970 nm) is represented on a regression coefficient plot of texture attributes and dryness, indicating that the textural attributes were affected by starch and water. This is consistent with the work of Srisawas et al.,[Citation14] who studied the application of long-wave NIRS in the evaluation of sensory textural attributes where the identical strong absorption peak of NIR spectra was at 1894 nm (O–H stretch + 2 × C–O stretch [1900 nm] [starch]) for both milled and cooked rice. The dryness characteristic of cooked rice was evaluated by visual observation.
TABLE 1 Minimum (Min), maximum (Max), mean, and SD of sensory quality indices of cooked rice in calibration and validation groups
TABLE 2 Statistics of prediction of eating quality of cooked rice by PLS models
TABLE 3 Means and SD of differences between duplicates and ratios of standard error of prediction (SEP) to standard deviation (SEP/SD) of repeatability and reproducibility tests
FIGURE 6 Regression coefficient plots of optimum models for evaluation of sensory quality of cooked rice. (a) Adhesiveness; (b) hardness; (c) dryness; (d) stickiness; (e) aroma; and (f) whiteness.
Repeatability and Reproducibility
The means and SD of the differences between the duplicates and ratios of SEP to standard deviation (i.e., SEP/SD) of repeatability and reproducibility tests are shown in . The SEP/SD values for general sensory quality (adhesiveness, hardness, dryness, stickiness, and aroma) of cooked rice were found to be less than 1. In addition, the prediction model of whiteness showed SEP/SD values of 1.3, indicating the robustness of the models and indicating that SW-NIR spectroscopy of milled rice can satisfactorily be applied to evaluate the sensory qualities of cooked rice.
CONCLUSION
VIS and SW-NIR spectroscopy of milled rice represent a potential alternative technique for the industrial evaluation of the sensory qualities of cooked rice. The sensory quality indices of cooked rice models yielded R2val between 0.842 and 0.918, which supports the hypothesis that these indices correlate well with the spectral properties of milled rice. The findings in regard to aroma indicated its optimum prediction ability among the sensory quality indices, because the NIR spectroscopy model for aroma showed the highest R2val and lowest SEP values. The sensory quality indices of cooked rice with SEP/SD values less than 1 could also be evaluated by VIS and SW-NIR spectroscopy. These findings indicate the potential application of NIRS, a non-destructive method, for evaluating the sensory qualities of cooked rice at different random sampling stations for quality assurance and better control at the rice quality improvement plant. In practice, this method based on VIS and SW-NIRS could reduce the time, number of procedures, and costs previously inherent in the rice industry.
ACKNOWLEDGMENTS
The authors are grateful to C.P. Rice Co., Ltd., Thailand for assistance in sample collection.
REFERENCES
- Yoo, J.; Alavi, S.; Adhikari, K.; Haub, M.D.; Aberle, R.A.; Huber, G. Rice-shaped extruded kernels: Physical, sensory, and nutritional properties. International Journal of Food Properties 2013, 16 (2), 301–321.
- Yang, X.Y.; Lin, Z.M.; Liu, Z.H.; Alim, Md. A.; Bi, J.G., Li, G.H.; Wang, Q.S.; Wang, S.H.; Ding, Y.F. Physicochemical and sensory properties of japonica rice varied with production areas in China. Journal of Integrative Agriculture 2013, 12 (10), 1748–1756.
- Kam, K.; Murray, J.M.; Arcot, J.; Ward, R. fortification of parboiled rice with folic acid: Consumer acceptance and sensory evaluation. Food Research International 2012, 49 (1), 354–363.
- Pestorić, M.; Pojić, M.; Sakač, M.; Mastilović, J.; Šimurina, O.; Filipčev, B.; Živančev, J. Selection of optimal sensory properties for the recognition of wholemeal bread. International Journal of Food Properties 2012, 15 (4), 748–757.
- Álvarez, M.D.; Fernández, C.; Olivares, M.D.; Jiménez, M.J.; Canet, W. Sensory and texture properties of mashed potato incorporated with inulin and olive oil blends. International Journal of Food Properties 2013, 16 (8), 1839–1859.
- Sicard, M.; Perrot, N.; Reuillon, R.; Mesmoudi, S.; Alvarez, I.; Martin, S. A viability approach to control food processes: Application to a Camembert cheese ripening process. Food Control 2012, 23 (2), 312–319.
- Ribeiro, J.S.; Ferreira, M.M.C.; Salva, T.J.G. Chemometric models for the quantitative descriptive sensory analysis of Arabica coffee beverages using near infrared spectroscopy. Talanta 2011, 83 (5), 1352–1358.
- Ferrer-Gallego, R.; Hernández-Hierro, J.M.; Rivas-Gonzalo J.C.; Escribano-Bailón M.T. Evaluation of sensory parameters of grapes using near infrared spectroscopy. Journal of Food Engineering 2013, 118 (3), 333–339.
- Parpinello, G.P.; Nunziatini, G.; Rombolà, A.D.; Gottardi, F.; Versari, A. Relationship between sensory and NIR spectroscopy in consumer preference of table grape (CV Italia). Postharvest Biology and Technology 2013, 83, 47–53.
- González-Martín, M.I.; Severiano-Pérez, P.; Revilla, I.; Vivar-Quintana, A. M.; Hernández-Hierro, J. M.; González-Pérez, C.; Lobos-Ortega, I.A. Prediction of sensory attributes of cheese by near-infrared spectroscopy. Food Chemistry 2011, 127 (1), 256–263.
- Sinelli, N.; Cerretani, L.; Egidio, V.D.; Bendini, A.; Casiraghi, E. Application of near (NIR) infrared and mid (MIR) infrared spectroscopy as a rapid tool to classify extra virgin olive oil on the basis of fruity attribute intensity. Food Research International 2010, 43 (1), 369–375.
- Prieto, N.; Ross, D.W.; Navajas, E.A.; Nute, G.R.; Richardson, R.I.; Hyslop, J.J.; Simm, G.; Roehe, R. On-line application of visible and near infrared reflectance spectroscopy to predict chemical–physical and sensory characteristics of beef quality. Meat Science 2009, 83 (1), 96–103.
- Shimizu, N. Evaluating techniques for rice grain quality using near infrared transmission spectroscopy. Journal of Near Infrared Spectroscopy 1998, 6 (A), 111–116.
- Srisawas, W.; Jindal, V.K.; Thanapase, W.; Terdwongworakul, A. Relationship between sensory textural attributes and nir spectroscopy of cooked rice. Journal of Near Infrared Spectroscopy 2007, 15 (3), 333–340.
- Meullenet, J.F.; Mairomoustakos, A.; Horner, T.B.; Marks, B.P. Prediction of texture of cooked white rice by near-infrared reflectance analysis of whole-grain milled sample. Cereal Chemistry 2002, 79 (1), 52–57.
- Champagne, E.T.; Bett-Garber, K.L.; Grimm, C.C.; McClung, A.M.; Moldenhauer, K.A.; Linscombe, S.; McKenzie, K.S.; Barton, II, F.E. Near infrared reflectance analysis for prediction of cooked rice texture. Cereal Chemistry 2001, 78 (3), 358–362.
- Windham, W.R.; Lyon, B.G.; Champagne, E.T.; Barton, II, F.E.; Webb, B.D.; McClung, A.M.; Moldenhauer, K.A.; Linscombe, S.; McKenzie, K.S. Prediction of cooked rice texture quality using near-infrared reflectance analysis of whole-grain milled rice. Cereal Chemistry 1997, 74 (5), 626–632.
- Qingyun, L.; Yeming, C.; Mikami, T.; Kawano, M.; Zaigui, L. Adaptability of four-samples sensory tests and prediction of visual and near-infrared reflectance spectroscopy for Chinese indica rice. Journal of Food Engineering 2007, 79 (4), 1445–1451.
- Lapcharoensuk, R.; Sirisomboon, P. Eating quality of cooked rice determination using fourier transform near infrared spectroscopy. Journal of Innovative Optical Health Sciences 2014, 7 (6), 1450003.
- Osborne, B.G.; Fearn, T. Near Infrared Spectroscopy in Food Analysis, 1st Ed.; Longman Science & Technical: Essex, UK, 1986; Chapter 2.
- Huang, S.H.; Ng, L.T. Quantification of polyphenolic content and bioactive constituents of some commercial rice varieties in Taiwan. Journal of Food Composition and Analysis 2012, 26 (1–2), 122–127.