
Abstract
This study investigated the effect of blueberry juice on menhaden oil lipid oxidation during microencapsulation. Oil in water emulsions containing menhaden oil with 0, 5, or 10% blueberry juice were spray dried to produce control-M, 5% BJ-M, and 10% BJ-M microencapsulated powders, respectively. All microencapsulated powders had similar encapsulation efficiencies with low surface oil content. Peroxide value (meq/kg of oil) was 4.50, 4.31, and 3.38 for control-M, 5% BJ-M and 10% BJ-M, respectively. Ten percent BJ-M had lower (P < 0.05) anisidine value, and totox values than 5% BJ-M and control-M. This indicated that 10% blueberry juice reduced lipid oxidation in menhaden oil during microencapsulation to a greater extent than the other formulations.
INTRODUCTION
Blueberries (Vaccinium corymbosum) are considered to be a good source of phenolic compounds.[Citation1] The polyphenols and anthocyanins present in blueberries are known to have a positive role in human health and in disease prevention.[Citation1,Citation2] Blueberries have received much attention due to their high antioxidant activity compared to many other fruits and vegetables.[Citation1,Citation3] Antioxidant compounds, such as phenolic acids, polyphenols, and flavonoids, present in berries are able to scavenge free radicals such as peroxide, hydro-peroxide, and lipid peroxide, and thus inhibit oxidative mechanisms that lead to lipid oxidation.[Citation2]
Microencapsulation is defined as a process by which small amounts of core material such as fish oil and flavors are enveloped within a wall material to form micro size capsules.[Citation4,Citation5] Although many methods are available for microencapsulation, spray drying is the most common technique employed to produce microcapsules for food related applications because equipment is readily available for producing high quality microcapsule powders.[Citation4] Spray drying is an economical and versatile process for producing microencapsulated powders.
Successful microencapsulation of fish oils result preventing direct contact of oil with oxygen or metal ions, avoiding direct light exposure and in the trapping of off flavors.[Citation6] Although spray drying is the most popular microencapsulation technique used in the food industry, it is known to induce lipid oxidation and produce powders with porous structure.[Citation5] Also, low spray drying temperatures are advantageous to maintain fish oil quality, but microencapsulation requires temperatures as high as 170°C to produce a product with low (1–2%) moisture content.[Citation6] Research related to incorporation of natural antioxidants from berries into fish oil emulsions is scant. Blueberry antioxidants might reduce the amount of lipid oxidation occurring during emulsification (ultra-sonication) and spray drying; therefore, providing a greater storage stability of microencapsulated powders (even with a high load of core material). Tocopherol, a lipophilic antioxidant, and rosemary extract (a hydrophilic antioxidant) are commonly used as natural antioxidants in food products. It has been reported that tocopherol is more effective in reducing oxidization in oil-in-water emulsions than rosemary extract.[Citation7,Citation8] Blueberry extract consists of both lipophilic and hydrophilic antioxidants, which may reduce lipid oxidation during preparation and drying of the emulsion. The blueberry juice (BJ) antioxidants scavenge free radicals in fish oils, and also can chelate pro-oxidants such as metal ions.[Citation9] This could result in reduced lipid oxidation and increased fish oil stability during emulsification, spray drying, and subsequent storage. Hence, the objectives of this study were, (1) to determine the effect of BJ addition on lipid oxidation during emulsification and spray drying of microencapsulated menhaden (Brevoortia patronus) oil, and (2) to evaluate the emulsion and powder properties.
MATERIALS AND METHODS
Preparation of BJ
Three batches of locally obtained fresh high bush blueberries (Vaccinium corymbosum L.) were steam blanched using a steamer (Welco, Minneapolis, MN, USA) for 2 min and then rapidly cooled down to 10°C using an ice water bath. Afterwards, the blueberries were blended using a mechanical blender (Magic bullet, Mainland, China) for 1 min and the resulting mash was centrifuged at 2037.6 × g using a centrifuge (J2-HC-TB-002 model, Beckman instruments Inc., CA, USA) for 20 min at 4°C.
Physicochemical Properties of BJ
The yield (%) in BJ was calculated as: (weight of juice/initial blueberry weight)×100. Total monomeric anthocyanin content (TAC) of the BJ was determined by the pH differential method of AOAC 2005.02.[Citation10] The results were expressed as mg of cyanidin-3-glucoside equivalents per liter of BJ. Total phenol content (TPC) of BJ was determined according to the Folin-ciocalteau method.[Citation11] The results were expressed as milligrams of gallic acid equivalent (GAE) per liter of BJ. The anti-scavenging activity (AA) of BJ was determined by employing the DPPH radical scavenging assay (1,1-Diphenyl-2-picryl-hydrazyl) according to the method of Locatelli et al.[Citation12] The results were expressed as μmol of trolox equivalent (TE) per 100 mL of BJ.
The pH of BJ was measured using a bench top pH meter (Symphony, VWR Scientific, USA). The titratable acidity was determined using a titration method, and results were expressed as percent total organic acid on the basis of citric acid which is the predominant acid present in blueberries.[Citation13] The Brix of BJ was measured at 20°C using a hand held digital refractometer (Model AR 200, Reichart Analytical Instruments, USA). Color of the BJ was measured using a Lab Scan XE Colorimeter (Hunter Associates Laboratory, Inc. Resbon, VA) and the results were reported in CIE Lab color scales (L* value is the degree of lightness to darkness, a* value is the degree of redness to greenness, and b* value is the degree of yellowness to blueness). Chroma and hue angle values were calculated using Eqs. (1) and (2), respectively.
Physicochemical Properties of Fish Oil
Purified menhaden (Brevoortia patronus) oil (without added antioxidants) was provided by OmegaPureTM (Omega Protein Inc., Houston, TX, USA). The menhaden oil (MO) was analyzed for peroxide value (PV) according to the AOCS official method cd 8–53.[Citation14] PV was calculated and reported as milliequivalents of peroxide per 1 kg of MO. The anisidine value (AV), which represents secondary lipid oxidation products in oils, was determined by using the AOCS official method cd 18–90.[Citation14] The totox values of the oils were calculated as described by AOCS cg 3-91,[Citation14] as totox = AV + 2PV. Totox provides the overall oxidation state of the oils. The color of MO was measured using a Lab Scan XE Colorimeter (Hunter Associates Laboratory, Inc. Resbon, VA, USA) and the results were reported in CIE Lab color scales (L*, a*, and b* values). The chroma and the hue angle were calculated as described previously.
Preparation of Emulsions
Oil in water emulsions of 500 mL was prepared with 20% (w/w) MO containing 0, 5, or 10% of BJ by weight. These emulsions were designated as control-E, 5% BJ-E and 10% BJ-E, respectively. All of the emulsions were prepared using 5% (w/w) octenyl succinic anhydride (OSA) modified starch and 10% (w/w) corn syrup of dextrose equivalent of 36/43 (ADM company, Decateur, IL, USA) as wall materials. The wall materials for microencapsulation were selected based on preliminary emulsion stability experiments. Wall materials were dissolved in water and then BJ was added to the solutions. Then, MO was added to the wall material solution and the mixture was stirred before further emulsification using an ultrasonic processor (Model CPX 500, Cole Palmer Instruments, Vernon Hills, IL, USA) having a 20 KHz probe. Emulsification was done at the pulse rate of 2 to 1 for 5 min. The amplitude level was set to 80% for sonicating the emulsions. During the emulsification process the temperatures of the sample containers were kept at 20 ± 1°C using an ice bath. All of the emulsions were prepared in triplicates.
Emulsion Stability, pH, and Color
The stability of the emulsions was evaluated according to a method described by Min et al.[Citation15] The oil recovery percentage was calculated using Eq. (3).[Citation16] And the emulsion stability was determined using Eq. (4).
The pH of the emulsions was measured using a bench top pH meter (Symphony, VWR Scientific, USA). Emulsion color was measured with a Lab Scan XE Colorimeter (Hunter Associates Laboratory, Inc., VA, USA) and was reported in CIE Lab color scales (L*, a*, and b* values).
Emulsion Flow Properties
Emulsion flow properties were determined using an AR 2000ex Rheometer (TA Instruments, New Castle, DE, USA). The rheometer was fitted with a plate geometry employing 40 mm diameter plates and a 400 μm sample gap. An emulsion sample was placed on the temperature controlled plate and allowed to equilibrate at temperatures of 5, 15, and 25°C. The shear stress of the emulsions was measured at shear rates of 1 to 200 s−1. The emulsion flow properties were analyzed using the power law (Eq. 5) model where σ represents shear stress (Pa); symbolizes shear rate (s−1); k represents consistency index (Pa.sn), and n symbolizes flow behavior index.
Preparation of Spray Dried Microcapsules
The emulsions were transformed into microcapsules using a pilot plant spray drier (FT 80 Tall Form Spray Dryer, Armfiled Inc., Jackson, NJ, USA) employing a co-current drying procedure. The operational conditions were: feed temperature, 30°C, inlet air temperature, 170°C, and nozzle air gauge pressure, of 70 kPa. The control-E, 5%BJ-E and 10% BJ-E emulsions were spray dried to produce microencapsulated powders of control-M, 5% BJ-M and 10% BJ-M, respectively. The dried powders were collected and stored in amber bottles at 4°C for further analysis.
Lipid Oxidation of Emulsions and Microcapsules
The oil was extracted from emulsions and microcapsules according to a method described by Wanasundara and Shahidi.[Citation17] The oil recovered from the emulsions and microcapsules were analyzed for PV, AV, and Totox as previously described.
Fatty Acid Methyl Esters (FAMEs) Profile Analysis
FAMEs were determined for MO and oil extracted from the microcapsules according to the method described by Maxwell and Marmer.[Citation18] The fatty acid methyl esters were analyzed using a gas chromatograph (model 7890A Agilent) coupled with a flame ionization detector (Agilent Technologies Inc, Santa Clara, CA, USA). The peaks were identified using retention times of standards: Supelco 37, PUFA #1, PUFA #3, and cod liver oil from Supelco (Bellefonte, PA, USA). Data was expressed as percent of total integrated area.
Microencapsulation Efficiency (ME)
ME designates the amount of core material encapsulated within powder particles. The ME of spray dried powders was calculated using surface oil content and total oil content according to Eq. (6).
Total Oil Content
Surface oil content refers to the free or extractable oil around microcapsules. The surface oil content of microencapsulated MO powders was determined using petroleum ether as the extraction solvent and a method described by Jafariet al.[Citation4] The surface oil content was measured based on the weight difference between the initial clean flask and the flask with the extracted oil residue. The results were expressed as amount of surface oil content per gram of microcapsules. The total oil content of the microcapsules which include both encapsulated and surface oil was determined as described by Kosaraju et al.[Citation19] The total oil content was calculated by weight difference and expressed as the oil content per gram of microcapsules.
Color and Morphology of Microencapsulated MO Powder
The color of the microcapsules was measured using a Lab Scan XE Colorimeter (Hunter Associates Laboratory, Inc., Resbon, VA, USA) and was reported in CIE Lab color scales (L*, a*, and b* values). The morphology of microcapsules was observed using a scanning electron microscope (SEM) using an acceleration voltage of 5 kV. Microcapsules were mounted onto an aluminum SEM specimen stub using a double sided sticky tape, and coated with gold: palladium (60:40) using S150 sputter coater (Edwards High Vacuum International, Wilmington, MA, USA) to make the samples conductive. The coated stubs were examined and imaged with SEM.
Particle Size Distribution
Particle size of the microcapsules was measured using a Microtrac S3500 light scattering system (MicroTrac, Largo, FL, USA). The system consists of three fixed 780 nm solid state lenses with a computerized single lens alignment. The measurement capacity was from 0.24 to 2800 mm diameter. The distribution of particle size was calculated using light scattering pattern. Results were noted as 50th (median) and 90th percentiles of the microcapsules sizes.
Statistical Analysis
Mean values and standard deviations of triplicate experiments were reported. Analysis of variance (ANOVA) was carried out to determine the difference among treatment means (SAS Version 8.2, SAS Institute Inc., Cary, NC, USA) using the post hoc Tukey’s Studentized Range Test.
RESULTS AND DISCUSSION
Physicochemical Properties and Yield of BJ
Yield of BJ was 61% (w/w) of the berries. Blueberry seeds, mucilage, and pectin were contained in the residue. BJ contained 106 of TAC (mg/L cya-3-glu) and 3273 of TPC (mg/L GAEs; ). Blueberries have higher anthocyanin and phenols content than many types of berries such as cranberries, black berries, and strawberries.[Citation1,Citation3] The BJ was dark reddish in color (a* = 32.11 and L* = 6.65±0.03) and was acidic with a pH value of 3.23 and titratable acidity of 0.83 (citric acid equivalents). Blueberries had high AA due to the presence of anthocyanins and polyphenols. Moreover, blueberries contain the antioxidant phenolic compounds myricetin, quercetin, chlorogenic acid, and kaempferol, of which chlorogenic acid contributes the most of the antioxidant activity.[Citation1]
TABLE 1 Physicochemical properties and yield (%) of BJ*
According to the US Department of Agriculture,[Citation20] blueberries ranked as number one in antioxidant activity based on ORAC assay (oxygen radical absorbing capacity) compared to 40 common fresh fruits and vegetables. Fresh blueberries contain 2400 ORAC units/100 grams,[Citation21] which is higher than other berries including grapes, strawberries, raspberries, and cranberries. Several methods are available to determine antioxidant activity; in this study DPPH (2, 2-diphenyl-1-picrylhydrazyl) assay was used to measure the AA of BJ. The DPPH assay mainly addresses the radical scavenging ability of an antioxidant. This method is appropriate to indicate antioxidant activity in a lipid system in which lipid oxidation is carried out by a series of free radical reactions.[Citation22] The value obtained (3022 μmol TE/100g; ) was lower than the values reported in the previous study related to blueberry fruit based on the DPPH assay.[Citation23] Dragović-Uzelac et al.[Citation23] reported a total antioxidant activity (5630–7600 μmol TE/100g) based on DPPH assays of many blueberry cultivars.
Emulsion Stability, Color, Physicochemical, and Rheological Properties of Emulsions
ME is thought to be affected by emulsion stability since higher emulsion stability corresponds to higher efficiency.[Citation24] All of the prepared MO emulsions (with or without the addition of BJ) had >98% emulsion stability (). Emulsions with BJ added significantly increased stability over control-E. This may be due to the lipophilic and hydrophilic compounds present in the juice which might aid in further emulsion stabilization.[Citation25] The pH of the emulsions decreased with the juice addition (pH = 3.2; ). Emulsion stability was not affected by the pH of the emulsions, indicating that the starch emulsifier (OSA starch) was not affected by the pH of the mixture. It is noted that emulsions stabilized using protein emulsifiers are sensitive to the pH of the solution. Blueberry extract significantly changed the emulsion color from off white to light pink. 10% BJ-E and 5% BJ-E had higher a* and lower L* and b* values than control-E.
TABLE 2 Emulsion stability, pH, and color of MO emulsions*
TABLE 3 Flow behavior properties of control-E, 5% BJ-E, and 10% BJ-E*
The chroma value indicated strength of surface color which reflected the degree of visual difference from neutral grey.[Citation26] Chroma value of 5% BJ-M was lower than the other emulsions (). The 5% BJ-M emulsion color was closer to neutral grey than the other emulsions where control-E was more yellow in color and 10% BJ-E was more reddish in color. The hue angle value expresses the closest match with the spectral and non-spectral colors, in which, a sample with hue angle 0° is purplish red, 90° is yellow, 180° is bluish green, and 270° is blue.[Citation26] The hue angle value obtained for 5%BJ-E and 10%BJ-E was close to 0° because of purplish red color, while control-E had a hue angle value close to 90° because of its light yellow color. In most cases emulsion color is not a critical parameter since the powders are not individually consumed and the quantity of microencapsulated fish oil powders in a food product is low. The American Heart Association daily intake recommendation of EPA and DHA for coronary heart disease patients with high triglyceride levels, at levels of 1 g per day and 2–4 g/day, respectively.[Citation27] Although 10% BJ addition slightly changed the powder color, this amount would be less likely to cause an effect in practical applications.
Flow properties of emulsions are important in spray drying operations. Emulsion viscosity is important during microencapsulation since it has a direct effect on emulsion droplet size during atomization.[Citation16] More viscous emulsions produce larger droplet size resulting in powders with large particle size.[Citation28] Apparent viscosity of the emulsions decreased with increasing temperature (). The apparent viscosity at a shear rate of 200 s−1 was higher in 10% BJ-E than 5% BJ-E and control-E samples. The flow indexes (n) of the emulsions control-E, 5% BJ-E, and 10% BJ-E were less than 1 at all of the temperatures used, indicating a pseudo plastic fluid behavior (). The flow index of all emulsions increased with increased temperature. Thus emulsions attempt to behave as Newtonian fluids at higher temperatures. Control-E had a higher flow index than either 5% BJ-E or 10% BJ-E at all temperatures other than 5°C. At 5°C the flow index of control-E and 10% BJ-E were equal. This may be due to the fact that 5% BJ-E and 10% BJ-E have lower moisture content compared to control-E. The percent moisture content of control-E, 5% BJ-M, and 10% BJ-M were 68.90, 66.47, and 64.58, respectively ().
Conversely, the emulsion consistency index (k) decreased with increased temperature in all the emulsions. The k value is related to the viscous nature of the emulsions, in that it increases with increased viscosity.[Citation16] Among the different emulsions, 5% BJ-E had a higher k value than 10% BJ-E. Control-E had the lowest k value at all temperatures other than 5°C (). At 5 °C, Control-E and 10% BJ-E had the same k value. A higher k value may be due to the solids present in the juice, but with 5% BJ-E having the highest k value, the data does not show any clear relationship between total solids with k value.
Lipid Oxidation During Emulsification and Microencapsulation
The PV, AV, and Totox values of MO, control-E, 5% BJ-E and 10% BJ-E after emulsifications are shown in . Compared to the initial MO, the emulsification process resulted in significantly increase of both PV and AV in the control-E and 5% BJ-E emulsions. The PV increased from an initial value of 2.10 meq/kg for MO to 2.78 and 2.56 for control-E and 5%BJ-E respectively. However, 10%BJ-E did not show a significant difference in PV and AV compared to MO (). The AV of these emulsions increased in a similar manner as the PV, which indicated that BJ, at 10% addition, effectively prevented oxidation occurring during the emulsification process using the ultra-sonication technique.
TABLE 4 PV, AV, Totox value of MO and MO emulsions*
The emulsification method used in the experiment, i.e., ultra-sonication, is known to cause lipid oxidation. Chemat et al.[Citation29] reported an increase in PV value from 5.38 meq/kg to 6.33 meq/kg in sonicated sunflower oil samples processed for 2 min (20 KHz, 150 W). The ultrasound assisted lipid oxidation is attributed to the cavitation phenomenon, which affects structural and functional components leading to lipid oxidation.[Citation29] The collapse of cavitation bubbles in the emulsions resulted in formation of hot spots having high temperatures and pressure of 500 MPa. These hot spots resulted in lipid oxidation caused by various mechanisms such as thermal effects, and from free radicals generated during sonication.
Baik et al.[Citation30] reported an increase of PV of fish oil emulsions from 9.5 ± 0.4 mmol/Kg to 17 ± 4.0 mmol/kg in spray dried powders. Drusch et al.[Citation31] explained that during the spray drying process, fish oil exposed to air, high temperature, and high pressure lead to increased lipid oxidation. Similarly, our experimental results showed an increase in PV and AV in microencapsulated MO powders compared to pure oil as shown in . Lipid oxidation during spray drying is a function of drying temperature. Higher drying temperatures are related to increased lipid oxidation.[Citation32] Furthermore, the degree of lipid oxidation is also related to the fraction of un-encapsulated oil (i.e., surface oil) which might undergo rapid oxidation during the spray drying process.[Citation31]
FIGURE 1 PV, AV, Totox value of control-M, 5%BJ-M and 10%BJ-M powders; Values are means and SD of triplicate determinations; MO = menhaden oil; control-M = microencapsulated MO; 5%BJ-M = microencapsulated MO with 5% BJ; 10%BJ-M = microencapsulated MO with 10% BJ; PV = peroxide value; AV = anisidine value.
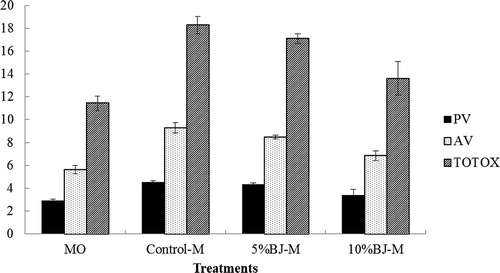
Lower PV, AV, and Totox values were obtained for 10% BJ-M than for 5% BJ-M or for control-M powders (). This indicated that 10% BJ-M prevented lipid oxidation during spray drying to a greater extent than the other formulations and 5% BJ-E had significantly lower PV values compared to control-M. AV and Totox values of 5% BJ-M do not show significant difference with those of control-M. This indicated that increased juice addition reduced lipid oxidation during spray drying. The results indicated BJ antioxidants effectively reduced lipid oxidation during spray drying.
During microencapsulation MO undergoes multiple changes in physical properties such as the amount of bulk oil, dispersed oil in the aqueous phase (emulsion), and dispersed oil in dry matrix (microencapsulated powders). Although microencapsulation reduces lipid oxidation during storage, addition of antioxidants is required to prevent lipid oxidation that occurs during processing and to further reduce lipid oxidation during storage.[Citation31]
A study conducted using antioxidants such as tocopherol and ascorbyl palmitate showed a decrease in lipid oxidation during the emulsification process compared to control samples.[Citation30] Another study showed that emulsions with tocopherol and rosemary extract had reduced auto-oxidation during the process of spray drying.[Citation8] Oil-in-water emulsions are better stabilized by lipophilic antioxidants such as tocopherol compared to hydrophilic antioxidants; such as rosemary extract.[Citation30] Conversely, hydrophilic antioxidants may be more effective in bulk oil.[Citation30] Since BJ consists of both lipophilic and hydrophilic antioxidants[Citation25,Citation1] it has the possibility of preventing lipid oxidation during the emulsification and spray drying processes. Moreover, it can be advantageous to employ antioxidants having larger quantities of hydrophilic antioxidant activity compared to lipophilic, such as BJ does, since such antioxidants can effectively prevent lipid oxidation in the microencapsulated powders during spray drying and subsequent storage period.[Citation25]
FAME Composition of MO and Microencapsulated Powders
summarizes the percent of fatty acid methyl esters present in the initial MO and in the oil extracted from control-M, 5% BJ-M, and 10% BJ-M. EPA and DHA omega-3 type fatty acids are the most important and can undergo rapid oxidation due to their highly unsaturated nature. The experimental values reported for MO EPA and DHA content is in accordance with the literature.[Citation33,Citation6] All the microencapsulated powder formulations contained around 14% EPA (). The EPA content of MO and 10% BJ-M were not significantly different; however, the EPA content of control-M and 5% BJ-M was significantly different than that of MO. No significant difference in EPA content was obtained between 5% BJ-M and control-M. This could be associated to the PV, AV, and Totox values obtained for microencapsulated powders, where 10% BJ-M and MO did not have significant difference, while 5% BJ-M and control-M had significant differences in the previously mentioned lipid oxidation parameters. The percent DHA contents of all the microencapsulated powder formulations were around 13.5%. DHA content also exhibited a similar pattern to EPA, where MO was not significantly different from 10% BJ-M, while MO was significantly different from 5% BJ-M and control-M, and 5% BJ-M had no significant difference with control-M.
TABLE 5 Fatty acid methyl ester composition (% w/w) of MO, control-M, 5% BJ-M, and 10% BJ-M*
ME of Microencapsulated MO Powders
shows the surface oil content, total oil content, and ME of microencapsulated MO powders. A high oil load was used in the experiment in order to study the effect of antioxidants on lipid oxidation. The total oil content of the MO powders ranged from 55 to 59%. Surface oil content of control-M was significantly higher than 10% BJ-M and 5% BJ-M. The greater surface oil content of control-M could be related to its lower emulsion stability compared to 5% BJ-M and 10% BJ-M ().
TABLE 6 Surface oil content, total oil content, and microencapsulation efficiency of microencapsulated MO powders
TABLE 7 Color of microencapsulated MO powders
All of the MO powders had high ME. 5% BJ-M had significantly higher encapsulation efficiency than did control-M and 10% BJ-M. Successful microencapsulation of MO should result in high ME and low surface oil content on the powder particles. A higher ME and lower surface oil content was observed in 5% BJ-M compared to 10% BJ-M. This could be attributed to the higher viscosity of 10% BJ-E. Higher viscosity emulsions tend to produce larger particles.[Citation28] According to Jafariet al.[Citation28] microencapsulated powders with large particle size contain more surface oil than powders with small particle size. Powders having more surface oil resulting in lower ME. Surface oil not only affects the wettability and dispensability of the powder but also readily undergoes lipid oxidation.[Citation4] ME can be affected by many factors such as properties of wall and core materials, emulsion characteristics, and spray drying parameters.[Citation4] Generally microencapsulated powder has oil load percentages ranging from 30–50%.[Citation28] Having higher oil load in the microcapsules can be advantageous. However, high oil load in microcapsules is associated with reduced encapsulation efficiencies and increased surface oil contents. It has been suggested that a core to wall material ratio of 1:4 is optimal for wall materials like gum arabic and modified starches.[Citation28] The microcapsules produced using n-OSA emulsifying starch and corn syrup with an oil load of around 57% produced powders during the present study with high ME.
Color, SEM, and Particle Size of Microencapsulated MO Powders
The L*, a*, and b* color values of microencapsulated MO powders (control-M, 5% BJ-M, and 10%BJ-M) are shown in . The color of the emulsions with or without the BJ correlated with the color of their microencapsulated powders. The addition of BJ increased the a* value of the powders and reduced the L* and b* values. The powders produced without the juice had a light yellow color (higher b*) due to the color of the oil. Microencapsulated powder enriched products are becoming increasingly popular in the market. There are a number of products exist with enriched fish oil powders such as meat and poultry products, bread and bakery products, fats, eggs and egg products, milk and dairy products, pasta, sauces, juices, soft drinks, instant concentrates, and spreads.[Citation34] The quantity of microencapsulated fish oil powders in a food product is very low and this amount mostly followed the recommended daily intake of EPA and DHA levels. Although BJ slightly changed the powder color, it would not likely to cause an effect on practical applications related to fish oil powders.
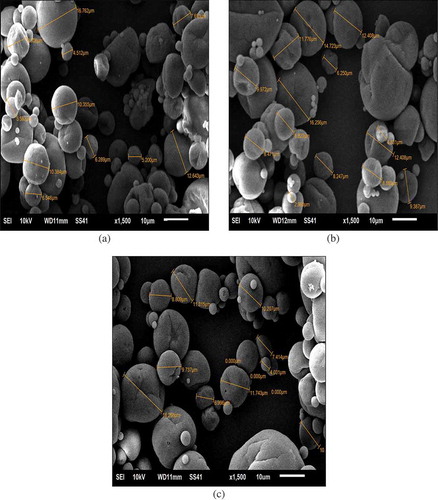
SEM images of the MO powders control-M, 5% BJ-M, and 10% BJ-M are shown in . All of the powders had individual spherical particles with some dents and shrinkage that could be attributed to the early stage of drying under high drying rates.[Citation28] This is the typical appearance of a spray dried product. There is some aggregation of particles that can be seen in all three powder samples which may be due to surface oil.[Citation35] The three powders do not differ greatly, indicating that extract addition does not change the morphology of the powders. There are no distinct cracks on the powder surface observed on any of the three menhaden powder samples.
FIGURE 2 SEM image of microencapsulated control-M (a), 5%BJ-M (b), and 10%BJ-M (c) powders. Control-M = microencapsulated MO; 5%BJ-M = microencapsulated MO with 5% BJ; 10%BJ-M = microencapsulated MO with 10% BJ.
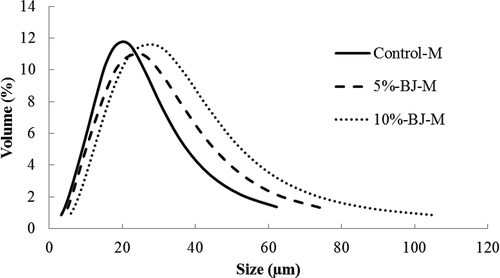
The particle size distributions of control-M, 5% BJ-M, and 10% BJ-M are illustrated in . All powders had mean particle size ranging from 20 to 30 μm. Generally, the particle size of microencapsulated powders produced by spray drying is 1–400 μm.[Citation28] As previously explained, addition of BJ increased the emulsion concentration and viscosity, and produced powders with high mean particle size (). The mean particle size of 10% BJ-M was significantly higher than both control-M and 5% BJ-M, and 5% BJ-M had greater mean particle size than control-M. Also the SEM microstructure () of control-M, 5% BJ-M, and 10% BJ-M were consistent correlated with the particle size distribution where 10% BJ-M SEM images showed bigger particles compare to 5%BJ-M and control-M.
FIGURE 3 Particle size distribution of control-M, 5%BJ-M and 10%BJ-M; values are means and SD of triplicate determinations. Control-M = microencapsulated MO; 5%BJ-M = microencapsulated MO with 5% BJ; 10%BJ-M = microencapsulated MO with 10% BJ.
Some researchers reported that higher particle size increased the amount of oil retention. However, Chang et al.[Citation36] found that total oil retention was highest in intermediate size particles while large particles showed the lowest oil retention. Also, it was found that increased oil load in emulsions will result in larger oil droplets and an increase in mean particle size of the microcapsules. Particle size can be affected by emulsion characteristics (viscosity and solids concentration) and drying conditions.[Citation28]
CONCLUSION
MO emulsions produced with or without BJ had high emulsion stability. All of the emulsions showed pseudo plastic (n < 1) shear thinning flow behavior. The addition of BJ changed the color of both the emulsions and the microencapsulated powders by increasing a* and reducing L* and b* values. During the emulsification and spray drying process BJ retarded lipid oxidation of MO. Increased juice addition was directly related to decreased lipid oxidation in emulsions and powders. Powders, with or without BJ, did not have significant differences in powder morphology. Mean particle size of the powders ranged between 20–30 μm. This study indicated that BJ could be added to MO emulsions in order to prevent potential lipid oxidation during emulsification and spray drying without significantly altering emulsion or powder characteristics.
REFERENCES
- Zheng, W.; Wang, S.Y. Oxygen radical absorbing capacity of phenolics in blueberries, cranberries, chokeberries, and lingonberries. Journal of Agricultural and Food Chemistry 2003, 51 (2), 502–509.
- Brownmiller, C.; Howard, L.; Prior, R. Processing and storage effects on monomeric anthocyanins, percent polymeric color, and antioxidant capacity of processed blueberry products. Journal of Food Science 2008, 73 (5), H72–H79.
- Jakobek, L.; Seruga, M. Influence of anthocyanins, flavonols, and phenolic acids on the antiradical activity of berries and small fruits. International Journal of Food Properties 2012, 15 (1), 122–133.
- Jafari, S.M.; Assadpoor, E.; Bhandari, B.; He, Y. Nano-particle encapsulation of fish oil by spray drying. Food Research International 2008, 41 (2), 172–183.
- Klaypradit, W.; Huang, Y.-W. Fish oil encapsulation with chitosan using ultrasonic atomizer. LWT-Food Science and Technology 2008, 41 (6), 1133–1139.
- Beindorff, C.M.; Zuidam, N.J. Microencapsulation of fish oil. In: Encapsulation Technologies for Active Food Ingredients and Food Processing. Springer: New York. 2010; 161–185.
- Hogan, S.; O’riordan, E.; O’sullivan, M. Microencapsulation and oxidative stability of spray-dried fish oil emulsions. Journal of Microencapsulation 2003, 20 (5), 675–688.
- Serfert, Y.; Drusch, S.; Schwarz, K. Chemical stabilisation of oils rich in long-chain polyunsaturated fatty acids during homogenisation, microencapsulation, and storage. Food Chemistry 2009, 113 (4), 1106–1112.
- Medina, I.; Undeland, I.; Larsson, K.; Storrø, I.; Rustad, T.; Jacobsen, C.; Kristinová, V.; Gallardo, J.M. Activity of caffeic acid in different fish lipid matrices: A review. Food Chemistry 2012, 131 (3), 730–740.
- AOAC. Official methods of analysis. Arlington, VA: Association of Official Analytical Chemists. 2005.
- Slinkard, K.; Singleton, V. L. Total phenol analysis: Automation and comparison with manual methods. American Journal of Enology and Viticulture 1977, 28 (1), 49–55.
- Locatelli, M.; Gindro, R.; Travaglia, F.; Coïsson, J.-D.; Rinaldi, M.; Arlorio, M. Study of the DPPH-scavenging activity: Development of a free software for the correct interpretation of data. Food Chemistry 2009, 114 (3), 889–897.
- Ehlenfeldt, M.K.; Meredith, F.I.; Ballington, J.R. Unique organic acid profile of rabbiteye vs. highbush blueberries. HortScience 1994, 29 (4), 321–323.
- AOCS ed. Official Methods and Recommended Practices of the American Oil Chemists’ Society Urbana, IL, USA, 1997.
- Min, S.; Mistry, B.; Lee, H.O. Improvement of oxidative and emulsion stability of model salad dressing by glucose oxidase‐catalase. Journal of Food Science 2003, 68 (4), 1272–1275.
- Wan, Y.; Bankston Jr, J.D.; Bechtel, P.J.; Sathivel, S. Microencapsulation of menhaden fish oil containing soluble rice bran fiber using spray drying technology. Journal of Food Science 2011, 76 (4), E348–E356.
- Wanasundara, U.N.; Shahidi, F. Storage stability of microencapsulated seal blubber oil. Journal of Food Lipids 1995, 2 (2), 73–86.
- Maxwell, R.J.; Marmer, W.N. Systematic protocol for the accumulation of fatty acid data from multiple tissue samples: Tissue handling, lipid extraction, class separation, and capillary gas chromatographic analysis. Lipids 1983, 18 (7), 453–459.
- Kosaraju, S.L.; Weerakkody, R.; Augustin, M.A. In-vitro evaluation of hydrocolloid–based encapsulated fish oil. Food Hydrocolloids 2009, 23 (5), 1413–1419.
- USDA. USDA National Nutrient Database for Standard Reference. Betsville, Human Nutrition Research Center, ARS. 2004.
- Prior, R.L.; Cao, G.; Martin, A.; Sofic, E.; McEwen, J.; O’Brien, C.; Lischner, N.; Ehlenfeldt, M.; Kalt, W.; Krewer, G. Antioxidant capacity as influenced by total phenolic and anthocyanin content, maturity, and variety of Vaccinium species. Journal of Agricultural and Food Chemistry, 1998, 46 (7),2686–2693.
- Faria, A.; Oliveira, J.; Neves, P.; Gameiro, P.; Santos-Buelga, C.; de Freitas, V.; Mateus, N. Antioxidant properties of prepared blueberry (Vaccinium myrtillus) extracts. Journal of Agricultural and Food Chemistry, 2005, 53 (17), 6896–6902.
- Dragović-Uzelac, V.; Savić, Z.; Brala, A.; Levaj, B.; Bursać Kovačević, D.; Biško, A. Evaluation of phenolic content and antioxidant capacity of blueberry cultivars (Vaccinium corymbosum L.) grown in the Northwest Croatia. Food Technology and Biotechnology 2010, 48 (2), 214–221.
- Augustin, M.A.; Sanguansri, L.; Bode, O. Maillard reaction products as encapsulants for fish oil powders. Journal of Food Science 2006, 71 (2), E25–E32.
- Frankel, E.N. Antioxidants in lipid foods and their impact on food quality. Food Chemistry 1996, 57 (1), 51–55.
- Wetzel, D.L.; Charalambous, G. Instrumental methods in food and beverage analysis, Elsevier: Netherlands, 1998.
- Moore, C.S.; Bryant, S.P.; Mishra, G.D.; Krebs, J.D.; Browning, L.M.; Miller, G.J.; Jebb, S.A. Oily fish reduces plasma triacylglycerols: A primary prevention study in overweight men and women. Nutrition 2006, 22 (10), 1012–1024.
- Jafari, S.M.; He, Y.; Bhandari, B. Role of powder particle size on the encapsulation efficiency of oils during spray drying. Drying Technology 2007, 25 (6), 1081–1089.
- Chemat, F.; Grondin, I.; Costes, P.; Moutoussamy, L.; Sing, A.; Smadja, J. High power ultrasound effects on lipid oxidation of refined sunflower oil. Ultrasonics Sonochemistry 2004, 11 (5), 281–285.
- Baik, M.-Y.; Suhendro, E.; Nawar, W.; McClements, D.; Decker, E.; Chinachoti, P. Effects of antioxidants and humidity on the oxidative stability of microencapsulated fish oil. Journal of the American Oil Chemists’ Society 2004, 81 (4), 355–360.
- Drusch, S.; Serfert, Y.; Scampicchio, M.; Schmidt-Hansberg, B.; Schwarz, K. Impact of physicochemical characteristics on the oxidative stability of fish oil microencapsulated by spray-drying. Journal of Agricultural and Food Chemistry 2007, 55 (26), 11044–11051.
- Kolanowski, W.; Ziolkowski, M.; Weißbrodt, J.; Kunz, B.; Laufenberg, G. Microencapsulation of fish oil by spray drying—impact on oxidative stability. Part 1. European Food Research and Technology 2006, 222 (3–4), 336–342.
- Osman, H.; Suriah, A.; Law, E. Fatty acid composition and cholesterol content of selected marine fish in Malaysian waters. Food Chemistry 2001, 73 (1), 55–60.
- Kolanowski, W.; Laufenberg, G. Enrichment of food products with polyunsaturated fatty acids by fish oil addition. European Food Research and Technology 2006, 222 (3–4), 472–477.
- Shivakumar, K.; Chetana, R.; Reddy, S.Y. Preparation and properties of encapsulated fat powders containing speciality fat and ω/pufa-rich oils. International Journal of Food Properties 2012, 15 (2), 412–425.
- Chang, Y.; Scire, J.; Jacobs, B. Effect of particle size and microstructure properties on encapsulated orange oil. Flavor Encapsulation 1988, 370, 87–102.