
Abstract
Durian contains thick rind which restricts light penetration into the pulp region. Indirect prediction of pulp dry matter as a reference of maturity was investigated using spectral information from the rind and stem. Partial least squares regression was performed to model variation in the pulp dry matter using the rind and stem absorbance. The rind model showed better performance in predicting the dry matter content than the stem model. However, the accuracy was relatively poor (correlation coefficient of prediction, rp = 0.76 and root mean square error of prediction, RMSEP = 1.82%) compared with that of the reference pulp model (rp = 0.83 and RMSEP = 1.61%). The rind model was superior to the stem model in the classification of durian samples into immature, early-mature, and mature classes based on the number of days after anthesis and the dry matter content. Effective wavelengths were chosen from the regression coefficients of the corresponding models and used to create a simplified classification model. A combination of both rind and stem spectral data at selected wavelengths provided the highest accuracy of classification (94.4%).
INTRODUCTION
Durian (Durio zibethinus Murray) is one of the most economically important fruits of Thailand. Among the countries in the Association of Southeast Asian Nations (ASEAN), Thailand is considered as the number-one leader in durian cultivation and is one of the main countries that export durian to the international market.[Citation1]
It is well known that when an immature durian is harvested, it will not ripen properly, or else will ripen with substantially less flavor and taste, leading to a poor eating experience. Conversely, an over-ripe one will decay rapidly after harvest.
Several criteria are used for judging durian fruit maturity, such as the number of days from full bloom, the color of the spine tip, the elasticity and disposition of the spines, the intensity of the odor emitted, changes in the fruit stalk, the percentage of dry matter of fruit, and especially the sound of the fruit when tapped.[Citation2,Citation3] However, these criteria cannot be applied properly to the large volume of durian exported because of their limitations with respect to speed and accuracy. In addition, some methods are destructive which is a costly exercise using such an expensive fruit.
Demand for durian is always high at the beginning of the harvest season and exporters are guaranteed a high price. However, to achieve high, early season, market prices, growers are tempted to harvest fruit as soon as (or before) physiological maturity is reached. This is the most serious problem for exporters. Immature and mature fruits can be simultaneously harvested because they do not ripen at the same time. Every year, exported fruits consist of a mixture of mature fruits and immature fruits. The inclusion of unsuitable fruit leads to a lower market price. Moreover, exported durians are often rejected by the market because of this problem. Therefore, to ensure the supply of high quality fruit, it is important to select fruit with the proper degree of maturation.
Sorting the immature from the mature fruit is quite difficult even for an experienced person. Therefore, it would be extremely beneficial to develop a quick and non-destructive technique for detecting the degree of maturation. Several techniques have been studied to achieve the objective of non-destructive detection of durian maturity. Yantarasri et al.[Citation4] scanned a durian pulp image using medical X-ray computed tomography (CT) to obtain CT numbers and scanned the pulp with near-infrared (NIR) spectroscopy. The methods were evaluated and compared to the sensory test. The results showed that there was a significant correlation between the maturity stages and the CT number. The dry matter content was reported as a potential and useful quality indicator for horticultural crops.[Citation5] The Thai Agricultural Commodity and Food Standard (TACFS 3-2003) is also considered as an important standard of Thai durian maturity.[Citation6] The only reliable method to measure dry matter is the drying of fruit slices to remove the water. However, this method is clearly destructive.
NIR spectroscopy is a non-destructive technique with high potential for both qualitative analysis[Citation7−Citation9] and quantitative analysis.[Citation10,Citation11] The application of NIRS for the rapid evaluation of dry matter has been investigated for many fruits and vegetables, such as onion,[Citation12] kiwifruit,[Citation5, Citation13−Citation15] mango fruit cv. “Kensington,”[Citation16] avocado,[Citation17−Citation19] apple,[Citation20−Citation22] and cucumber.[Citation23] However, non-destructive determination for intact durian maturity is hard to perform since durian has specific properties, for example, the high thickness of the rind, non-uniform shape, rough skin among others. Such properties limit the light penetration into the pulp to obtain its absorbance. However, most of current subjective indices used by harvesters are based on characteristics of the stem and rind. Nevertheless, the moisture content of the rind was reported to continuously decrease and to be inversely correlated with the moisture content of the pulp.[Citation24] Thus, the purpose of this study was to investigate the indirect evaluation of the dry matter content of durian pulp, which has been referenced to maturity, based on the absorbance of the stem and rind obtained by using NIR spectroscopy. The classification of durians into mature and immature classes using the absorbance was also investigated.
MATERIALS AND METHODS
Durian Samples
Fresh “Monthong” durian samples were harvested from an orchard in Chanthaburi province in eastern of Thailand. The fruit growth was tracked by tagging flowers from the selected trees when full bloom was detected. Approximately 30 trees were selected to supply the targeted number of durian samples which were harvested at 97, 104, 111, 118, 125, and 132 days after anthesis (DAA). The harvested samples from the six intervals provided a variation in maturity from the immature to the over mature stages. At each harvest date, 12 whole fruit samples were acquired from the orchard and transported to the laboratory within a day of harvest. All fruit samples were maintained at 25°C overnight and subsequent measurements were carried out on the following day.
Spectral Measurement
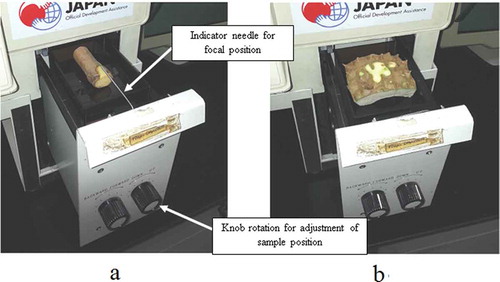
NIR spectral data were obtained using an available spectrophotometer (model IA500; Bran+Luebbe GmbH; Norderstedt, Germany). The NIR spectrometry system was arranged in the diffuse reflectance mode to receive the NIR signals from the prepared samples from stem and rind parts. The samples were placed on a sample holder and scanned from 1100 to 2500 nm. Data were collected every 2 nm (701 points per spectrum) and spectra were presented as raw log (1/R) data. The sample holder was adjustable both horizontally and vertically which allowed the sample to be moved relative to the focus position for irradiation which was indicated by a removable needle. Spectra were acquired after the samples were equilibrated in an air-conditioned laboratory at 25°C. Each sample was analyzed in duplicate with the details provided below in the corresponding sections.
Durian is characterized by a thick rind that is covered with spines. The penetration of the NIR light would be confined to the rind. However, the characteristics of the rind as well as the stem have been known to relate to maturity. Thus, this investigation focused on the application of the absorbance of the stem and the rind to create the model for the determination of the pulp dry matter content as it refers to the maturity level. Minimal destructive measurement of durian samples was achieved by measuring the rind and the stem. As the available spectrophotometer could be used only in the diffuse reflectance mode and the sample holder could not accommodate the whole fruit, the rind and the stem were removed from the whole fruit during the measurement.
Absorbance measurement of stem
The durian stem normally is partitioned into two parts by an abscission zone (). The upper part of the stem is connected to the tree and the lower part is attached to the fruit. This investigation was aimed at a future application for harvesting durians during their growth on the tree; therefore, the stem measurements were taken on two opposite side surfaces of the lower part of the stem. The two surfaces were selected on the sides of the stem that aligned along two fertile locules. The side surface area of the lower stem (10 mm × 20 mm) was prepared for scanning by removing the peel (about 0.5 mm thick) from the part adjacent to the abscission zone. The prepared stem of the lower part was then immediately detached from the fruit and the upper part of the stem. The stem was placed, with the axis in horizontal alignment, in the sample holder (). The sample holder was then adjusted by turning the knob so that the prepared area of the stem was at the focal position for the NIR diffuse reflectance scan. At the focal position, the distance between the light source and the sample was fixed and this compensated for the variation of the sample thickness. Each prepared area on the side surface of the stem was scanned at two adjacent locations and the average of two spectra represented the stem spectral information. So for each stem, two average spectra were acquired for further analyses.
FIGURE 1 Durian stem showing upper part, abscission zone, and lower part of stem.
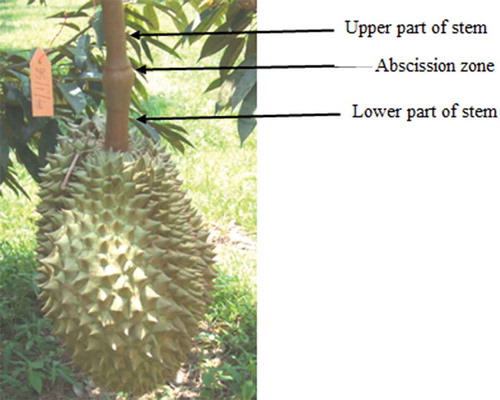
FIGURE 2 Photographs showing (a) the stem and (b) the rind placed in the sample holder. Knob rotations are used to move the samples horizontally and vertically to the focal position for irradiation as indicated by the needle.
Absorbance measurement of rind
Two fertile locules were chosen for the NIR acquisition.[Citation6] The spine at the middle part of each locule was cut close to the rind surface to provide a flat area for irradiation. The section of the rind containing the prepared surface was cut off the fruit and immediately positioned in the sample holder for the scan (). The sample holder was adjusted to position the rind to the focal irradiation. Two adjacent locations on the flat area of the sectional rind of each locule were scanned and the obtained spectra were averaged. Therefore, two average spectra were obtained from the rind for the analyses.
Absorbance measurement of pulp
The pulp of durian was also scanned for NIR spectral acquisition to obtain an indication of the maximum potential accuracy of the NIR model in predicting the dry matter content of the whole fruit. The middle segments of the pulp from two fertile locules were used in the measurements of NIR spectra.
Dry Matter Determination
During growth and maturation of “Monthong” durian, the dry matter of the durian pulp was reported to be a suitable (and in fact the best) index of maturity.[Citation25] As such, the dry matter of the pulp was referenced as a standard for the maturity index. Determination of the dry matter was carried out by taking the pulp from the middle segments of every locule (as used for NIR study on the pulp), cutting it into small pieces and thoroughly mixing. A sample of about 20 g of the mixed pulp was dried in a hot air oven at 70°C for 48 h.[Citation25] The dry matter percentage (%DM) was expressed as (w2/w1) × 100, where w1 is the original mass of the pulp (in grams) and w2 is the dried mass (in grams).
Statistical Analyses
Quantitative analysis
The spectral data were statistically analyzed to determine the dry matter content of the pulp by using partial least squares regression (PLSR; The Unscrambler v.9.8; Camo; Oslo, Norway). To reduce the scattering effect in the spectral data, various transformations on the original spectra were performed including the second derivative, standard normal variate, and the multiplicative scatter correction as well as combinations of transformations. The original spectral data and pretreated spectral data were analyzed as independent variables in the PLSR model development. Samples were split into two separate sets. The calibration set (100 samples) and the prediction set (44 samples) were purposively created to contain samples with comparable statistical distributions of the dry matter content (). The calibration set was used to build the PLSR models. Cross validation on the same data set was applied to determine the optimal number of latent variables in each model. The models were then tested on the prediction set for prediction performance. The predicted values were compared to the actual measured values; the statistical values of rp (correlation coefficient of prediction) and RMSEP (root mean square error of prediction) were used to evaluate the performance of the model. A further statistic, SDR, was used to indicate the relative predictive performance of a model as defined by McGlone and Kawano[Citation5] and expressed as follows:
TABLE 1 Summary of dry matter content of durian pulp
Qualitative analysis
Discriminant analysis was also performed to classify the durians into groups of maturity based on the spectral data for the prospective application to sort the immature durians from the mature durians. The main purpose of the analysis was thus to introduce NIR spectral data as the classifying variables in a linear discriminant analysis (SPSS, Version 9.0; Chicago, IL, USA) to categorize the durians into three predefined maturity groups. Discriminant analysis is a multivariate technique used to create linear functions of several variables that provides the maximum difference between two or more groups and keeps the variation within each group to a minimum.
Normally, “Monthong” durian fruit is considered mature from about 120 DAA.[Citation26] Durian samples were thus divided into three maturity groups (immature, early-mature, and mature). The immature group consisted of samples from 97 to 104 DAA, whereas the samples from 111 to 118 DAA were assigned to the early-mature group. The mature group therefore contained 125 to 132 DAA samples. For each DAA group of durian, based on %DM, samples were divided into a sub calibration class set (n = 12, which represented 50% of the whole sample set) and a sub prediction class set (n = 12). Both sets covered identical variation and uniform distribution of the %DM. With all DAA groups of durian combined together, the calibration set and the prediction set each contained 72 samples. The calibration set was used to build canonical discriminant functions whose corresponding statistical results were evaluated. The performance of classification in terms of the percentage of correct classification was validated on the prediction set.
RESULTS AND DISCUSSION
Effect of Maturity on Dry Matter Content
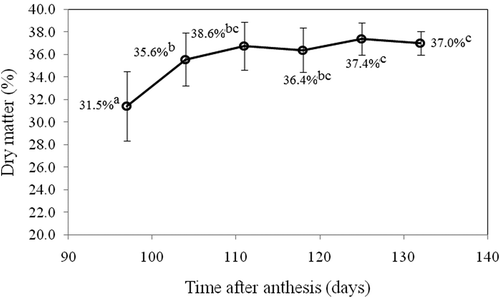
The average dry matter content was significantly (p < 0.05) affected by maturity between 97 DAA to 104 DAA (). The dry matter content increased at a higher rate from 97 DAA to 111 DAA and then leveled off toward 132 DAA (). The result was in agreement with the report by Sangwanangkul and Siriphanich.[Citation25] As stated previously, the “Monthong” durian cultivar normally reaches minimum maturity at an age of 106 DAA.[Citation25] This posed some difficulty in the harvest of fully mature fruit as durian with a DAA value greater than 106 showed little variation in the dry matter content. Durian fruit with minimum maturity (106 DAA) were reported to experience greater uneven ripening and higher variation in pulp firmness than more mature fruit.[Citation27]
FIGURE 3 Change in dry matter content of durian pulp with respect to number of days after anthesis (error bars represent standard deviations). Different lowercase superscripts indicate that the values are significantly different (p ≤ 0.05) by Duncan’s method.
Spectral Characteristics with Respect to Maturation
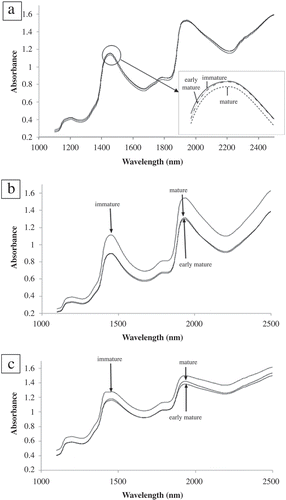
The mean NIR spectra of the pulp, the rind, and the stem are shown in , illustrating the amount of light absorbed at each wavelength between 1100 and 2500 nm. Generally, the spectra were predominantly characterized by strong absorption of water at 1940 and 1450 nm[Citation28] as well as weak absorption of water at 1200 nm.[Citation29] Weak absorption bands arising from C-H groups of lipids and protein N-H groups were also noticed in the proximity of 1800 nm.[Citation30]
FIGURE 4 Mean spectra using near-infrared spectroscopy of pulp, rind, and stem.
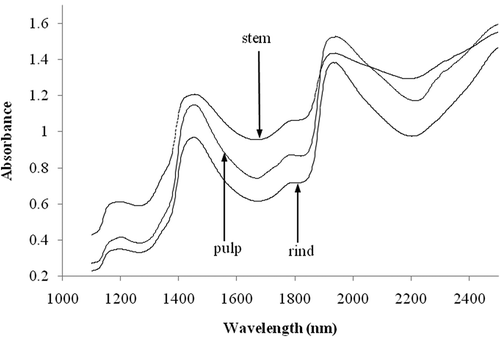
On average, the stem absorbed light greater than the pulp and the rind in a range between 1100 and 1940 nm (). The least absorbance was associated with the rind. The difference in surface characteristics could have been the possible cause of variation in scattering. The surface of the cut rind probably was smoother compared to the pulp and the peeled stem. This smooth surface produced more reflectance and thus, less absorbance.
The pulp and the rind exhibited a similar pattern of absorbance across all wavelengths (). For the stem, absorbance at wavelengths longer than 1940 nm was different from that of the pulp and the rind. The difference in the absorbance in the long wavelength region was speculated to be partially attributable to divergence in the oil content in the stem compared with that in the rind and the pulp.
To explore the maturity effect on the absorbance, the spectra were averaged for three different groups pertaining to the immature group (97 and 104 DAA), the early-mature group (111 and 118 DAA), and the mature group (125 and 132 DAA), respectively. A monotonic decrease in the pulp absorbance in a range of 1100 to 1500 nm was observed with maturation (). Likewise, as durian matured, the rind absorbed less light but over a slightly wider range of 1100 to 1900 nm (). However, an inconsistent increase in the absorbance of the stem with maturity was apparent from 1400 to 2500 nm ().
FIGURE 5 Variation with respect to maturation stages of mean spectra using near-infrared spectroscopy of: (a) pulp; (b) rind; and (c) stem.
Quantitative Analysis of the Dry Matter Content
PLSR calibration models were developed for the %DM prediction; the prediction statistics are listed in . The model based on durian pulp was used as a reference with respect to the prediction performance. The prediction statistics of the pulp model delivered an rp value of 0.83 with values of RMSEP of 1.61% and SDR of 1.76 for a %DM range of 25.41 to 38.97. As expected, the performance of the pulp model was superior to the models based on either the stem or rind spectra. The performance of the pulp model was comparable to the prediction of “Hass” avocado dry matter using Fourier transform, NIR spectroscopy, which provided values of RMSEP of 1.54% and SDR of 2.03 for a %DM range of 19.4 to 34.2.[Citation19]
TABLE 2 Statistical results of partial least squares regression for dry matter prediction based on spectral data of pulp, rind, and stem
The rind model provided relatively better performance (RMSEP = 1.82% and SDR = 1.55) than the PLSR model of the stem (RMSEP = 2.22% and SDR = 1.27) as shown in . As previously discussed, absorbance of the rind was more similar to that of the pulp than the stem as illustrated in . The similarity in the absorbance was the probable reason that the rind model was a better predictor for the dry matter content of the pulp than the stem model. Furthermore, this was also supported by a report that during maturation, the moisture content of the rind continuously decreased and was inversely correlated to the pulp moisture content.[Citation24]
In searching for effective absorbance band wavelengths, the regression coefficients of the pulp, the rind, and the stem models were explored as displayed in . For the pulp model (), the major regression coefficients of the model occurred around 1198 and 1720 nm which were associated with the C–H stretch second overtone and C–H stretch first overtone, respectively.[Citation31] The interesting assignable wavelengths for %DM prediction were 1908 (O–H stretch (starch) and C=O second overtone combination) and 1944 nm (water).[Citation31] Cellulose related wavelengths were observed at 1780 (C–H stretch first overtone), 1828 (O–H stretch/C–O stretch second overtone combination), and 2332 nm (C–H stretch/C–H deformation combination).[Citation31]
FIGURE 6 Regression coefficients of partial least squares regression model for: (a) pulp spectra pretreated with gap-segment second derivative (gap size = 3 and segment size = 19); (b) rind spectra pretreated with gap-segment second derivative (gap size = 1 and segment size = 19); and (c) stem spectra pretreated with gap-segment second derivative (gap size = 1 and segment size = 17).
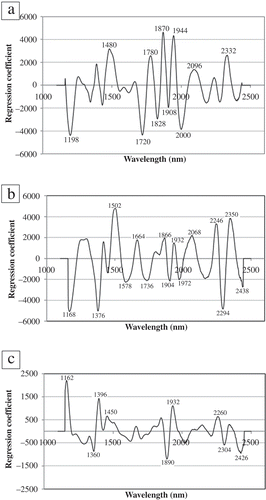
The largest regression coefficient for the rind model coincided with absorbance around 1168 nm (). The absorbance at 1168 nm is close to 1170 nm which was reported to be associated with the C–H stretch second overtone of the HC=CH structure of lipid.[Citation32] The assignable wavelengths of the rind model, which were correlated to the N–H functional group, were also found at 1502 (N–H stretch first overtone [protein]) and 1578 (N–H stretch first overtone).[Citation31] Similarly, the stem model showed the largest regression coefficient at 1162 nm () which was close to 1170 nm. Valleys were observed at 1904 and 1890 nm and there was a peak at 1932 nm ( and ) in the rind and stem regression coefficients, respectively, which corresponded to the 1908 nm valley and the 1944 nm peak of the pulp model. Other assignable wavelengths at 1360 and 1396 nm of the stem model were assigned to a C–H stretch/C–H deformation combination of CH3 and CH2 respectively.[Citation31]
Classification of Durian Maturity
Further study was undertaken to explore the practical application of stem spectra and rind spectral features for the classification. This application aimed to differentiate the properly matured durians from the immature ones. Discriminant analysis was performed to model the separation of immature durians from mature durians using the spectral information of the rind as well as the stem. shows that the complete spectral data of the rind provided better classification with overall accuracy of 87.5% compared to 75.0% using the complete spectral data of the stem. Simplification of the classification model was also carried out using only spectra at selected wavelengths. Effective wavelengths of the rind and the stem were selected from the corresponding regression coefficients of the rind PLSR model and the stem PLSR model in . For the rind model, wavelengths with absolute coefficients higher than 1800 (), were thus arbitrarily chosen from the regression coefficient of the second derivative spectra. Similarly, in the case of the stem, an absolute coefficient of 700 was used as a threshold to select important wavelengths () for the analysis. These spectral data were subjected to discriminant analysis as classification variables.
TABLE 3 Performance of classification into maturity classes based on rind and stem absorbance
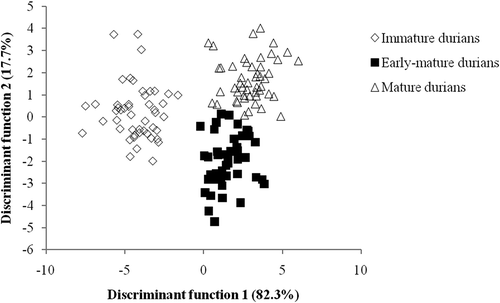
The classification performance of the simplified models was noticeably improved compared to the models using complete spectra, particularly in the case of the stem (). Generally, durian samples in the immature class were classified with higher accuracy than those in the early-mature and mature classes. It was hypothesized that integration of the spectral information from both the rind and stem would offer an improvement in the classification accuracy. Therefore, the selected wavelengths from the rind and the stem models were all introduced into the discriminant analysis. shows the performance of the discriminant model in the segregation of durian samples into immature, early-mature, and mature classes. The rind-stem discriminant model performed relatively well, obtaining an overall accuracy of 94.4% for the prediction set. Durian samples in the immature group were all correctly classified (100% accuracy) with the second best classification for the mature group (95.8%).
The factorial plot of both the first and second discriminant functions () showed clearly the separation of the immature class from the early-mature and mature classes along the first discriminant function which explained variance of 82.3%. The structure coefficients of each classification variable were studied for their contribution to the classification model. The structure coefficient indicates the correlation between each classification variable and each discriminant function,[Citation33] where a higher absolute value suggests the variable is better at discriminating between groups. From the structure coefficient, the greatest contribution to the first discriminant function was the second derivative spectral data of the stem at 1396 nm. A wavelength of 1396 nm was associated with a C–H combination (CH2).[Citation31] This suggested that the chemical composition of the stem at the immature stage was different from that at the mature stage. Further investigation of showed that the separation between early-mature and mature durians was complemented along the second discriminant function which accounted for 17.7% of the variance. The second derivative spectral data of the rind at 1972 nm provided the contributing variable of the greatest distinction in terms of the second discriminant function. The 1972 nm peak was consistent with the presence of an O–H stretch/O–H bend combination (starch).[Citation31] This implied that once matured, the difference in durian was attributed to chemical contents in the rind.
FIGURE 7 Scatter plot of durian samples at three maturity levels with respect to discriminant functions derived from variables selected from regression coefficients of the second derivative spectra of the rind and the stem.
CONCLUSIONS
NIRS was shown to be applicable to the evaluation of durian maturity. PLSR models were created from the spectral data of the rind as well as the stem. The rind PLSR model performed better in predicting the dry matter content than the stem PLSR model. However, the accuracy was relatively poor compared with that of the reference pulp PLSR model. In the classification of durian samples into immature, early-mature and mature classes based on DAA and %DM, the rind models were better than the stem models. The best classifying model, providing 94.4% accuracy of the classification, was created based on the combined use of the selected spectral data of the rind and the stem.
ACKNOWLEDGMENTS
The authors gratefully acknowledge the Postharvest Technology Innovation Center (PHTIC), the Commission on Higher Education, Bangkok, the Center of Excellence on Food Agricultural Machinery (Kasetsart University), and the Special Research Unit for Postharvest Engineering, Processing and Packaging of Fruit under the Kasetsart University Research and Development Institute (KURDI) for their support of this research.
REFERENCES
- Maninang, J.S.; Wongs-Aree, C.; Kanlayanarat, S.; Sugaya, S.; Gemma, H. Influence of maturity and postharvest treatment on the volatile profile and physiological properties of the durian fruit. International Food Research Journal 2011, 18 (3), 1067–1075.
- Pascua, O.C.; Cantila, M.S. Maturity indices of durian (Durio zibethinus Murray). Philippine Journal of Crop Science 1992, 17 (3), 119–124.
- Siriphanich, J. Durian (Durio zibethinus Merr.). In: Postharvest Biology and Technology of Tropical and Subtropical Fruits; Yahia, E.M.; Ed.; Woodhead Publishing Limited: UK, 2011; 80–114.
- Yantarasri, T.; Kalayanamitra, K.; Saranwong, S.; Sornsrivichai, J. Evaluation of the maturity index for durian fruit by various destructive and non-destructive techniques. In: Quality Assurance in Agricultural Produce; Johnson, G.L.; Le, V.T.; Nguyen, D.D.; Webb, M.C.; Eds.; ACIAR Proceedings, 2000; 100, 700–705.
- McGlone, V.A.; Kawano, S. Firmness, dry-matter, and soluble-solids assessment of postharvest kiwifruit by NIR spectroscopy. Postharvest Biology and Technology 1998, 13 (2), 131–141.
- National Bureau of Agricultural Commodity and Food Standard. Thai Agricultural Standard TAS 3-2003: Durian. In: The Royal Gazette, 120, 115D, dated October 2, B.E. 2546 (2003).
- He, Y.; Li, X.; Shao, Y. Fast discrimination of apple varieties using Vis/NIR spectroscopy. International Journal of Food Properties 2007, 10 (1), 9–18.
- Liu, F.; Yusuf, B.L.; Zhong, J.; Feng, L.; He, Y.; Wang, L. Variety identification of rice vinegars using visible and near infrared spectroscopy and multivariate calibrations. International Journal of Food Properties 2011, 14 (6), 1264–1276.
- Shen, F.; Ying, Y.; Li, B.; Zheng, Y.; Liu, X. Discrimination of blended Chinese rice wine ages based on near-infrared spectroscopy. International Journal of Food Properties 2012, 15 (6), 1262–1275.
- Liu, Y.; Ying, Y. Non-invasive method for internal quality evaluation of pear fruit using fiber-optic FT-NIR spectrometry. International Journal of Food Properties 2007, 10 (4), 877–886.
- Shao, Y.; He, Y.; Bao, Y.; Mao, J. NIR spectroscopy for classification of oranges and prediction of the sugar content. International Journal of Food Properties 2009, 12 (3), 644–658.
- Birth, G.S.; Dull, G.G.; Renfoe, W.T.; Kays, S.J. Non-destructive spectrophotometric determination of dry matter in onions. Journal of the American Society for Horticultural Science 1985, 110, 297–303.
- Jordan, R.B.; Walton, E.F.; Klages, K.U.; Seelye, R.J. Postharvest fruit density as an indicator of dry matter and ripened soluble solids of kiwifruit. Postharvest Biology and Technology 2000, 20 (2), 163–173.
- McGlone, V.A.; Jordan, R.B.; Seelye, R.; Martinsen, P.J. Comparing density and NIR methods for measurement of kiwifruit dry matter and soluble solids content. Postharvest Biology and Technology 2002, 26 (2), 191–198.
- Osborne, S.D.; Jordan, R.B.; Kunnemeyer, R. Using near infrared (NIR) light to estimate the soluble solids and dry matter content of kiwifruit. Acta Horticulturae 1998, 464, 109–114.
- Guthrie, J.; Walsh, K. Non-invasive assessment of pineapple and mango fruit quality using near-infrared spectroscopy. Australian Journal of Experimental Agriculture 1997, 37, 253–263.
- Clark, C.J.; McGlone, V.A.; Requejo, C.; White, A.; Woolf, A.B. Dry matter determination in “Hass” avocado by NIR spectroscopy. Postharvest Biology and Technology 2003, 29 (3), 301–308.
- Schmilovitch, Z.; Hoffman, A.; Egozi, H.; El-Batzri, R.; Degani, C. Determination of avocado maturity by near-infrared spectrometry. Acta Horticulturae 2001, 562, 175–179.
- Wedding, B.B.; White, R.D.; Grauf, S.; Wright, C.; Tilse, B.; Hofman, P.; Gadek, P.A. Non-destructive prediction of “Hass” avocado dry matter via FT-NIR spectroscopy. Journal of the Science of Food and Agriculture 2011, 91 (2), 233–238.
- McGlone, V.A.; Jordan, R.B.; Seelye, R.; Clark, C.J. Dry-matter—A better predictor of the post-storage soluble solids in apples? Postharvest Biology and Technology 2003, 28 (3), 431–435.
- Moons, E.; Sinnaeve, G.; Dardenne, P. Non-destructive visible and NIR spectroscopy measurement for determination of apple internal quality. Acta Horticulturae 2000, 517, 441–448.
- Renfu, L.; Daniel, E.G.; Randolph, M.B. Determination of firmness and sugar content of apples using near-infrared diffuse reflectance. Journal of Texture Studies 2000, 31, 615–630.
- Kavdir, I.; Lu, R.; Ariana, D.; Ngouajio, M. Visible and near-infrared spectroscopy for nondestructive quality assessment of pickling cucumbers. Postharvest Biology and Technology 2007, 44 (2), 165–174.
- Rutpralom, T.; Kumhom, P.; Chamnongthai, K. Non-destructive maturity determination of durian by using microwave moisture sensing. IEEE International Conference on Industrial and Technology (ICIT), Bangkok, Thailand, December 11–14, 2002; 155–158.
- Sangwanangkul, P.; Siriphanich, J. Growth and maturation of durian fruit cv. Monthong. Thai Journal of Agricultural Science 2000, 33 (1–2), 75–82.
- Chattavongsin, R.; Siriphanich, J. The relationship between fruit-stem stiffness and maturity of “Monthong” durians (Durio zibethinus L.). Acta Horticulturae 1990, 269, 217–222.
- Pakcharoen, A.; Tisarum, R.; Siriphanich, J. Factors affecting uneven fruit ripening in “Mon-thong” durian. Acta Horticulturae 2013, 975, 329–333.
- Viscarra Rossel, R.A.; McBratney, A.B. Laboratory evaluation of a proximal sensing technique for simultaneous measurement of soil clay and water content. Geoderma 1998, 85 (1), 19–39.
- Jacquemoud, S.; Ustin, S.L. Application of radiative transfer models to moisture content estimation and burned land mapping. Proceedings of the Fourth International Workshop on Remote Sensing and GIS Applications to Forest Fire Management, June 5–7, 2003; Chuvieco, E.; Martin, P.; Justice, C., Eds.; Ghent, Belgium; 2003; 3–12.
- McIntosh, L.M.; Summers, R.; Jackson, M.; Mantsch, H.H.; Mansfield, J.R.; Howlett, M.; Crowson, A.N.; Toole, J.W. Toward non-invasive screening of skin lesions by near-infrared spectroscopy. Journal of Investigative Dermatology 2001, 116 (1), 175–181.
- Osborne, B.G.; Fearn, T.; Hindle, P.H. Practical NIR Spectroscopy with Applications in Food and Beverage Analysis, 2nd Ed; Longman Scientific & Technical.: Singapore, 1993; 227.
- Law, D.P.; Tkachuk, R. Near-infrared diffuse reflectance spectra of wheat and wheat components. Cereal Chemistry 1977, 54, 256–265.
- Tabachnick, B.G.; Fidell, L.S. Using Multivariate Statistics. 3rd Ed; Harper Collins: New York, 1996; 630.