
Abstract
The concentrations of eight mineral elements were determined by inductively coupled plasma-atomic emission spectrometry in 48 grape wine samples to distinguish the wine origins from three districts in China. The results of principal component analysis indicated that the samples from Yinchuan city could be separated from Penglai and Changli cities. The samples could be clustered into three groups according to region of origin by cluster analysis with only two miss-cluster. The stepwise method of discrimination analysis with three mineral elements was able to 100% classify the original groups of all samples. Sr and Mn are characteristic elements for wines originating from Yinchuan city and Changli city, respectively, as determined from the results of Duncan multiple comparisons on the concentrations of Mn and Sr.
INTRODUCTION
Numerous mineral elements are found in wine with the majority originating from the grapes, which in turn absorb these elements from the local soils where the grapes are grown. Naturally, there are differences in the individual concentrations and the overall elemental profiles of soils from distinct geographical areas. Furthermore, mineral elements are not metabolized or modified during the fermentation process and may be considered good indicators of the wines geographical origin. Coetzee et al.[Citation1] studied wines from three important wine-producing regions, Stellenbosch, Robertson, and Swartland in the Western Cape Province of South Africa. In a step-wise discriminant analysis procedure, functions based on linear combinations of the log-transformed element concentrations of Al, Mn, Rb, Ba, W, and Tl were generated and were able to be utilized to correctly classify wines from each region. In an alternative approach, a pair-wise discriminant analysis procedure, not previously used in wine provenance studies, was also examined. In this procedure, the classification was done in three steps, with each step classifying a wine as coming from a certain region or not. The combination of elements characterizing wines from a particular region was different for each region. The discriminant functions were based on the following elements: Al, Mn, Rb, Ba, and W for Stellenbosch; Se, Rb, Cs, and Tl for Robertson and Al, Mn, Rb, Sr, Ba, and Tl for Swartland. Utilizing this type of classification process allowed the wines to be characterized by region with 100% confidence.[Citation1]
In another study, Iglesias et al.[Citation2] reported that a principal component analysis (PCA) of elemental concentrations could be utilized to differentiate wine samples from DO Empordà-Costa Brava (Catalonia, Spain) from wine samples from other wine-producing regions in Spain (i.e., Penedès, Somontano, and Rioja). It was found that Sr and Ba contents discriminate the two DO groups with a discriminant analysis function involving both variables distinguishing the two groups with a 100% classification rate. At the level of the leave-one-out cross-validation all of the Empordà-Costa Brava samples were well classified, whereas the other DO’s presented two borderline miss-classifications.[Citation2,] More recently, Galgano et al.[Citation3] investigated wines from three important wine-producing Southern Italian regions (Basilicata, Calabria, and Campania) and characterized the wines according to their content in macro-, micro-elements, and lanthanides. Elemental composition was utilized in multivariate statistical analysis to discriminate the wines according to geographical origin. A total of 61 elements were determined in 120 red wines produced in the years 2000–2002 with precisely 40 samples from each region. Results indicated that element analysis provides a good prospect for discriminating wines by regions, even if the element composition was not dependent on the year of production of wine. A canonical variate analysis showed that discrimination of wines by origin was possible based on the following elements: Ag, B, Ca, Cd, Eu, Fe, Ga, La, Lu, Mn, Nd, Pr, Sm, Th, Tm, V, Yb, and Zr for Basilicata; Al, B, Fe, Mg, Mn, Ti, Tl, Sc, and Zn for Calabria; and Ba, Eu, K, I, Rb, and Tl for Campania.[Citation3] The most common analytical methods employed to accurately determine the concentrations of mineral elements in wines include atomic absorption spectrometry (AAS),[Citation4] inductively coupled plasma-atomic emission spectrometry (ICP-AES)[Citation5,Citation6] and inductively coupled plasma-mass spectrometry (ICP-MS).[Citation4,Citation7−Citation9]
In China, reported studies on determining the concentrations of elements in wines vs their geographical origin are rare. Recently, Luo et al. determined the concentration of 26 trace elements in 20 wine samples produced from grapes from different production areas in Hebei (Huailai, Shacheng, and Changli). Analysis by discriminant and cluster analyses provided only for tentative conclusions to be drawn, due to the small data set, but did suggest that measuring trace elements in wines may be an effective way of distinguishing grape origins from different areas of the Hebei province.[Citation10] In China, individual studies for determining the concentrations of mineral elements in wines have been reported.[Citation11−Citation13]
We report herein that the abundance of four general macro- (K, Ca, Na, Mg) and four micro-elements (Fe, Zn, Sr, Mn) as determined by ICP-AES on wines prepared at the same winery utilizing different grape varieties over several vintages from different regions in China, coupled with multivariate statistical analysis may conveniently be used to classify the wines according to geographical origin. To date no such fingerprinting of the mineral profiles within the Shandong, Ningxia, and Hebei provinces of China have been reported.
MATERIALS AND METHODS
Sampling
A sample set of 48 wines (42 red wines and 6 white wines) were collected from one winery. All wines were produced with single variety grapes. The grapes were from three districts namely Penglai city (Shandong province), Yinchuan city (Ningxia province), and Changli city (Hebei province). The cultivars of the red wines consisted of Cabernet Sauvignon, Merlot, Shiraz, Carménère, and Yan73, while the white wines consisted of Sauvignon Blanc and Riesling. All wines were from the 2009–2012 vintages. None of the wines were fermented or aged in oak. Each was sampled in triplicate and stored in polyethylene terephthalate (PET) bottles before analysis as these are free of metal salts and allow one to avoid any possible contamination.
Apparatus and Reagents
A Varian 710-ES inductively coupled plasma atomic emission spectrometer was used to determine the concentrations of the eight mineral elements (Fe, Zn, Mn, Ca, K, Mg, Na, and Sr). The operational conditions were the same as described previously by Cheng and Liang.[Citation14] A microwave digestion oven (CEM Corporation) was used for sample decomposition. An ICP multi-element standard stock solution, which consisted of the above elements at 1000 mg/L concentrations of each element, was utilized for calibration. Working solutions of mineral elements were prepared daily by serial dilution of the stock solution with deionized water. The range of concentrations was determined depending on element variety. H2O2 and concentrated HNO3 were both from Merck (Merck KGaA, Darmstadt, Germany), analytical grade.
Sample Treatments and ICP-AES Measurements
In order to use aqueous calibration standards, the microwave digestion method was employed to remove the organic components within the samples. Five milliliters of wine sample was transferred into a fluorocarbon microwave vessel. Six milliliters of concentrated HNO3 and H2O2 (2 mL) were then added. The microwave digestion parameters: 1200 W power and 840 kPa pressure were employed for the digestion of samples at 200°C. Ramp time was 10 min and held for a further 10 min for a total digestion time of 20 min. After cooling, the mixture was quantitatively transferred to a 50 mL volumetric flask and made up to 50 mL total volume with deionized water. The ICP-AES semi-quantitative mode of analysis was employed for the determination of the concentrations of all eight elements. To ensure accurate analysis, a calibration reagent blank and instrument check were carried out together with the sample determination according to the procedures described by Jos et al.[Citation15] The data are summarized in .
Data Processing
All statistical calculations, including multivariate analysis of variance, PCA, cluster, and discrimination analyses were carried out with SPSS 19.0 software.
RESULTS AND DISCUSSION
Multivariate Analysis of Variance
Multivariate analysis of variance was carried out in order to compare the statistical difference among the 48 samples on the concentrations of each element. The results indicated that there were significant differences (P < 0.01) among the 48 samples and as such differences in mineral content could be employed to discriminate geographical origin. Furthermore, the results of Duncan multiple comparison on the concentrations of Mn indicated that all 13 samples of wines originating from Changli city were significantly higher than those from Penglai and Yinchuan cities (P < 0.01) and all 12 samples of wines originating from Yinchuan city were significantly higher in Sr levels than those from Penglai and Changli cities (P < 0.01). It seems that concentrations of Mn in the soils from Changli city are higher than those from Penglai and Yinchuan cities, with the Sr levels in the soils from Yinchuan city also being higher. Consequently, it appears that Mn concentrations may be used to discriminate the origin of wines from Changli city whilst Sr may be a characteristic element for wines originating from Yinchuan city.
TABLE 1 Concentration of eight elements in samples
PCA
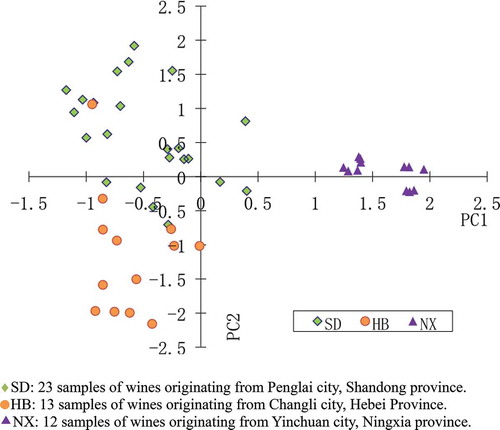
The results of PCA indicated that three principal components were extracted from eight variables with the calculated standard scores of PC1 and PC2 of each sample collated in . It can be seen that the 12 samples from Yinchuan city were clearly separated from those from Penglai and Changli cities. However, the significance of separation was not as clear for predicting wine origin for wines from Penglai and Changli cities.
FIGURE 1 Principal component analysis of the wine samples from Penglai city, Changli city and Yinchuan city.
Cluster Analysis
Hierarchical cluster analysis was applied to the 48 samples and the raw data standardized in the data range from 0 to 1. Seven hierarchical clustering methods (Baverage, Waverage, Single, Complete, Centroid, Median, and Ward’s) were evaluated with the results found to vary for each method of analysis. The best correlation was obtained by utilizing Ward’s method with the dendrogram being depicted in . At ten (measure interval: block), all samples were clustered into three groups according to their origin; only two samples (SDGM121 and HBCS126) were clustered into mistaken groups. Notably, 6 samples of white wines, grapes all from Penglai city, were clustered together with 16 samples of red wines produced from grapes from the same regions except sample SDGM121. All other hierarchical methods clustered all samples into either two groups or more than three groups indicating their inability to separate the data reliably.
FIGURE 2 The results of cluster analysis by Ward’s method, Measure (Interval: block).
Discrimination Analysis
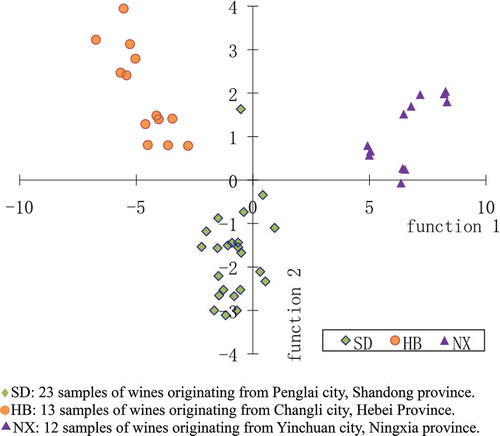
Two directions of discrimination analysis (“enter independents together” or “use step-wise method”) were also evaluated for their effectiveness to discriminate the data. At the same time, two methods (Fisher’s linear discriminant function and the Canonical discriminant function) are presented for each direction on the discrimination analysis. The results of first direction analysis showed that the eight types of mineral elements could discriminate well the different origin districts of all wine samples. By calculating group scores of each sample based on the coefficients of Fisher’s linear classification functions as collated in , the predicted results of original grouped samples were 100% correct. depicts the scores of function 1 and function 2 for each sample calculated by the Canonical discriminant function and it was found that the three geographical districts can be clearly separated. One hundred percent of the original grouped samples were correctly classified and 95.8% of cross-validated grouped samples were correctly classified with only two samples (SDGM121 and SDML121) being misclassified.
TABLE 2 Coefficients of Fisher’s linear classification function (enter independents together)
FIGURE 3 Results of Canonical Discriminant by entering independents together.
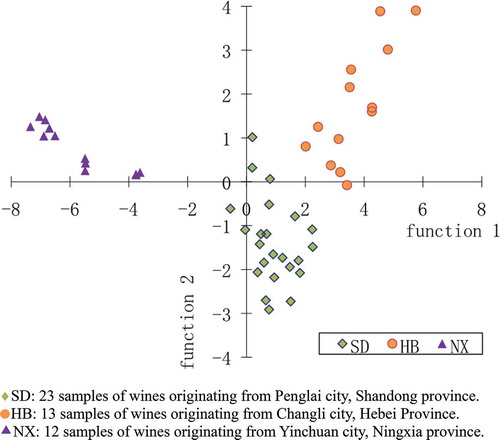
The results of second direction analysis indicated that just three types of elements (Sr, Mn, and K) could absolutely discriminate the different geographical districts of all samples. By calculating group scores of every sample based on the coefficients of Fisher’s linear classification function as summarized in , the predicted results of original grouped samples were 100% correct. depicts the scores of function 1 and function 2 for each sample calculated by the Canonical discriminant function and indicates that the three geographical districts are clearly separated. One hundred percent of the original grouped samples are correctly classified and 100% of the cross-validated grouped samples were also correctly classified.
TABLE 3 Coefficients of Fisher’s linear classification function (use stepwise method)
FIGURE 4 Results of Canonical Discriminant by using the stepwise method.
Based on the analyses mentioned above, Sr and Mn can be utilized as characteristic elements for predicting a wines origin from Yinchuan and Changli cities. Unlike the studies conducted in different regions of the Western Cape Province of South Africa, Spain, and Southern Italy where the concentration of multiple elements were needed in order to discriminate a wines geographical origin, it appears here that only one unique element may be utilized to distinguish a wines geographical origin from the Shandong, Ningxia, and Hebei provinces of China. It should be noted that wines that have been fermented or aged in oak are excluded from this approach of predicting the region of origin.
CONCLUSION
We have determined by analyzing the concentrations of eight mineral elements found in wines from various regions in China by ICP-AES coupled with various multivariate analyses that various elements can be used to predict the geographical source of the grapes utilized to make the wine. The results indicated that the “use step-wise method” of discrimination analysis was optimal for analysis and indicated that three types of mineral elements can 100% classify the groups independent of whether the Fisher’s linear discriminant or the Canonical discriminant functions are utilized in the cross-validation methods. Consequently, the mineral elements concentration can be used as a fingerprint to distinguish one wines origin from another in China. It was found that Sr is a characteristic element for wines originating from Yinchuan city and Mn is a characteristic element for wines originating from Changli city. Further work on analyzing the metal concentration of the soils of these regions is underway in order to determine if there is a strong correlation between metal element concentration in both the soil and the wines produced.
ACKNOWLEDGMENTS
The authors gratefully thank Mr. Liu Chunsheng and Ms. Xia Guangli for help with sampling, and Mr. Li Zhaoyong for the measurements with the ICP spectrometer.
REFERENCES
- Coetzee, P.P.; Steffens, F.E.; Eiselen, R.J.; Augustyn, O.P.; Balcaen, L.; Vanhaecke, F. Multi-element analysis of South African wines by ICP-MS and their classification according to geographical origin. Journal of Agricultural and Food Chemistry 2005, 53, 5060–5066.
- Iglesias, M.; Besalú, E.; Anticó, E. Internal standardization-atomic spectrometry and geographical pattern recognition techniques for the multi-element analysis and classification of Catalonian red wines. Journal of Agricultural and Food Chemistry 2007, 55, 219–225.
- Galgano, F.; Favati, F.; Caruso, M.; Scarpa, T.; Palma, A. Analysis of trace elements in southern Italian wines and their classification according to provenance. LWT-Food Science and Technology 2008, 41, 1808–1815.
- Catarino, S.; Madeira, M.; Monteiro, F.; Rocha, F.; Curvelo-Garcia, A.S.; de Sousa, R.B. Effect of bentonite characteristics on the elemental composition of wine. Journal of Agricultural and Food Chemistry 2008, 56, 158–165.
- Lara, R.; Cerutti, S.; Salonia, J.A.; Olsina, R.A.; Martinez, L.D. Trace element determination of Argentine wines using ETAAS and USN-ICP-OES. Food and Chemical Toxicology 2005, 43, 293–297.
- Mehmet, M.O.; Nesim, D.; Coşkun, S. Heavy metals bounding ability of pomegranate (Punica granatum) peel in model system. International Journal of Food Properties 2011, 14, 550–556.
- Elvira, S.V.; Susana, R.S.; Esperanza, F.G. Incidence of the winemaking technique on metal content and phenolic composition of red wines. International Journal of Food Properties 2013, 16, 622–633.
- Rossano, E.C.; Szilágyi, Z.; Malorni, A.; Pocsfalvi, G. Influence of winemaking ractices on the concentration of rare earth elements in white wines studied by inductively coupled plasma mass spectrometry. Journal of Agricultural and Food Chemistry 2007, 55, 311–317.
- Guillermo, G.; Juan, M.; Luis, G.; de Loos-Vollebregt, M.T.C. Ultratrace determination of Pb, Se, and As in wine samples by electrothermal vaporization inductively coupled plasma mass spectrometry. Analytica Chimica Acta 2009, 652, 154–160.
- Luo, M.; Liu, G.; Li, D.; Huang, W.; Zhan, J. Measurement and analysis of trace elements in grape wine produced by grape from different production area in Hebei. Liquor-Making Science and Technology 2010, 4, 87–89 (Chinese).
- Rui, Y.; Yu, Q.; Jin, Y.; Guo, J.; Luo, Y. Application of ICP-MS to the detection of 40 elements in wine. Spectroscopy and Spectral Analysis 2007, 27, 1015–1017 (Chinese).
- Yang, Y.; Du, H.; Li, W.; Pan, Q. Quick determination of 57 mineral elements in wines by inductively coupled plasma mass spectrometry (ICP-MS). Sino-Overseas Grapevine and Wine 2010, 5, 4–9 (Chinese).
- Deng, C.; Peng, Y.; Wang, X.; Li, L. Determination of 14 metal elements before and after the ultrafiltration of snow lotus wine. China Brewing 2011, 8, 172–175 (Chinese).
- Cheng, J.; Liang, C. The variation of mineral profiles from grape juice to monovarietal cabernet sauvignon wine in the vinification process. Journal of Food Processing and Preservation 2012, 36, 262–266.
- Jos, A.; Moreno, I.; González, A.G.; López-Artíguez, M.; Cameán, A.M. Study of the mineral profile of Catalonian “brut” cava using atomic spectrometric methods. European Food Research and Technology 2004, 218, 448–451.