
Abstract
Heat sterilization destroys the color, smell, taste, and nutrients of food. Pulsed electric field can effectively kill microorganisms for many foods at room temperature without compromising sensory and nutritional quality. The effect of pulsed electric field on the sterilization rates of Escherichia coli and Saccharomyces cerevisiae was investigated. The fundamental mechanism of pulsed electric field sterilization on S. cerevisiae was briefly discussed. The inactivation of E. coli and S. cerevisiae increased as the electric field strength and treatment time increased. Pulsed electric field treatments at 35 kV/cm and 90 μs reduced S. cerevisiae and E. coli by 5.30 and 5.15 log numbers, respectively. The inactivation of E. coli and S. cerevisiae was not remarkable at increased conductivity and the same electric field strength. Concaves and holes in S. cerevisiae cell surface, protoplast deletion, overflow of substances from cells, and denatured DNA were observed. These results supported the hypothesis of “membrane perforation” to explain the mechanism underlying pulsed electric field sterilization.
INTRODUCTION
Heat sterilization is a key process in traditional food production. However, heat sterilization destroys the color, smell, taste, and nutritional quality of food. With the improvement in living standards, consumers have a higher demand for food nutrition,[Citation1] sensory quality, color, and flavor.[Citation2] Pulsed electric field (PEF), a non-thermal sterilization technology, is attracting great scientific interest because of its many advantages, such as low nutritional damage,[Citation3] flavor, color, minimal temperature changes, energy efficiency, and environmental protection.[Citation4−Citation7] The inactivation effect of PEF is dependent on treatment parameters, product characteristics, and microbial species. The inactivation of PEF on bacteria was recently studied,[Citation7−Citation9] and PEF can inactivate a variety of microorganisms. However, the mechanism underlying PEF sterilization remains uncertain. Most researchers believe that the direct cause of cell inactivation is PEF, which causes irreversible cellular injury. When a microorganism is placed in PEF, the cell membrane undergoes electroporation[Citation10] or electroosmosis.[Citation11] Moreover, the microbial cell membrane ruptures, and cell membrane permeability changes. Thus, microbial death occurs.[Citation12,Citation13] So, the effect of PEF on the sterilization rates of Escherichia coli and Saccharomyces cerevisiae was investigated in this article. The fundamental mechanism of PEF sterilization on S. cerevisiae sterilization was briefly discussed. This study is significant in applying non-thermal sterilization technologies in the food industry and will have a great impact on sterilization mechanism of PEF.
Square wave, exponential wave, and alternating wave can be used in a PEF processing system.[Citation14] A square wave produces optimal effects. A square wave can yield the maximum voltage on microorganisms in the entire pulse width, reduce heat loss, and produce in a stronger lethal effect.[Citation15] PEF treatment was performed using a laboratory-scale pulse generator system (designed by Tsinghua University and China Agricultural University). Some equipment parameters, such as field strength, treatment time, and conductivity, were analyzed.
MATERIALS AND METHODS
Materials and Reagents
Identification of strain
Escherichia coli, a typical Gram-negative bacterium that is the most common enteric pathogen, is one of the most common target bacterias in food testing. Saccharomyces cerevisiae is a fungus that is eaten directly by humans, and can grow under acidic conditions. In this investigation, E. coli and S. cerevisiae strains were purchased from China General Microbiological Culture Collection Center (CGMCC), and the species numbers were CGMCC 1.90 (E. coli) and CGMCC 2.604 (S. cerevisiae).
PEF treatment system
PEF treatment was performed using a laboratory-scale pulse generator system (designed by Tsinghua University and China Agricultural University). A schematic of the apparatus used in this study is shown in . This apparatus included a high-voltage pulse treatment chamber, peristaltic pump, and UV cabinet. The pipeline of the instrument was cleaned with 4 g/100 mL sodium hydroxide for 15 min, a volume fraction of 10% sodium hypochlorite disinfectant for 15 min, and sterile distilled water for 20 min. The sterile operation cabinet was subjected to UV sterilization for 30 min to ensure an aseptic environment.
FIGURE 1 PEF processing.
Other equipment and reagents
A FACS Calibur flow cytometer was provided by Becton Dickinson Company (Sweden). A transmission electron microscope (TEM) and scanning electron microscope (SEM) were provided by Olympus Company (Japan). Propidium iodide (PI) and acridine orange (AO) were provided by Sigma Company (USA). Other reagents were provided by Beijing Blue Eagle Reagent Co., Ltd., China.
Methods
Culture and determination of strain
E. coli from the solid medium was inoculated into nutrient broth at 37°C. The culture was shaken for 14 h, and cultured to a stable growth period until the cell concentration reached 109 to 1010 CFU/mL. Approximately 1 mL of liquid bacterial culture was thoroughly mixed in 200 mL of sterile water. The concentration of the liquid bacterial culture was 107 to 108 CFU/ mL. S. cerevisiae from the solid medium was inoculated into yeast extract medium at 30°C. The culture was shaken for 16 h, and left to grow to a stable growth period. Approximately 5 mL of liquid bacterial culture was thoroughly mixed in 200 mL of sterile water, which resulted in a bacterial concentration of 107 to 108 CFU/mL.
The plate count method was used in this study.[Citation16] Liquid bacterial cultures with and without PEF treatment were inverted on plates. E. coli was cultured in nutrient agar medium for 48 h at 37°C, and cells were counted. S. cerevisiae was cultured for 48 h at 30°C, and cells were counted. The death rate lg s indicates the bactericidal effect of PEF treatment:[Citation17]
PEF inactivation parameters
E. coli and S. cerevisiae were studied with electric field strengths of 20, 25, 30, and 35 kV/cm. The processing times were 30, 60, and 90 μs, whereas the conductivities were 0.5, 1.0, 1.4, and 1.8 ms/cm. The waveform was a unipolar square wave. Electric field strength (E) and total processing time (t) were calculated using the following formula:[Citation8]
Effect of PEF on S. cerevisiae Cell Membrane, Protein, and DNA
Observed by SEM
S. cerevisiae was fixed with 2.5% glutaraldehyde overnight at 4°C, rinsed three times with phosphate buffer, and dehydrated in ethanol (30, 50, 70, and 90% for 20 min; 100% of ethanol twice for 20 min). Samples were placed in 30, 50, 70, 90, and 100% of tert-butyl alcohol (ethanol preparation) for 10 to 15 min. Finally, the samples were vacuum-dried, sprayed with gold, and observed. The accelerating voltage of the electron beam was 5 kV, and magnification was 1.3 k times.
Observed by TEM
S. cerevisiae was fixed with 2.5% glutaraldehyde for 2 h at 4°C, and rinsed five times with phosphate buffer for 7 min. S. cerevisiae was then fixed with 1% osmium tetroxide for 2 to 3 h, and rinsed three times with phosphate buffer for 7 min. The samples were dehydrated in ethanol (30, 50, 70, 85, and 90% for 15 min; 100% ethanol twice for 15 min) and saturated solution (ethanol: embedding solution = 1:1 for 2 h). The samples were embedded in pure embedding liquid for 24 h, and then embedded again for 2 h. Samples were cut into thin slices, stained, and observed.[Citation18]
Amount of UV-absorbing materials from S. cerevisiae leaked into the suspension after PEF
S. cerevisiae cells with and without PEF treatment were centrifuged at 5000 r/min for 5 min. The supernatant was measured at optical density (OD) values of 280 and 260 nm. All samples were measured three times.
Observation of S. cerevisiae membrane using flow cytometry (FCM)
Approximately 30 μL of 0.1 mg/mL PI staining solution was added to 0.5 mL of S. cerevisiae cells with and without PEF treatment (the concentration of liquid bacterial culture was 107 to 108 CFU/mL). The samples were placed in the dark at 37°C for 10 min, filtered using a 300 mesh copper net, and detected by FCM. PI produced a red fluorescence at 630 nm after excitation. This signal could be used to detect cell membrane integrity, and determine the amount of cell death.
DNA denaturation of S. cerevisiae by FCM
Approximately 30 μL of 0.1 mg/mL AO staining solution was added into 0.5 mL of S. cerevisiae cells with and without PEF treatment (the concentration of liquid bacterial culture was 107 to 108 CFU/mL). The samples were placed in the dark at 37°C for 10 min, filtered using a 300 mesh copper net, and detected by FCM.[Citation19]
Statistical Analyses
The experiments in this study were performed in triplicate, and the results are expressed as mean ± SD. All statistical analyses were performed using SPSS 16.0 statistical software. All experiments were replicated three times.
RESULTS AND DISCUSSION
Inactivation of PEF on E. coli and S. cerevisiae
Influence of PEF field strength and treatment time
and show the effects of electric field intensity and treatment time on the inactivation of E. coli and S. cerevisiae at a conductivity of 1.0 mS/cm. The electric field intensities were 20, 25, 30, and 35 kV/cm, and the processing times were 30, 60, and 90 μs. When the electric field intensity was constant, the inactivation effect of PEF on E. coli and S. cerevisiae increased with increasing treatment time ( and ). When the treatment time was constant, the inactivation effect of PEF on E. coli and S. cerevisiae increased with increasing electric field intensity. When the electric field strength was 35 kV/cm and the treatment time was 90 μs, the total number of E. coli colonies declined by 5.15 log numbers, whereas the total number of S. cerevisiae colonies declined by 5.30 log numbers.
FIGURE 2 Inactivation of PEF on E. coli and S. cerevisiae: (a) E. coli, electric field strength, treatment time; (b) S. cerevisiae, electric field strength, treatment time; (c) E. coli, electric field strength, conductivity; (d) S. cerevisiae, electric field strength, conductivity.
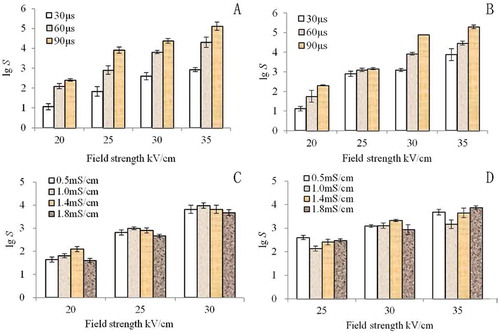
After analysis, the increase in electric field intensity and treatment time significantly promoted death, and the electric field intensity and treatment time had a significant inactivation effect on both E. coli and S. cerevisiae. Thus, the electric field intensity and treatment time were the main factors in the bactericidal effect of PEF.[Citation20] Differences in the types of microorganisms, cell wall composition, and cell membrane structure resulted in different sensitivities to the electric field. Thus, the sterilization effects of PEF varied. Under the same sterilization conditions, the death rate of yeast was higher than that of E. coli, and yeast was more sensitive to PEF ( and ). These results were consistent with the findings of Qin and Evrendilek[Citation15,Citation21] When the cells were in the external electric field, they could produce a transmembrane potential (TMP). When TMP reached 1 V, the membrane broke down. This potential value was referred to as the breakdown potential.[Citation10]
Based on the mathematical model U (t) = 3/2rEcosθ, which Neumann and Zimmermann developed, in a uniform field strength (E), the cells with radius (R) are large, and can easily achieve membrane breakdown potential and death. S. cerevisiae cells are large (1 to 5 × 5 to 30 μm) and have long cell diameters. E. coli cells are small (0.85 × 3 μm) and have short cell diameters. Thus, the electric field response of S. cerevisiae was more sensitive than that of E. coli.[Citation22,Citation23] In addition, the composition and thickness of both cell wall and membrane differed. The cell wall of S. cerevisiae is mainly composed of glucan and mannan, whereas that of E. coli is mainly composed of peptidoglycan, outer membrane, outer membrane protein, and periplasmic space. The cell wall of E. coli is tougher than that of S. cerevisiae. Therefore, E. coli had a higher tolerance to PEF.
Influence of PEF field strength and conductivity
As shown in and , the inactivation effect of PEF on E. coli and S. cerevisiae increased when the electric field strength increased. However, at the same electric field strength, no significant inactivation effect of PEF on E. coli and S. cerevisiae was observed as the conductivity increased. This result was consistent with the findings of Alvarz et al.,[Citation24] who reported that conductivity does not affect PEF inactivation of microorganisms at the same electric field intensity. The increase in the conductivity reduced the PEF inactivation of microorganisms.
First, the increased electrical conductivity caused a deformity in the square wave, and increased its rising time. The effect on the pulse width could not be ignored, so the effective duration of action decreased. Second, conductivity determined the resistance of the treatment chamber, thereby allowing the decrease in electric field strength and fluctuation of material temperature. Third, greater conductivity caused more density input energy, which resulted in a better PEF inactivation effect. Thus, conductivity was an important factor in the PEF sterilization effect. Its effect on PFE was relatively complex, and requires further investigation.[Citation25] The relationship between conductivity and PEF sterilization requires further research.
PEF Sterilization Mechanism
Holes of S. cerevisiae observed using SEM
shows SEM image of PEF-treated S. cerevisiae cells. S. cerevisiae cells without PEF treatment were plump, with a smooth and defect-free surface. S. cerevisiae cells with PEF treatment exhibited changes in form, a rough cell surface, folds, dents, and even holes. PEF-treated S. cerevisiae cells had an increasing tendency to develop bud scars. The dents and holes resulted from the increase in TMP, which was due to the electric field. Thus, cells exhibited the “membrane perforation” phenomenon. In membrane perforation, the bilayer cell membrane has equivalent capacitance, and the difference between intracellular and extracellular pressure is generally 10 mV. The charge distribution in the membrane caused different values of pressure. When an external electric field was applied across the cell, the TMP increased, and the ions of opposite polarity on both sides of the membrane caused a force of mutual attraction. This force “squeezed” both sides of the membrane. With the increase in electric field intensity or treatment time, the TMP continued to increase. Thus, the force of mutual attraction also continued to rise. During this period, the cell membrane produced a sticky, elastic, resilient material against the force. Given that the squeezed force increased much faster than the resilient material produced by the cell membrane, the cell membrane thickness significantly decreased. When the TMP was 1 V, the cell membrane was locally destroyed, which created a micropore. However, cells exhibited a self-healing capability. If the pore could heal itself and clog, this process was referred to as “reversible electrical breakdown.” If the electric field continued to increase and surpassed the critical electric field intensity, many large pores could form, and “reversible electrical breakdown” could become “irreversible electrical breakdown.”[Citation10] The cell membrane could cause mechanical breakage, and result in cell death. In this experiment, the holes in the surface of PEF-treated S. cerevisiae cells, as shown by SEM, supported the “membrane perforation” hypothesis.
FIGURE 3 SEM image of PEF-treated cells of S. cerevisiae: (a) control; (b) PEF-treated cells (30 kV/cm, 60 μs); (c) PEF-treated cells (35 kV/cm, 90 μs).
Observation of S. cerevisiae using TEM
shows TEM images of PEF-treated S. cerevisiae cells. S. cerevisiae cells without PEF treatment were plump, with a clear, damage-free protoplast. PEF-treated S. cerevisiae cells exhibited protoplast aggregation, deletion, and plasmolysis. Thus, PEF could not only damage the cell membrane, but also affected the inner structure of the cell.[Citation26,Citation27] Electron microscopy could directly and qualitatively reflect the injury to cell membrane by PEF, but it could not prove whether PEF causes the loss of or destroys the main physiological activator (e.g., protein and DNA) inside cells. Thus, follow-up experiments were performed.
FIGURE 4 PEF-treated cells of S. cerevisiae observed using TEM: (a) control; (b) PEF-treated cells (30 kV/cm, 60 μs); (c) PEF-treated cells (35 kV/cm, 90 μs).
Amount of UV-absorbing materials from S. cerevisiae leaked into the suspension after PEF treatment
Conjugated double bonds exist in tyrosine and tryptophan residues of protein. The absorption peak of the conjugated double bond is at 280 nm. The absorption peak of purine, pyrimidine, nucleoside, and nucleotide in nucleic acid is at 260 nm. The absorbance is proportional to the content. This method can be used for the quantification of proteins and nucleic acids.
shows the effect of electric field intensity on the UV absorption substances of S. cerevisiae cells. After PEF treatment, the absorbance values of the liquid flowing out of S. cerevisiae cells significantly increased at 260 and 280 nm. When the processing time was 60 μs, the values for electric field strength were 20, 25, 30, and 35 kV/cm at 260 and 280 nm. The absorption values increased by 0.280, 0.342, 0.382, 0.950 and 0.246, 0.268, 0.344, 0.654, respectively. With the increase in electric field strength, the absorbance values at 260 and 280 nm gradually increased, which indicates the increase in the amounts of extracellular protein and nucleic acid increased, as well as the spillage of intracellular material. When microbial cells were subjected to lethal or sublethal stress, the cell membrane exhibited damage. Some substances, such as amino acids, peptides, and ions, were detected in the external environment. This result suggests that the cell membrane was damaged. Among the intracellular substances detected, the majority were UV-absorbing materials.[Citation28]
TABLE 1 Amount of UV-absorbing materials from S. cerevisiae leaked into the suspension after PEF treatment
S. cerevisiae contains proteins and nucleic acids in vivo. When cells undergo normal metabolism, these macromolecules cannot enter the cell membrane and cell wall. When the cell was in high-voltage PEF, the membrane exhibited pathological destruction and damage, increased cell membrane permeability, and irreversible holes, which resulted in an overflow of macromolecules through the pores. The mechanism underlying PEF sterilization, namely, the “membrane perforation” hypothesis, was further confirmed.[Citation13]
Observation of S. cerevisiae membrane using FCM
and show the FCM results of S. cerevisiae after PEF treatment. After treatment, the Gate value and mean fluorescence intensity of S. cerevisiae cells varied significantly (P < 0.05). The M1 zone was rarely observed in the control group, and only reached 2.87%. The fluorescence intensity was relatively weak with a small amount of fluorescent cells. Cells in the M1 zone gradually increased after PEF treatment. When the electric field intensities were 25, 30, and 35 kV/cm, and the processing time was 90 μs, the Gate values of the M1 zone in yeast liquid were 31.36, 40.24, and 59.21%, respectively. The fluorescence intensity increased, as well as the proportion of fluorescent cells to the total number of cells. When the electric field intensity was 30 kV/cm, and the processing time was 30, 60, and 90 μs, the Gate values of the M1 zone were 7.08, 21.12, and 40.24%, respectively. The fluorescence intensity was strengthened, which was similar to the proportion of fluorescent cells to the total number of cells.
TABLE 2 FCM result of S. cerevisiae after PEF treatment
PI is a common DNA dye, and a fluorescent intercalating dye. PI could be embedded to the DNA/RNA helix structure alternatively and quantitatively to combine with nucleic acids in presenting a red color under fluorescence. PI is also membrane-impermeable, which indicates that PI cannot enter the cell through an intact cell membrane. Only when the cell membrane was damaged could PI enter the cell through this broken section, and bind to nucleic acid showing red color under fluorescence. Therefore, PI staining could be used to investigate the damaging effect of PEF treatment on the cell membrane of microorganisms. The majority of cells in the control group were living cells, so only a small part of cells could be dyed by PI. For S. cerevisiae after PEF treatment, PI could enter the cells to bind to nucleic acids and dye them, which resulted in the decrease in fluorescent cells and strengthened fluorescence intensity. Thus, the cell membrane of S. cerevisiae was damaged after PEF treatment. The Gate value of S. cerevisiae significantly varied after treatment with different electric field intensities at high-voltage PEF and processing times, which indicates that PI staining could reflect the relationship between the level of cell damage and electric field intensity (P < 0.05).
Observation of DNA denaturation in S. cerevisiae by FCM
AO presented green fluorescence when applied onto double-stranded DNA, but presented red fluorescence when applied onto single-stranded RNA or denatured single-stranded DNA. By detecting different fluorescence signals, we could determine the denaturation of DNA. The percentage of red fluorescence in the total fluorescence (green and red) indicates the proportion of denatured DNA in cells.[Citation19]
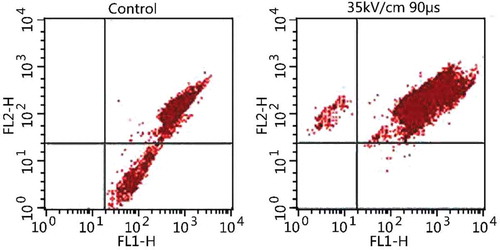
shows the denaturation of DNA in S. cerevisiae cells after PEF treatment by FCM. In untreated S. cerevisiae, the green fluorescent cells comprised 25.27% of the total cells, and no S. cerevisiae cells were observed in the red fluorescent area. For S. cerevisiae with PEF treatment at 35k V/cm and 90 μs, the red fluorescent cells increased to 0.96% of the total number of cells, whereas the green fluorescent cells decreased to 0.12% of the total number of cells.[Citation29] This result suggests the denaturation of DNA in some cells after PEF treatment, so the red fluorescent cells increased. In addition to membrane perforation, whether other synergy lead to cell death needs further research and demonstration.
FIGURE 6 Effect of PEF treatment on the DNA denaturation in S. cerevisiae cells. Upper left and lower right corners represent red and green fluorescence, respectively. The upper right corner represents the red and green fluorescent coexisting region.
CONCLUSION
PEF had a remarkable inactivation effect on E. coli and S. cerevisiae. With the increase in the electric field intensity and treatment time, the inactivation effect was enhanced. The total number of E. coli and S. cerevisiae colonies decreased by 5.15 and 5.30 log numbers, respectively, after PEF treatment at 35 kV/cm and 90 μs. Under the same conditions, the sterilization rate of S. cerevisiae after PEF was higher than that of E. coli. Thus, S. cerevisiae was more sensitive to PEF. Moreover, S. cerevisiae cells exhibited depression and holes in surfaces, deformation of intracellular protoplast, aggregation, deletion, and plasmolysis. After PEF treatment, S. cerevisiae cells exhibited extravasation of intracellular macromolecules (i.e., proteins and nucleic acids), change in cell membrane permeability, and DNA denaturation. These results support the “membrane perforation” hypothesis, which possibly explains the mechanism underlying PEF sterilization.
FUNDING
This work was supported by the Fundamental Research Funds for the Central Universities of China (Nos. BLYJ201310 and BLX2013020), the National Natural Science Base Fund (No. J1103516), and the National Natural Science Foundation (Nos. 31271981 and 31471593).
Additional information
Funding
REFERENCES
- Cheng, X.; Zhang, J.; Ding, T.; Wei, Z.; Li, H.; Wang, Z. The effect of an electric field on the thermomechanical damage of nodular defects in dielectric multilayer coatings irradiated by nanosecond laser pulses. Light-Science & Applications 2013, 2, e80.
- Lopez-Alfaro, I.; Gonzalez-Arenzana, L.; Lopez, N.; Santamaria, P.; Lopez, R.; Garde-Cerdan, T. Pulsed electric field treatment enhanced stilbene content in Graciano, Tempranillo, and Grenache grape varieties. Food Chemistry 2013, 141, 3759–3765.
- Zhang, Y.Y.; Hou, Y.X.; Zhang, Y.; Chen, J.; Chen, F.; Liao, X.J.; Hu, X.S. Reduction of diazinon and dimethoate in apple juice by pulsed electric field treatment. Journal of the Science of Food Agriculture 2012, 92, 743–750.
- Jeyamkondan, S.; Jayas, D.S.; Holley, R.A. Pulsed electric field processing of foods: A review. Journal of Food Protection 1999, 62, 1088–1096.
- Evrendilek, G.A.; Altuntas, J.; Sangun, M.K. Apricot nectar processing by pulsed electric fields. International Journal of Food Properties 2013, 16, 216–227.
- Vega-Mercado, H.; Martin-Belloso, O.; Qin, B.-L.; Chang, F.J.; Marcela Góngora-Nieto, M.; Barbosa-Canovas, G.V.; Swanson, B.G. Non-thermal food preservation: Pulsed electric fields. Trends in Food Science & Technology 1997, 8, 151–157.
- Xing-long, X.; Cong-cong, L.; Yang, Q.; Yi-gang, Y.; Hui, W. Molecular monitoring of Escherichia coli O157: H7 sterilization rate using qPCR and propidium monoazide treatment. Letters in Applied Microbiology 2013, 56, 333–339.
- Jian, C.; Xiaoyun, T.; Aidong, S. Influence of pulsed electric field and thermal treatments on the quality of blueberry juice. International Journal of Food Properties 2014, 17, 1419–1427.
- Oule, K.M.; Dickman, M.; Arul, J. Properties of orange juice with supercritical carbon dioxide treatment. International Journal of Food Properties 2013, 16, 1693–1710.
- Zimmermann, U. Electrical Breakdown, Electropermeabilization, and Electrofusion. Reviews of Physiology, Biochemistry and Pharmacology 1986, 105, 176–256.
- Castro, A.J.; Barbosa-Canovas, G.V.; Swanson, B.G. Microbial inactivation of foods by pulsed electric fields. Journal of Food Processing and Preservation 1993, 17, 47–73.
- Tian, Q.; Giusti, M.M.; Stoner, G.D.; Schwartz, S.J. Screening for anthocyanins using high-performance liquid chromatography coupled to electrospray ionization tandem mass spectrometry with precursor-ion analysis, product-ion analysis, common-neutral-loss analysis, and selected reaction monitoring. Journal of Chromatography A 2005, 1091, 72–82.
- Hurst, A. Bacterial injury: A review. Canadian Journal of Microbiology 1977, 23, 935–944.
- Barsotti, L.; Cheftel, J. Food processing by pulsed electric fields. II. Biological aspects. Food Reviews International 1999, 15, 181–213.
- Qin, B.-L.; Zhang, Q.; Barbosa-Canovas, G.V.; Swanson, B.G.; Pedrow, P.D. Inactivation of microorganisms by pulsed electric fields of different voltage waveforms. Dielectrics and Electrical Insulation, IEEE Transactions on Dielectrics and Electrical Insulation 1994, 1, 1047–1057.
- Reineke, K.; Mathys, A.; Knor, D. Shift of pH-value during thermal treatments in buffer solutions and selected foods. International Journal of Food Properties 2011, 14, 870–881.
- Waite-Cusic, J.G.; Diono, B.H.S.; Yousef, A.E. Screening for listeria monocytogenes surrogate strains applicable to food processing by ultrahigh pressure and pulsed electric field. Journal of Food Protection 2011, 74, 1655–1661.
- Vallverdu-Queralt, A.; Odriozola-Serrano, I.; Oms-Oliu, G.; Lamuela-Raventos, R.M.; Elez-Martinez, P.; Martin-Belloso, O. Impact of high-intensity pulsed electric fields on carotenoids profile of tomato juice made of moderate-intensity pulsed electric field-treated tomatoes. Food Chemistry 2013, 141, 3131–3138.
- Mir, L.M.; Bureau, M.F.; Gehl, J.; Rangara, R.; Rouy, D.; Caillaud, J.M.; … Scherman, D. High-efficiency gene transfer into skeletal muscle mediated by electric pulses. Proceedings of the National Academy of Sciences of the United States of America 1999, 96, 4262–4267.
- Arroyo, C.; Cebrian, G.; Pagan, R.; Condon, S. Resistance of enterobacter sakazakii to pulsed electric fields. Innovative Food Science & Emerging Technologies 2010, 11, 314–321.
- Evrendilek, G.A.; Zhang, Q.H. Effects of pulse polarity and pulse delaying time on pulsed electric fields-induced pasteurization of E. coli O157: H7. Journal of Food Engineering 2005, 68, 271–276.
- Damar, S.; Bozogğlu, F.; Hızal, M.; Bayındırlı, A. Inactivation and injury of Escherichia coli O157: H7 and Staphylococcus aureus by pulsed electric fields. World Journal of Microbiology and Biotechnology 2002, 18, 1–6.
- Sale, A.; Hamilton, W. Effects of high electric fields on microorganisms: I. Killing of bacteria and yeasts. Biochimica et Biophysica Acta (BBA)-General Subjects 1967, 148, 781–788.
- Alvarez, I.; Raso, J.; Palop, A.; Sala, F.J. Influence of different factors on the inactivation of Salmonella senftenberg by pulsed electric fields. International Journal of Food Microbiology 2000, 55, 143–146.
- Mosqueda-Melgar, J.; Elez-Martinez, P.; Raybaudi-Massilia, R.M.; Martin-Belloso, O. Effects of pulsed electric fields on pathogenic microorganisms of major concern in fluid foods: A review. Critical Reviews in Food Science and Nutrition 2008, 48, 747–759.
- Harrison, S.L.; Barbosa-Cánovas, G.V.; Swanson, B.G. Saccharomyces cerevisiae structural changes induced by pulsed electric field treatment. LWT-Food Science and Technology 1997, 30, 236–240.
- Jayaram, S.; Castle, G.; Margaritis, A. Kinetics of sterilization of Lactobacillus brevis cells by the application of high voltage pulses. Biotechnology and Bioengineering 1992, 40, 1412–1420.
- Shin, J.K.; Pyun, Y.R. Inactivation of Lactobacillus plantarum by pulsed‐microwave irradiation. Journal of Food Science 1997, 62, 163–166.
- Salam, A.; Guochen, Y.; Danfeng, S.; Tom, S.F. Antimicrobial effect of guava on Escherichia Coli O157: H7and Salmonella typhimurium in liquid medium. International Journal of Food Properties 2011, 14, 102–109.