
Abstract
Attenuated total reflectance Fourier transform infrared spectrometric method for determination of crocin in commercial saffron samples was studied. Calibration models were built based on the peaks at spectral region of 1700–900 cm−1 and spectral wavenumbers with correlation coefficient (r) greater than 0.99 were selected for quantification of crocin in the samples. The quantitative analysis of samples by attenuated total reflectance Fourier transform infrared was tested against reference UV-visible spectrophotometry method. Considerable correlation (r = 0.95) between both methods in prediction of crocin content among the saffron samples indicated that the proposed methodology has the potential application as a rapid screening tool.
INTRODUCTION
Saffron is the commercial name of dried stigmata from flowers of Crocus sativus L., which is cultivated in various countries, particularly India, Iran, Spain, and Greece, with Spain being the main producer.[Citation1] Each flower has three stigmata at the distal ends of the carpels. The stigmata are harvested by hand, followed by sorting and drying processes. One dried stigma weighs about 2 mg and 150–200 stigmata are required to obtain 1 g of saffron spice.[Citation2] Due to the high labor-intensive operation of saffron obtainment, saffron is one of the most expensive spices in the world. Poor saffron quality could be due to inappropriate harvesting and dehydration methods such as direct sun-drying, inadequate storage conditions, mixing with other non-colored plant parts or other plants such as Calendula officinalis.[Citation3,Citation4]
Saffron is highly valued as a culinary spice for its delicate aroma as well as seasoning and coloring properties.[Citation5] Moreover, saffron is also formulated and marketed as a food supplement and homeopathic preparations. Crocins (), major bioactive constituents found in saffron, are reported to possess several medicinal properties, such as antiepileptic, antioxidant, antidepressive properties, and cardioprotective effects.[Citation6,Citation7] Determination of authenticity and adulteration is a major issue in the food industry, particularly saffron with substantial commercial value, as adulteration may result in unfair competition among the saffron producers and compromise the consumers’ rights.[Citation5] Quality control (QC) of saffron is indispensible in sight of saffron’s prospective medicinal and curative properties on top of its price, as saffron is a subject of ongoing research for potential medicinal properties.[Citation2,Citation8]
FIGURE 1 Structure of crocin.
Commercial quality of saffron is classified by a uniform set of specifications recommended by the International Standardization Organization ISO/TS3632.[Citation1,Citation4] The specification is based on the characteristics of its major active constituents such as crocin, a type of carotenoid pigment which contributes greatly to coloring strength; and picrocrocin, which contributes to bitterness and taste of saffron and safranal, which is mainly responsible for aroma intensity. ISO/TS3632 establishes four empirical grades for color intensity based on estimation of the crocin content through UV-Vis spectroscopic absorbance at 440 nm.[Citation8,Citation9] Despite its rapidness, the reliability of this method is disputable as the degree of specificity is lower than other analytical methods including Fourier transform infrared spectroscopy (FTIR).[Citation1,Citation4,Citation8] For instance, a contamination of ground saffron with amounts up to 20% of Calendula flowers or ground turmeric may not be detected by UV-Vis spectroscopic analysis.[Citation9] Therefore, application of range of analytical techniques from basic analytical technique such as thin layer chromatography and liquid chromatography[Citation10] to a highly skilled method based on a DNA analysis called sequence-characterized amplified regions (SCARs) using specific markers for commonly used bulking agents[Citation11] have been studied to be able to detect the adulteration of processed food containing saffron. Each individual analytical approach have their specificity and limitations. For instance DNA analysis approach would allow the spice traders to avoid the adulteration of processed saffron containing foods but it does not detect the synthetic coloring agents which are commonly used to increase the grade.[Citation11]
The application of infrared spectroscopy with suitable chemometric algorithms have been shown to be advantageous for routine food QC.[Citation2,Citation9] Therefore, application of infrared spectroscopy in saffron QC has been investigated by Ordoudi and co-workers. They have reported the use of near-infrared spectroscopy (NIRS) and Raman spectroscopy in combination with chemometrics in quantification of the main saffron compounds and crocetin esters (crocins) in saffron, respectively.[Citation12,Citation13] Recently, Ordoudi et al.[Citation14] has also reported the use of Fourier-transform mid-infrared (FT-MIR) spectroscopy and chemometrics to use in the QC of traded saffron. These studies have focused on the determination of chemical compositions of saffron obtained from different geographical origins and monitoring of storage effects on quality of saffron. Over the last ten years, the use of attenuated total reflectance Fourier transform infrared spectroscopy (ATR-FTIR) has been reported in such analysis for most solids, liquids and gels.[Citation15] ATR-FTIR requires little pre-treatment work as samples can be analyzed at ambient temperature and pressure with little need for pre-processing.[Citation16,Citation17] As this technique requires less tedious sample preparation,[Citation15] it has the potential for use in rapid in situ quantitative analysis of saffron and it is comparable with ISO-recommended UV-Vis spectrometry approach.
Since the saffron production sector is made up from small to medium-size enterprises, an affordable and rapid technique is desired for routine saffron QC.[Citation12] Therefore, the objective of the present study was to investigate the application of ATR-FTIR in QC through qualitative and quantitative analysis of crocin and its sensitivity in comparison with ISO UV-Vis spectroscopy approach.
MATERIALS AND METHODS
Chemicals
Saffron (S1) and crocin were purchased from Sigma-Aldrich (St. Louis, MO, USA). Ethanol (96% v/v) was purchased from R&M Chemicals, Essex, United Kingdom. Potassium bromide (KBr) powder was supplied by PIKE Technologies (Madison, WI, USA). Saffron supplement (S5) with 177 mg equivalent of saffron per two capsules was also purchased from retail market in Malaysia.
Plant Material
Samples of dried saffron stigmata (S1, S2, S3, S4, S5) from different original sources were obtained from a retail market in Malaysia. Then, saffron stigmata were ground in a glass mortar and pestle. The ground saffron was passed through a 0.425 mm mesh.
UV-Visible Spectrophotometric Method
The ground saffron samples were extracted using both ethanol and water as extraction solvents as described below. All extraction procedures were performed in dimmed light environment to reduce the possibility of crocin isomerisation and photodegradation.
Instrumentation
Spectrophotometric assays were carried out with Shimadzu UV-1800 UV-Vis spectrophotometer (Shimadzu, Kyoto, Japan) using quartz cells of 1 cm path length. Absorbance between 190 and 900 nm were recorded in UV Probe 2.3.3 software (Shimadzu) using “spectrum” function. All measurements were taken at ambient temperature.
Preparation of saffron ethanol extract
Each type of pre-ground saffron samples (200 mg) was suspended in 20 mL of 70% v/v ethanol and stirred for 24 h in the dark. The resulting suspension was centrifuged at 50 Hz for 15 min at 10°C. The supernatant was collected and the precipitate layer was further extracted with 70% v/v ethanol for additional two times. The collected supernatant ethanol solutions were concentrated under vacuum pressure to give brownish syrup (124 g).
Preparation of saffron water extract
Saffron (20 mg) was weighed and placed in a 100 mL volumetric flask. Milli-Q ultrapure water (Millipore, Carrigtwohill, Ireland) was added to the sample up to calibration mark and the solutions were stirred for overnight. An aliquot of 20 mL was diluted with water to 100 mL. The solution was then filtered through a 0.45 μm pore size polyamide membrane filters (Sartorius Stedim Biotech, Bohemia, NY, USA). UV-Vis spectrophotometry was carried out for determination of coloring strength according to the specification of ISO/TS 3632-2:2003.[Citation12]
Determination of coloring strength
To determine the coloring strength according to the specification of ISO/TS 3632-2:2003,[Citation1] saffron samples from each source were prepared according to the ISO procedure. The UV absorbance of each sample () was read at 440 nm and repeated six times. Coloring strength was counted by the formula defined in Eq. (1).
where, A is absorbance reading from spectrophotometer, c is concentration of the sample (in grams per litre), and DF is dilution factor to 1% of solution.
Determination of Crocin Content in Saffron Samples
Calibration curve was produced by spectroscopic measurement of crocin (Sigma-Aldrich) in aqueous solutions. Least squares regression for quantification was used with seven concentration points (0.075–0.5 g/L). These solutions were prepared from a stock solution of 1 g/L crocin powder in distilled water. The UV absorbance readings of each concentration were taken at 440 nm as per ISO recommendation. The percentage of crocin content in the saffron samples was calculated using external calibration curve of authentic crocin standard at 440 nm. The content of crocin in the extracts was expressed %w/w. All measurements were performed in triplicate. The results are expressed as mean ± standard deviation (SD).
ATR-FTIR Spectroscopy
Instrumentation
Infrared spectra were recorded with Varian 600-IR series (Varian, Mulgrave, Australia) using a PIKE MIRacleTM single bounce Germanium crystal ATR accessory (PIKE technologies). The spectra were collected against the Germanium window background with data collected and processed through Varian Resolutions ProTM software (Varian). All spectra were recorded at 4 cm−1 resolution and were averaged of 16 scans. An analytical balance with 0.01 mg readability and minimum weight of 2 mg in fine range (Mettler Toledo, Columbus, OH, USA) was used to weigh saffron samples and supplements. All measurements were taken at ambient temperature.
Diluents for ATR
KBr powder was supplied by PIKE Technologies, Inc. The powder was kept in an amber glass jar at room temperature and stored in a desiccator containing silica gel due to hygroscopicity. KBr powder was ground prior to mixing with other materials. This was done by marble mortar and pestle of 50 mm diameter. Then, the powder was stored in aluminium foil at an ambient temperature for protection against moisture and light.
Determination of crocin content in saffron samples
FTIR spectra of crocin standard at the range of content(1–5 g/kg) in KBr as a diluent were collected. The absorbance peak at the wavenumbers of 1695, 1518, 1228, 1150, and 927 cm−1 were analyzed for their corresponding r values. The wavenumbers with r > 0.95 from ATR-FTIR spectra was selected for method validation and quantitative determination of crocin content in the commercial samples. The absorbance of each ground saffron sample was measured and recorded using air as a background. The percentage of crocin content in each sample was calculated by interpolating the absorbance values in the corresponding external calibration curve at the selected wavenumbers. The content of crocin in the extracts was expressed %w/w. All measurements were performed in triplicate. The results are expressed as mean ± SD.
Data processing
Equations for ATR-FTIR prediction were developed by Quant Calibration Application of the Resolutions Pro™ software (Varian). Correlation, one-way ANOVA and regression were performed using PASW Statistics 18 statistical package for Windows (SPSS, Chicago, IL, USA) for qualitative and quantitative analysis.
RESULTS AND DISCUSSION
UV-Visible Spetrophotometric Method
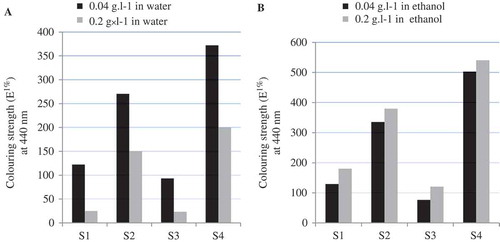
The overlaid spectra of aqueous and 70% v/v ethanol extracts of saffron stigma obtained from different locations at the concentrations of 0.2 g/L are shown in . The increase in absorption intensity with higher concentration at 440 nm permits the construction of calibration curve at this wavenumber. Based on linear regression analysis, the response of crocin in the concentration range of 0.075–0.200 g/L was linear. The calibration equations were y = 14.26x + 0.092 (n = 3, r = 0.99) for crocin in water and y = 13.21x + 0.127 (n = 3, r2 = 0.99) for crocin in 70% ethanol. The relative SD of the slopes was <4% for both solvents. The of the extracts at 440 nm was calculated to indicate for the coloring strength of saffron samples based on ISO approach (). The effect of solubility in determination of crocin content was confirmed by calculating at
value of crocin in both aqueous and 70% ethanol extract (0.04 and 0.20 g/L; ). The coloring strength of saffron samples were noted in the order of S4, S2, S1, and S3 as shown in .
FIGURE 2 UV-Visible spectrometry spectra of (a) 70% v/v ethanol extract of saffron samples S1, S2, S3, S4, and S5; (b) crocin standard.
FIGURE 3 Coloring strength [ measured at 440 nm for different concentrations of (a) water extract; (b) 70% v/v ethanol extract of saffron samples.
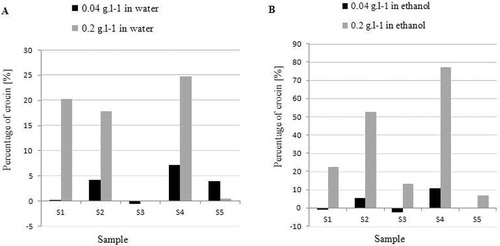
Comparison of crocin content obtained from water extract and 70% v/v ethanol extract of saffron samples is shown in . Observation of a large variation in crocin content obtained from aqueous and 70% v/v ethanol at different concentration () indicated the solvent effect in determination of crocin content.
TABLE 1 Coloring strength of each saffron samples at E1% 440 nm and respective ISO categories
FIGURE 4 Comparison of crocin percentage in two different concentrations of saffron extracts: (a) percentage of crocin in water extract; (b) percentage of crocin in 70% v/v ethanol extract of saffron samples.
ATR-FTIR Method
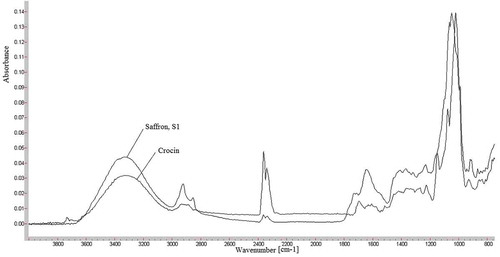
shows FTIR spectra of saffron, S1 (Sigma-Aldrich) and its bioactive component crocin (Sigma-Aldrich), respectively. The band at 3353 cm−1 is due to stretching vibration of O-H which indicates the presence of alcoholic groups in crocin. The two peaks between 2931–2925 cm−1correspond to C-H stretching vibration which is usually found in most molecules.[Citation18,Citation19] The two peaks in this region might be an indicative of aldehyde group found in volatile components of saffron such as safranal.[Citation20,Citation21] Therefore, quantification based on this peak might not be fully representative of crocin constituent. The C=O stretching vibration was found at 1647 and 1695 cm−1 in the spectra for saffron and crocin, which was lower than expected wavenumber between 1740–1700 cm−1 due to the presence conjugation of C=O and poly C=C bonds in crocin. The presence of bands at 1232–1410 cm−1 are due to stretching vibration of ester (O=C-O ) groups which are due to constituents of saffron such as dimethylcrocetin as well as alcohol groups found in carbohydrate moiety of crocin esters and picrocrocin.[Citation18,Citation19] The strong peak at 1150 cm−1 is due to the stretching vibration mode of conjugated C-C bonds of the central carotenoid chain, which is characteristic for carotenoids such as crocetin esters.[Citation17] This peak might also be a characteristic of pyranose moiety, with multi-chain peaks related to sequential arrangement of hydroxyl groups.[Citation22] The peak at 927 cm−1 corresponds to C-H out-of-plane deformations of trans-disubstituted ethylene groupings. Comparison of crocin and saffron’s FTIR spectra shows that the characteristic peaks in crocin are present in saffron. The peaks around 1518 and 1228 cm−1 in pure crocin samples are characteristically different in intensity compared with saffron samples. This indicates that quantitative calibrations based on these peaks are more sensitive and more indicative of other constituents rather than crocin.[Citation4] We considered wavenumbers related to distinct structural feature of crocin, such as, 927 cm−1 indicative of carotenoid structure[Citation23] and 1650 cm−1 ascribed to C=O stretching vibration in the selection of spectral wavenumbers for quantification of crocin in this study.
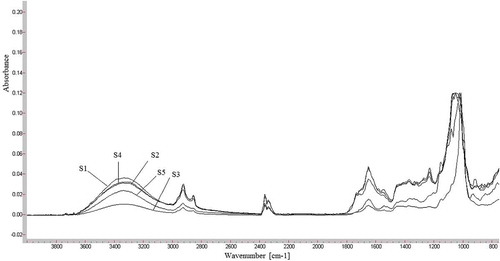
FIGURE 5 Overlay of FTIR spectra for different types of saffron products in Malaysian retail market.
The ATR-FTIR method was validated at the selected wavenumbers based on the International Conference on Harmonization (ICH) guidelines[Citation24,Citation25] The parameters included in the validation were linearity, sensitivity, precision, and accuracy. All the validation parameters were within the specified limits (). Linear correlation between the peak area and concentrations showed r values greater than 0.99 at the selected wavenumbers which indicates a good linearity. Sensitivity of the method was determined with respect to limit of detection (LOD) and quantification (LOQ). The LOD and LOQ were determined as recommended by ICH.[Citation8] The method was found to be sensitive. The 5 g/kg crocin calibration standard was selected as QC standard to assess the precision and accuracy of the ATR-FTIR method. Intra- and inter-day precision of the assay was evaluated by determining five times on the same day and continuously for five days at the QC concentration. The results of intra- and inter-day precision indicate acceptable precision with the method as the inter- and intra-day RSD data did not exceed 5%. Accuracy was determined by recovery studies. Recovery of crocin was estimated by adding QC standard to dry powdered saffron sample (Sigma-Aldrich) with known content and comparing the measured value with the true value as supplied with the material. The mean recovery determined at the QC standard in triplicates ranged from 97.82–98.65%. The RSD of recovery did not exceed 5%, which shows good accuracy quantitative method.
TABLE 2 Validation parameters for ATR-FTIR analysis of crocinin saffron samples at 927 and 1650 cm−1
The validated ATR-FTIR method was used to quantify crocin in commercial saffron samples. displays FTIR spectra of saffron samples (S1, S2, S3, S4) and the saffron supplement, S5 purchased from Malaysian retail market. The equivalent crocin content in these saffron samples were obtained from the calibration curve of the crocin at wavenumbers 927 and 1650 cm−1 as shown in .
TABLE 3 Determination of saffron and crocin content in samples at selected wavenumbers with r2 > 0.9 from ATR-FTIR spectra
FIGURE 6 Overlay FTIR spectra of crocin and saffron at room temperature (25°C).
Comparison of the UV-Visible and ATR-FTIR Methods
We noted acceptable consistency in obtaining the equivalent crocin content in these samples at 927 and 1650 cm−1. The calculated crocin content obtained at the selected wavenumbers were used to correlate with the crocin content obtained by measuring at 440 nm to support for the application of FTIR. A good correlation were observed between the coloring strength based on crocin content of
at 440 nm and the equivalent crocin content predicted by ATR-FTIR methods at 927 cm−1 (r = 0.97) and at 1650 cm−1 (r = 0.98 cm−1), respectively. This observation indicated that the result obtained from ATR-FTIR on the crocin content of saffron samples is comparable to the quantification of crocin content by the ISO approach using UV-Vis spectrophotometry. Findings of similar order of hierarchy in ranking of quality of samples suggested that the non-destructive ATR-FTIR methodology used in this study has a potential for application in QC of saffron products.
Crocin content in saffron supplement was undetected by UV-Vis method, unlike FTIR, which is sensitive enough to detect crocin content in the supplement. This reflected higher reliability and adequacy for FTIR application in quantification of crocin content in saffron-containing products as compared to UV-Vis method. The application of this methodology is particularly important for QC of saffron-containing products which claims the therapeutic properties of crocin. In addition, the waived need for water as solvent in ATR eliminates the variation in measuring crocin content resulted by its solubility. In this study, solvent effect was observed in the determination of crocin content by the spectrophotomeric method. Hence, ATR-FTIR quantification on solid samples is more accurate than UV-Vis approach as interferences on ATR-related qualitative and quantitative analysis by diluents and solvents are fairly negligible.
CONCLUSION
Saffron is one of the most expensive spices in the world due to labor-intensive cultivation, harvesting, and processing. This promotes adulterations and compromise on the quality of saffron-related products. ATR-FTIR technique for QC of saffron is potentially advantageous over other spectroscopic methods due to its rapidness and simplicity in sample preparation. The non-destructive and sensitive nature of ATR-FTIR technique allows minimal sample amount requirement and preparation with no requirement of solvent, which is ideal for the expensive and volatile nature of saffron. Variations of coloring strength due to solvent selection and concentration difference were reflected in ISO-recommended UV-Vis spectroscopy, unlike ATR-FTIR. With future development of standard multivariate calibration reference protocol, ATR-FTIR could be a simple, rapid but powerful, and reliable methodology for qualitative and subsequently quantitative analysis of saffron and saffron containing products.
FUNDING
The authors are grateful to Monash University Malaysia for the financial and facilities supports.
Additional information
Funding
REFERENCES
- Lozan, P.; Delgado, D.; Gómez, D.; Rubio, M.; Iborra, J.L. A non-destructive method to determine the safranal content of saffron (Crocus sativus L.) by supercritical carbon dioxide extraction combined with high-performance liquid chromatography and gas chromatography. Journal of Biochemical and Biophysical Methods 2000, 43, 367–378.
- Tarantilis, P.A.; Beljebbar, A.; Manfait, M.; Polissiou, M. FT-IR, FT-Raman spectroscopic study of carotenoids from saffron (Crocus sativus L.) and some derivatives. Spectrochimica ActaA 1998, 54, 651–657.
- Raina, B.L.; Agarwal, S.G.; Bhatia, A.K.; Gaur, G.S. Changes in pigments and volatiles of saffron (Crocus sativus L. ) during processing and storage. Journal of the Science of Food and Agriculture 1996, 71, 27–32.
- Naviglio, D.; Conti, S.; Ferrara, L.; Santini, A. Determination of moisture in powder and lyophilised saffron (Crocus sativus L.) by Karl Fischer method. The Open Food Science Journal 2010, 4, 1–6.
- Anastasaki, E.; Kanakis, C.; Pappas, C.; Maggi, L.; Del Campo, C.P.; Carmona, M.; … Polissiou, M.G. Geographical differentiation of saffron by GC–MS/FID and chemometrics. European Food Research and Technology 2009, 229, 899–905.
- Hosseinzadeh, H.; Sadeghnia, H.R. Protective effect of safranal on pentylenetetrazol-induced seizures in the rat: Involvement of GABAergic and opioids systems. Phytomedicine 2007, 14, 256–262.
- Gupta, M. Pharmacological properties and traditional therapeutic uses of important Indian spices: A review. International Journal of Food Properties 2010, 13, 1092–1116.
- Lage, M.; Cantrell, C.L. Quantification of saffron (Crocus sativus L.) metabolites crocins, picrocrocin, and safranal for quality determination of the spice grown under different environmental Moroccan conditions. Scientia Horticulturae 2009, 121, 366–373.
- Sabatino, L.; Scordino, M.; Gargan, M.; Belligno, A.; Traulo, P.; Gagliano, G. HPLC/PDA/ESI-MS evaluation of saffron (Crocus sativus L.) adulteration. Natural Product Communications 2011, 6, 1873–1876.
- Sujata, V.; Ravishankar, G.A.; Venkataraman, L.V. Methods for the analysis of the saffron metabolites crocin, crocetins, picrocrocin, and safranal for the determination of the quality of the spice using thin-layer chromatography, high-performance liquid chromatography and gas chromatography. Journal of Chromatography A 1992, 624, 497–502.
- Torelli, A.; Marieschi, M.; Bruni, R. Authentication of saffron (Crocus sativus L.) in different processed, retail products by means of SCAR markers. Food Control 2014, 36, 126–131.
- Zalacain, A.; Ordoudi, S.A.; Diaz-Plaza, E.M.; Carmona, M.; Blazquez, I.; Tsimidou, M.Z.; Alonso, G.L. Near-infrared spectroscopy in saffron quality control: Determination of chemical composition and geographical origin. Journal of Agricultural and Food Chemistry 2005, 53, 9337–9341
- Anastasaki, E.G.; Kanakis, C.D.; Pappas, C.; Maggi, L.; Zalacain, A.; Carmona, M.; Alonso, G.L.; Polissiou, M.G. Quantification of crocetin esters in saffron (Crocus sativus L. ) using Raman spectroscopy and chemometrics. Journal of Agriculture and Food Chemistry 2000, 58, 6011–6017.
- Ordoudi, S.A.; Pascual, M.M.; Tsimidou, M.Z. On the quality control of traded saffron by means of transmission Fourier-transform mid-infrared (FT-MIR) spectroscopy and chemometrics. Food Chemistry 2014, 150, 414–421.
- Miller, A.L.H.; Flores, E.M.M.; Miller, E.I.; Silva, F.E.B.; Ferrao, M.E.F. Attenuated total reflectance fourier transform infrared spectroscopy and different PLS algorithms for simultaneous determination of clavulanic acid amoxicillin in powder pharmaceutical formulation. Journal of the Brazilian Chemical Society 2011, 22, 1903–1912.
- Baranski R.; Baranska, M.; Schulz, H. Changes in carotenoid content and distribution in living plant tissue can be observed and mapped in situ using NIR-FT-Raman spectroscopy. Planta 2005, 222, 448–457.
- Ozaki, Y.; Cho, R.; Ikegaya, K.; Muraishi, S.; Kawauchi, K. Potential of near-infrared Fourier transform Raman spectroscopy in food analysis. Applied Spectroscopy 1992, 46, 1503–1507.
- Pavia, D.L. Introduction to Spectroscopy. Brooks/Cole: London, 2009.
- Sabourdy, F.; Kedjouar, B.; Sorli, S.C.; Colié, S.; Milhas, D.; Salma, Y.; Levade, T. Functions of sphingolipid metabolism in mammals—Lessons from genetic defects. BBA–Molecular and Cell Biology of Lipids 2008, 1781, 145–183.
- Silverstein, R.M.; Webster, F.X.; Kiemle, D.J. Spectrometric Identification of Organic Compounds. John Wiley & Sons: Somerset, NJ, 2005.
- Williams, D.H.; Fleming, I. Spectroscopic Methods in Organic Chemistry. McGraw-Hill: London, 2008.
- Bellon-Maurel, V.; Vallat, C.; Goffinet, D. Quantitative analysis of individual sugars during starch hydrolysis by FT-IR/ATR spectrometry. Part I: Multivariate calibration study—repeatibility and reproducibility. Applied Spectroscopy 1995, 49, 556–562.
- Schwieter, U.; Englert, G.; Rigassi, N.; Vetter, W. Physical organic methods in carotenoid research. Pure Applied Chemistry 1969, 20, 365–420.
- Validation of analytical procedures: Text and Methodology. International Conference on Harmonization (ICH), Guideline Q2(R1); Geneva, November 2005, pp. 1–13.
- Thompson, M.; Ellison, S.L.R.; Wood, R. IUPAC-Harmonized guidelines for single-laboratory validation of methods of analysis, IUPAC Technical report. Pure Applied Chemistry 2002, 74, 835.